1. Background
Hepatocellular carcinoma (HCC) is primarily an ordinary cause of cancer-related death worldwide, especially in China (1-6). The incidence of HCC keeps the highest in Eastern Asia and Africa, while its frequency has been increased rapidly in western countries and Japan as well (7, 8). Transcatheter arterial chemoembolization (TACE) is one of the most common therapeutic methods for large or multinodular HCCs, which cannot undergo other treatments such as resection or radiofrequency ablation (9). After TACE treatment, follow-up imaging modalities such as computed tomography (CT) and magnetic resonance imaging (MRI) are performed to assess therapeutic efficacy such as lipiodol deposition and residual cancer. However, there are some limitations in individuals. For example, a hypovascular residual cancer can be more difficult to assess on CT, because accumulation of lipiodol in tumors can mask its enhancement. In contrast, MRI is superior to CT in showing residual tumor (10-13), but cannot demonstrate lipiodol deposition. Therefore, there is a need for a new option able to monitor both lipiodol deposition and residual cancer for HCC after TACE. Recently, a new CT scanning mode depended on the rapid switching of high and low tube voltages on neighboring views during a single rotation has been generated on high-definition Discovery CT750 HD scanner. This spectral CT imaging model is called Gemstone Spectral Imaging (GSI) mode, which provides correct registration of data sets for conduction of accurate material decomposition images (e.g. water- and iodine-based material decomposition images) for quantitative density measurement and monochromatic images at energy levels ranging from 40 to 140 keV for optimized angiographic imaging. Spectral CT has potential to make hyperenhancing lesions brighter on the attenuation scale by taking advantage of the markedly increased density of iodine at photon energy levels just above the outmost electron binding energy.
2. Objectives
The aim of this study was to investigate the usefulness of spectral CT imaging in assessment of lipiodol deposition and residual cancer for HCC after TACE.
3. Patients and Methods
3.1. Patients
The ethics committee at our institution approved this prospective study and all patients provided written informed consent. From April to November 2014, 10 HCC male patients (mean age of 61 years, ranged 50 to 73 years) after TACE underwent both MRI and multiple-phase CT scanning. The examiner of CT and MRI was identical for 10 cases. None of the cases underwent other treatment options except TACE. TACE sessions were performed for patients from 1 to 6 times. The interval between TACE and MRI imaging examination was 2-3 days, and the interval between MRI and CT imaging examination was 7-14 days.
3.2. MRI Examinations
Three-phase contrast material-enhanced MRI examinations were performed using the Discovery MRI750 3T scanner (General Electric Healthcare, Milwaukee, USA) with a peak gradient amplitude of 45 mT/m and maximal gradient slope of 200 T/ms. An eight-channel torso phased array coil was centered over the liver. The conventional MRI protocol was adopted in this experiment containing transverse respiratory-navigated T2-weighted fat-suppressed turbo spin echo sequence [repetition time (TR)/echo time (TE) = 3500/84 ms; section thickness, 5 mm; intersection gap, 1 mm; field of view optimized to patients’ body habitus, 285 × 214-308 × 380 mm; matrix, 168 × 320] and transverse T1-weighted in-phase and out-phase gradient echo [TR/TE = 6.8/2.35 (in-phase), 4.75 (out-phase) ms; section thickness, 5 mm; intersection gap, 1 mm; field of view optimized to patients’ body habitus, 285 × 214-308 × 380 mm; matrix, 180 × 320]. Dynamic imaging was performed once before and three times after intravenous administration of gadopentetate dimeglumine (Magnevist; Bayer Healthcare, Germany) with a transverse breath-hold T1-weighted three-dimensional volumetric interpolated body examination sequence (TR/TE = 5.0/2.3 ms; section thickness, 2 mm; no intersection gap; field of view optimized to patients’ body habitus, 285 × 214-308 × 380 mm; matrix, 270 × 360). Gadopentetate dimeglumine was administered at a dose of 0.1 mmol/kg and a rate of 2 mL/s followed by a 20 mL saline flush by a power injector (Spectris; Medrad, Pittsburgh, PA, USA). The acquisitions were performed at 30 s, 60 s and 180 s after contrast administration during the hepatic arterial phase (AP), portal venous phase (PP) and delayed phase, respectively.
3.3. CT Examinations
Two-phase contrast material-enhanced spectral CT examinations were used by the Discovery CT750 HD scanner (General Electric Healthcare, Wisconsin, USA). All patients were scanned craniocaudally while in the supine position. After scout CT scanning, patients received nonionic contrast materials (ioversol, Optiray 350; Tyco Healthcare, Montreal, Quebec, Canada) with antecubital venous access at a rate of 3-4 mL/s. A total of 70-110 mL (1.5 mL per kilogram of body weight) was injected during phases of AP and PP. AP scanning automatically began at 30 seconds after the trigger attenuation threshold [100 Hounsfield unit (HU)] was reached at the level of supraceliac abdominal aorta (10). PP scanning began with a delay of 30 seconds after AP scanning. AP and PP scanning were performed in the spectral imaging mode with fast tube voltage switching between 80 and 140 keV on adjacent views during a single rotation. Other scanning parameters were as follows; collimation thickness of 0.625 mm, tube current of 600 mA, rotation speed of 0.6 second, helical pitch of 0.983 and CT dose index volume of 21.8 mGy (comparable to 21.5 mGy dose administered for conventional contrast-enhanced liver scanning in a normal-size patient with body mass index within normal range at our institution). CT images were reconstructed by projection-based material-decomposition software and a standard reconstruction kernel. The adaptive statistical iterative reconstruction algorithm was applied to suppress image noise on decomposition images. Three types of images were reconstructed from the single spectral CT acquisition for analysis: conventional polychromatic images obtained at 140 keV, iodine-based material decomposition images and monochromatic images obtained at energies ranging from 40 to 140 keV.
3.4. Imaging Analyses
MRI imaging studies were evaluated in consensus by two radiologists (each with more than 10 years experience in abdominal imaging) on a picture archiving and communication system (PACS) (Impax 6.4, Agfa, Mortsel, Belgium). The gold standard of a residual cancer was defined as a hypervascular nodule seen on gadoxetic acid-enhanced arterial phase MRI images with a washout pattern considered a residual HCC (14). Washout, a unique feature of HCC, was described as a change from high intense relative to the intense of the liver during the AP to isointense or hypointense relative to that of the liver during the PP. All the measurements of spectral CT were performed on an advanced workstation (AW4.4; GE Healthcare, Waukesha, WI, USA) with the GSI viewer. The default 70-keV monochromatic images and iodine-based material decomposition images were reviewed. Circular or elliptical regions of interest (ROIs) were drawn to encompass as much of the hyperenhancing portion of the lesion as possible (mean pixel number 100, range 20-190) from three contiguous slices. Mean CT data for the adjacent hepatic parenchyma as the background regions was obtained by manually placing circular ROIs in the hepatic parenchyma (mean pixel number of 200, range 100-280). Areas of focal change in hepatic parenchymal attenuation, large vessels and prominent artefacts were avoided carefully. To ensure consistency, all measurements were performed three times at different image levels and average values were calculated. For all measurements, the size, shape and position of the ROIs were kept consistent between the two phases by applying the copy-and-paste function. The spectral CT imaging studies were assessed by other two radiologists, each of them with more than eight years experiences in abdominal imaging. The GSI viewer software package automatically calculated the CT values, iodine (water), water (iodine) concentration for the lesions and normal hepatic parenchyma. Two parameters were derived from the CT values measurements: 1) contrast-to-noise ratio (CNR) at different energy levels (40-140 keV, interval 10 keV), calculated as CNR = (CT lesion-CT liver)/SD noise, where CT lesion and CT liver are the CT values in the lesions and in the normal hepatic parenchyma and SD noise is the standard deviation for CT values of the normal parenchyma as background; 2) The lesion-to-normal parenchyma ratio (LNR), calculated as LNR = CT lesion/CT liver, where CT lesion and CT liver are the CT values in the lesions and in the normal hepatic parenchyma.
Spectral CT images including conventional polychromatic images, monochromatic images and iodine-based material decomposition images were reviewed with GSI viewer in consensus at a workstation. The readers were blinded to MRI diagnosis of lesion, patient information and results of correlative imaging examinations. They recorded the following lesion features: number, density, presence of feeding vessels and enhancement pattern. To detect ability of each set of images, the true number of lesions in each image set was evaluated by comparing them with standard-of-reference findings. The relative density of the lesion with respect to the hepatic parenchyma was recorded as one of three grades of hypodensity, isodensity and hyperdensity. The enhancement pattern was described homogeneously or heterogeneously. The changes in enhancement degree or pattern between the two phases were characterized as expansion, washout or none. Finally, readers in consensus characterized each lesion as a residual HCC based on imaging findings. The typical enhancement pattern for residual HCC consisted of a rapid enhancement in the AP with a relatively quick washout in the PP, which was called “quick in and quick out”. Differences between the observers were resolved by consensus conference. The sensitivity and specificity of residual HCC on the individual phase were evaluated compared to MRI consequences.
3.5. Statistical Analysis
Data was analyzed using SPSS ver. 19 (IBM SPSS Statistics for Windows, IBM Corp., Armonk, NY, USA). Quantitative values were recorded as mean ± standard deviation. Receiver operating characteristic (ROC) curves were generated to help establish the threshold values of LNR required for significant differentiation of HCC. The diagnostic capability was determined by calculating the area under the ROC curve. The null hypothesis test was that the area under the ROC curve was 0.5; the alternative was that this area was greater than 0.5.
4. Results
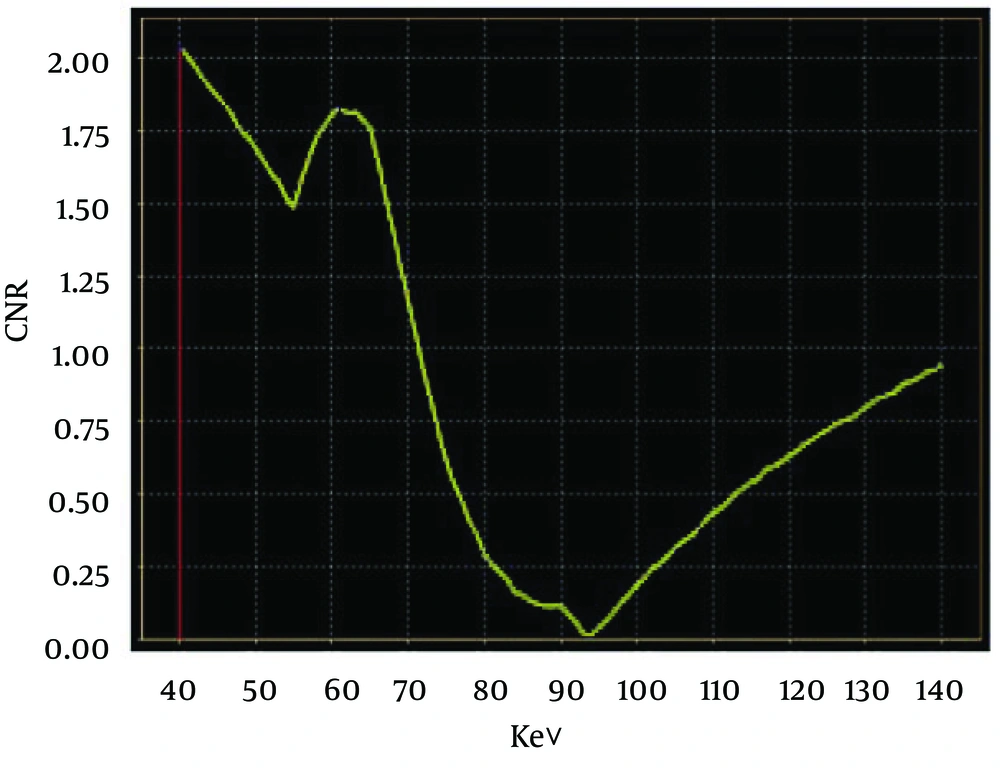
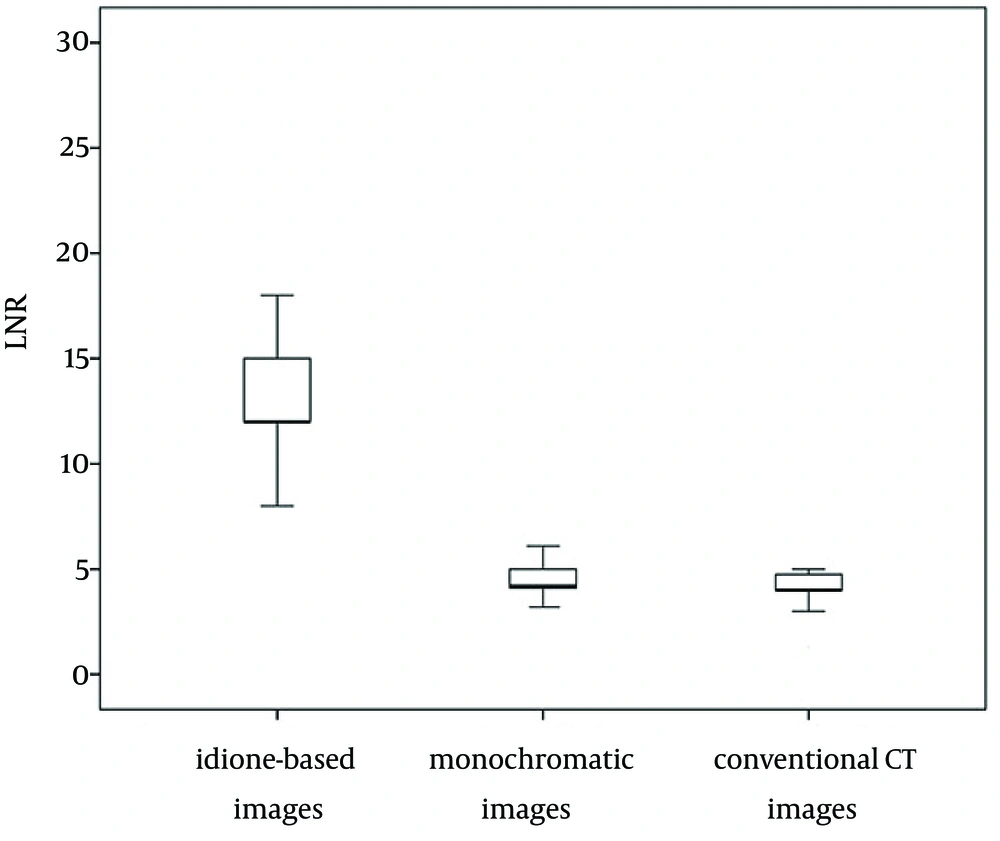
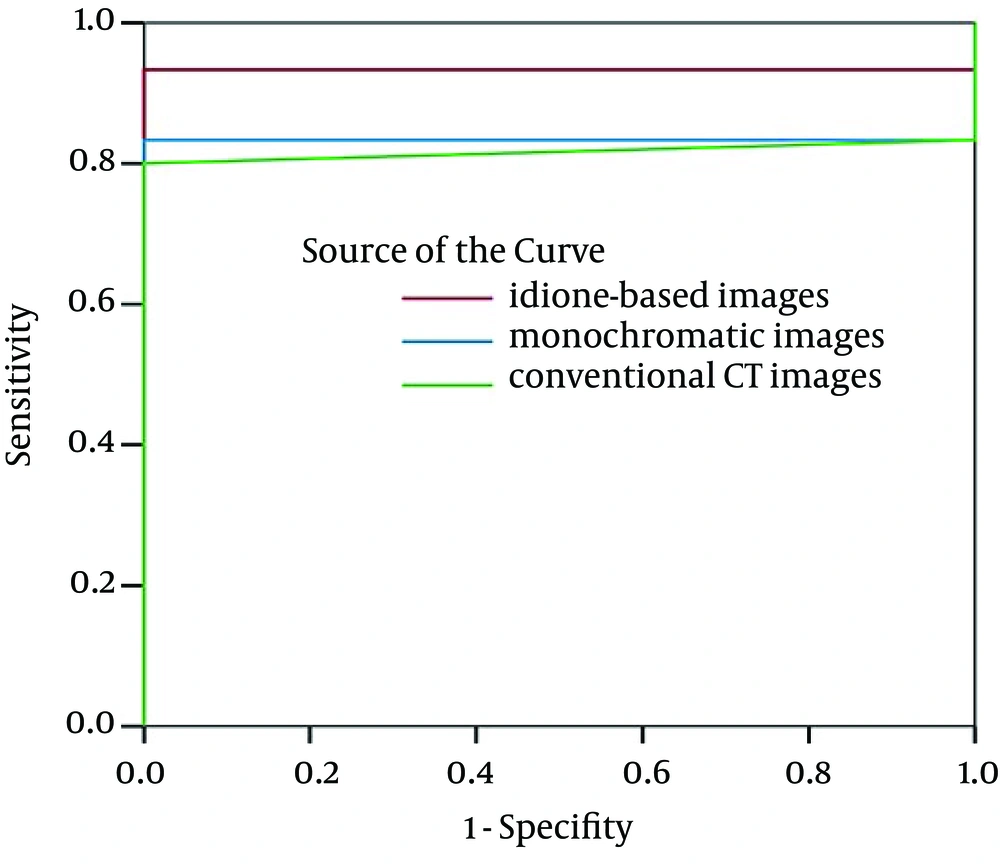
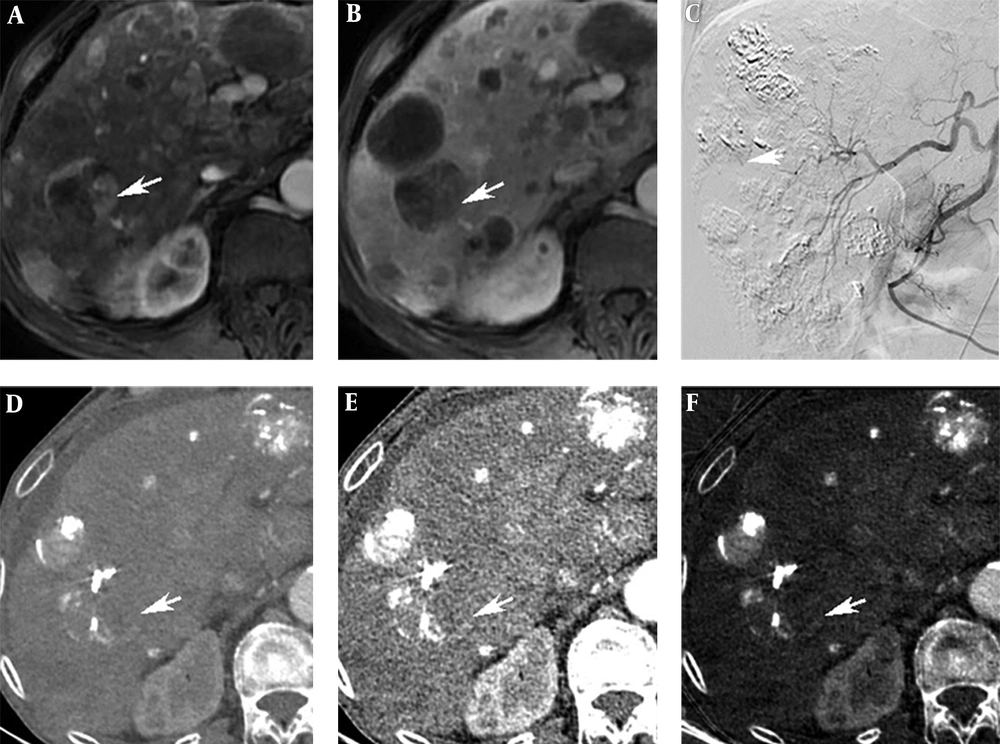
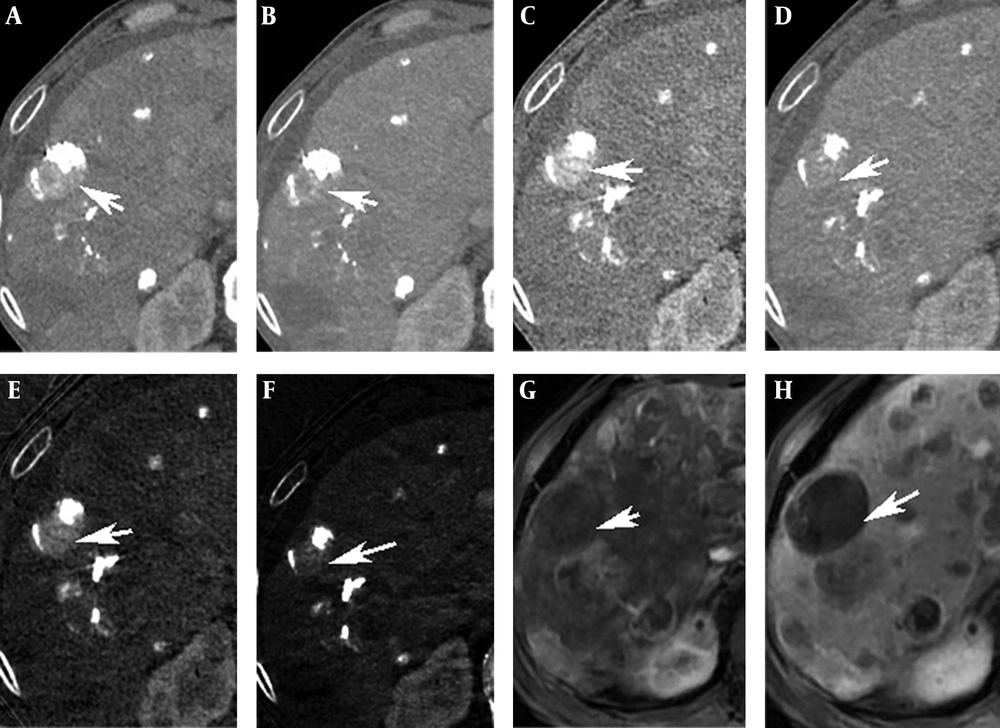
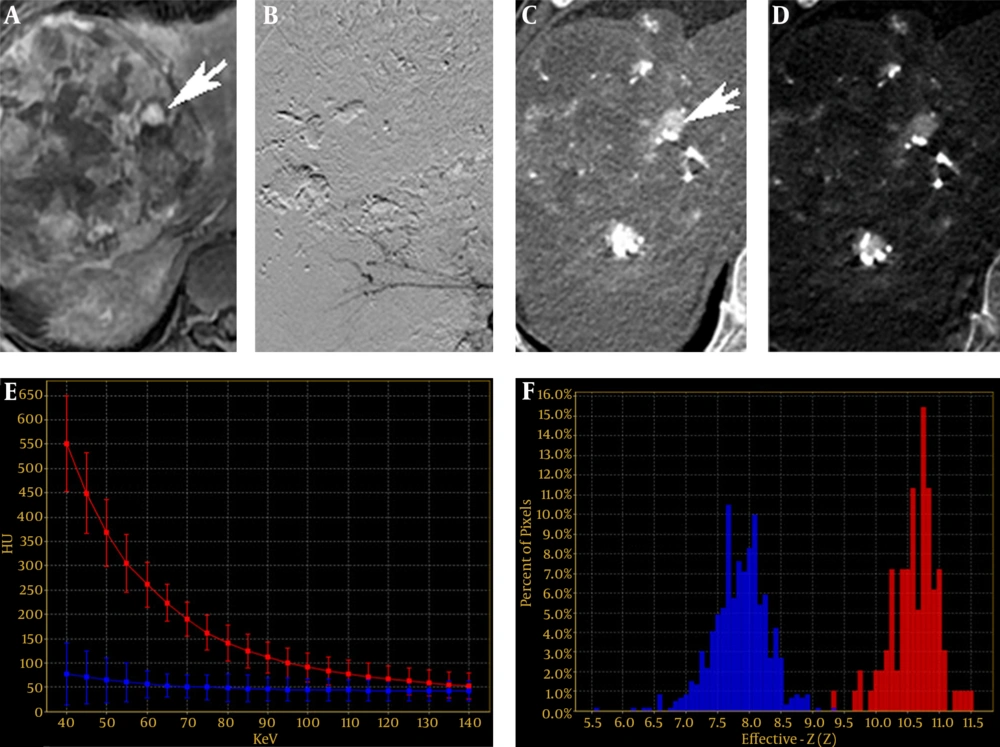
There were 30 residual lesions detected in MRI. Table 1 shows that they were found in iodine-based images and monochromatic images versus 29 in conventional CT images. The lesion-liver CNR for residual HCC at different energy levels (40-140 keV, interval 10 keV) showed certain regularity (Figure 1). In general, the lesion-liver CNRs at low energy levels (40-70 keV) were higher than those at high energy levels (80-140 keV). The optimal CNR for HCC could be obtained at 40 keV. Box plots of LNR in diagnosing residual HCC with conventional CT images, monochromatic images and iodine-based material decomposition images are shown in Figure 2. The results of iodine-based material decomposition images were significantly higher than the other two groups. Moreover, the ROC curves of them for detecting residual HCC are shown in Figure 3. The areas for the LNR during the AP of conventional CT, monochromatic images and iodine-based material decomposition images were 0.817 (0.677-0.956), 0.833 (0.700-0.967) and 0.933 (0.844-1.023), respectively (Table 2). The area of iodine-based images was evidently greater than that for other quantitative parameters for diagnosing HCC. Figure 4 shows that a residual HCC was easily missed on conventional CT images, but could be detected on iodine-based material decomposition images and 40 keV of monochromatic images. In fact, all of the residual HCCs were consequently detected on 40 keV of monochromatic images, especially on iodine-based material decomposition images. Therefore, the iodine-based material decomposition images showed a higher detectability than conventional polychromatic images. Figure 4 shows that monochromatic images and iodine-based images detected a hypovascular residual cancer, but conventional CT images could not detect it. Figure 5 displays that conventional CT images and monochromatic images found a false positive lesion (lipiodol deposition) as there was non-enhancement of MRI on the AP; however, iodine-based images made a right diagnosis due to a still hyperattenuated lesion on the PP. Figure 6 shows that iodine-based material decomposition images and 40 keV of monochromatic images clearly displayed the residual HCCs and spectral CT contained many methods to demonstrate the LNR of residual HCCs.
| Images | True Positive | False Positive | False Negative |
|---|---|---|---|
| Iodine-based images | 30 | 0 | 0 |
| Monochromatic images | 30 | 1 | 0 |
| Conventional CT images | 29 | 1 | 1 |
Box plots of LNR in diagnosing residual HCC with conventional CT images, monochromatic images and iodine-based material decomposition images. The average LNR of iodine-based material decomposition images was greater than that of monochromatic images and the average LNR of monochromatic images was greater than that of conventional CT images.
ROC curves for LNR on the AP in diagnosing residual HCC with conventional CT images, monochromatic images and iodine-based images. The area under ROC curve of iodine-based material decomposition images was greater than that of monochromatic images and the area under the ROC curve of monochromatic images was greater than that of conventional CT images.
| Images | Area | Standard Error | 95% Confidence Interval |
|---|---|---|---|
| Iodine-based images | 0.933 | 0.046 | 0.844 - 1.023 |
| Monochromatic images | 0.833 | 0.068 | 0.700 - 0.967 |
| Conventional CT images | 0.817 | 0.071 | 0.677 - 0.956 |
a Abbreviations: HCC; Hepatocellular Carcinoma, ROC; Receiver Operating Characteristic.
A 71-year-old man with a 42-mm HCC in the right posterior lobe of liver. A, A Residual cancer in MRI on the AP (arrow). B, Residual cancer in MRI on the PP (arrow). C, Interventional CT image showed a hyperattenuated lesion (arrow). D, Conventional polychromatic image on the AP did not show the lesion clearly. E, Monochromatic image at 40 keV on the AP. F, Iodine-based material decomposition image on the AP showed a hyperattenuated lesion (arrow).
A 71-year-old man with a 42-mm HCC in the right posterior lobe of liver. A and B, Conventional CT image on the AP and PP. C and D, Monochromatic image at 40 keV on the AP and PP showed a likely residual cancer (arrows). E and F, Iodine-based material decomposition image on the AP and PP showed a still hyperattenuated lesion on the PP (arrows). G, H, MRI on the AP and PP presented no residual cancer (arrows).
A 51-year-old man with a 140-mm HCC in the right lobe of liver. A, A residual cancer of MRI on the AP (arrow). B, Interventional image showed no residual cancer. C, Monochromatic image at 40 keV on the AP showed a hyperattenuated lesion (arrow). D, Iodine-based material decomposition image on the AP. E and F, Spectral curves and histogram for residual cancer and liver were obviously different (red is the residual HCC, blue is the liver parenchyma).
5. Discussion
HCC is the sixth most frequent cancer worldwide and the third most prevalent cancer resulting in death (15). However, only a few patients with HCCs are surgical candidates at diagnosis (16, 17). TACE is one of the most ordinarily performed therapies to treat unresectable HCCs. TACE usually contains intra-arterial delivery of emulsions mixed with chemotherapeutic agents and lipiodol, followed by administration of embolic agent. It has been demonstrated that the amount of intratumoral lipiodol deposition and the proportion of residual cancer associate well to tumor necrosis, tumor recurrence and survival rate after TACE (18-20). Accurate and quick assessment of lipiodol deposition and residual cancer is especially relevant for HCC after TACE and provides interventional radiologist with better information to evaluate the effect of TACE and to offer feedback for TACE (18-22). MRI is optimal to detect viable tumor with higher sensitivity owing to better contrast of different soft tissues and higher spatial resolution than CT; whereas, absence of presentation of lipiodol disposition. In clinical practice, CT is usually performed before MRI due to its cost-effectiveness. Although CT is usually used to monitor lipiodol disposition of TACE for HCC, there is a considerable difficulty in accurately detecting residual viable tumor with this modality, because high attenuation of iodized oil makes it difficult to differentiate areas of true enhancement from areas of reserved lipiodol. For example, in our study, the conventional CT images omitted a positive residual cancer. In this study, spectral CT imaging not only contained the monochromatic CT images and iodine-based material decomposition images for the detection and characterization of residual cancer, but also provided kinds of quantitative maps (e.g. spectral curve, scatterplot, histogram) to distinguish residual cancer from adjacent liver. Spectral CT imaging can produce monochromatic images at energy levels ranging from 40 to 140 keV, which is devoid of averaging attenuation effects (23). This would promote increasing contrast spatial resolution. The optimal monochromatic images obtained at optimal keV markedly improved CNR of residual HCC. As shown in our study, 40 keV monochromatic images showed a higher ability to detect HCCs than conventional polychromatic images. The above omitted residual cancer by conventional CT was detected in spectral CT. Iodine-based material decomposition images were used for quantifying iodine concentrations whatever the amount of iodine (24). For hypovascular liver lesions, iodine-based material decomposition images could show focal uptake of iodinated contrast material obviously attributed to low defect of lipiodol deposition. For example, there was a lipiodol deposition mistaken for a false residual in the conventional CT images and monochromatic images; whereas, the iodine-based material decomposition images provided a right diagnosis. Besides, as shown in our study, the average LNR of iodine-based material decomposition images was significantly higher than the conventional CT images, which showed a higher ability of displaying residual HCCs. ROC curves analyses in the present study revealed that compared with conventional qualitative image analysis, iodine-based material decomposition images with spectral CT improved the sensitivity. The iodine concentration lesions derived from the iodine-based material decomposition images are quantitative, as demonstrated in in vitro experiments, and thus might be a useful parameter (23).
The present study had some limitations. First, the results were preliminary and need to be verified by additional studies on larger number of lesions. Second, because the readers assessed the images in consensus, intra- or interobserver variability data are lacking. In conclusion, spectral CT imaging with quantitative analysis of iodine concentration may be helpful for increasing the accuracy of follow-up of patients with HCC after TACE. Further research is necessary to evaluate clinical value of quantitative measurements of iodine concentrations.
