1. Introduction
Although neuropsychiatric involvement is found in up to 75% of systemic lupus erythematosus (SLE) patients (1), the diagnosis is complex due to the variety of its manifestations from migraine to madness and the reluctance of the brain biopsy. Magnetic resonance imaging (MRI) remains the gold standard for non-invasive assessment of neuropsychiatric SLE (NPSLE), which describes various abnormalities ranging from normal to subcortical hyperintense lesions, hemorrhage, infarcts, and brain atrophy (2). The underlying pathologic insult could be ischemia, vasculitis, neuronal loss, and/or demyelination (3, 4). Among these insults, demyelination such as confluent white matter change in this case is less prevalent and relatively not understood (5, 6). Here, we report a case of NPSLE, who had bulbar symptoms including impaired memory, slurred speech, and swallowing difficulty, whose MRI showed symmetric confluent lesions in the bilateral cerebral white matter on T2 weighted imaging (T2-WI). As far as we know, this is the first case report that demonstrates corticobulbar tract (CBT) involvement in a patient with NPSLE. The case was approved by the institutional review board of Kyungpook National University hospital that waived the requirement of patient informed consent for the retrospective investigation.
2. Case Presentation
A 36-year-old woman without any specific disease history presented with depressed mood disorder for 3 months. Her mood did not improve despite psychiatric treatment. The patient showed impaired memory, slurred speech, and difficulty in swallowing 7 days before admission. Her laboratory findings showed leukopenia, lymphocytopenia, low serum complement (C3: 43 mg/dL, reference, 90 - 180; C4: 4.1 mg/dL, reference, 10 - 40), positive anti-double stranded DNA antibodies, positive anti-Sm antibodies (> 8.0), and positive antinuclear antibodies (ANA, 3+). As four of the eleven criteria were documented specific for diagnosis of SLE under the 1999 revised American college of rheumatology (ACR) criteria, a confirmed diagnosis of SLE was confirmed. There was no abnormality in antiphospholipid antibodies including lupus anticoagulant, anticardiolipin antibodies, and anti-β2 -glycoprotein I antibodies. Electrolytes were within the normal ranges and cerebrospinal fluid (CSF) study was normal. The patient did not experience chill or fever and no evidence of viral or bacterial infection was evident after extensive evaluation, including blood cultures, HIV, and syphilis serology.
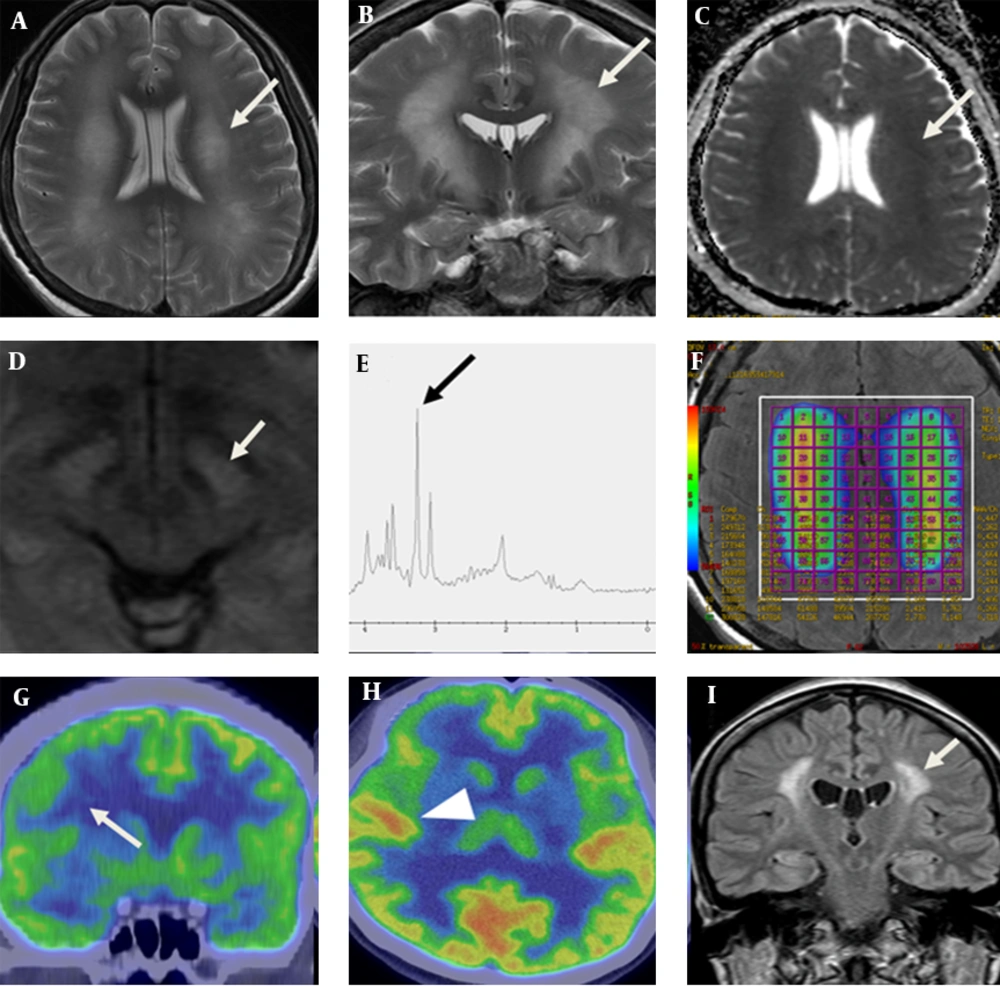
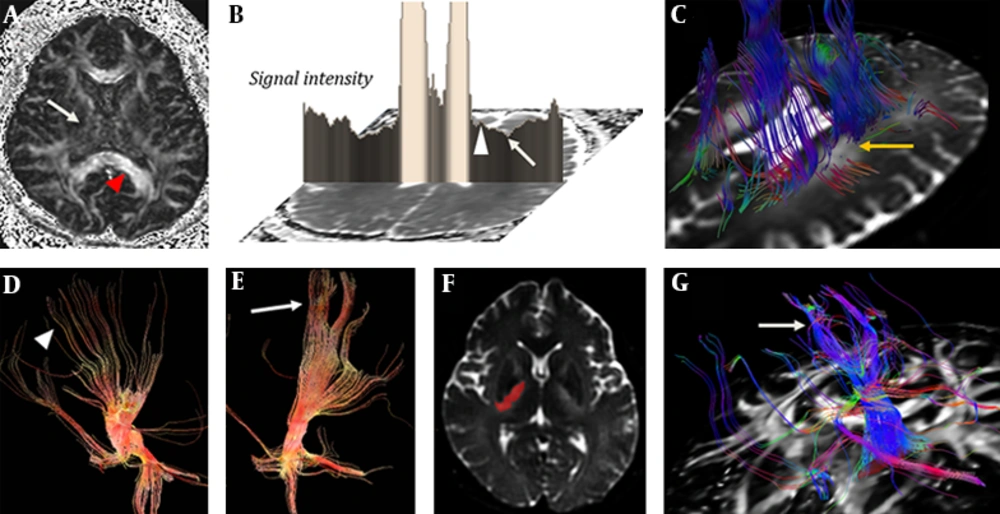
Diffuse and symmetric hyperintense areas of the bilateral cerebral white matter are shown on T2-WI, which shows slight diffusion restriction on ADC map obtained from a 3.0 T MR machine (GE Discovery MR750, GE Healthcare, Waukesha, WI). At the level of midbrain, high signal intensities (arrow) are detected in the medial side of crus cerebri on diffusion-weighted image. MR spectroscopy (MRS) showed decreased N-acetyl aspartate (NAA)/creatine (Cr) and increased choline (Cho)/Cr. Positron emission tomography computed tomography (PET CT) showed decreased fluorodeoxyglucose (FDG) uptake of the gray matter of precentral gyrus lateral to hand knob (Figure 1). Fractional anisotropy (FA) values of both internal capsules are decreased as compared with other white matters such as corpus callosum. Diffusion tensor imaging (DTI) tractography, starting from a seeded region of interest (ROI) including the midbrain showed relatively sparse fibers around T2 high signal intensity lesions (Figure 2). Parameters for DTI are as follow: b values of 1000 s/mm2; 45 different directions; 70 axial sections with 4 mm slice thickness without gap; repetition time to echo time (TR/TE) 8,000/90 ms; FA 90°. The patient had less trackable fibers within the whole brain as compared with the control subject using post-processing software (FuncTool, GE Healthcare, Waukesha, WI) (Appendix 1). Fibers passing the T2 high signal intensity lesions are sparser than those passing the lateral one-fourth of the crus cerebri (Figure 2).
A 36-year-old woman with neuropsychiatric SLE. Axial (A) and coronal (B) T2 weighted magnetic resonance imaging show diffuse and symmetric hyperintense areas of the bilateral cerebral white matter including the corticobulbar tract (white arrow), which shows slight diffusion restriction on ADC map (C). At the level of midbrain, high signal intensities (arrow) are detected in the medial side of crus cerebri on diffusion-weighted image (D). MR spectroscopy (E) shows increased choline (arrow) and myo-inositol peaks and decreased NAA peak. Color coding map of multi-voxel MRS (F) shows increased ratio of choline/creatinine. Coronal (G) and axial view (H) of PET CT shows decreased FDG uptake on the middle and inferior frontal gyri (arrow) sparing other cortex (arrow head). Post treatment follow up FLAIR image of MRI (I) shows decreased area of high signal intensity (arrow) of the white matter compared with initial presentation after nine months.
FA map in a patient with neuropsychiatric SLE (A) shows decreased value of internal capsule (arrow) compared with the corpus callosum (arrowhead). ADC map (B) shows diffusion restriction in the lateral portion of the periventricular white matter (arrow) with relatively spared medial portion (arrowhead) at the level of corona radiata. DTI tractography (C) shows fibers defect (arrow) on T2 high signal intensity. The fibers passing the medial three-fourth portion of crus cerebri (D, arrowhead) are more sparse than fibers passing through the lateral portion of crus cerebri (E, arrow). Diffusion tensor tractography shows the corticobulbar tract (G, arrow) which passes through a high signal intensity lesion (signal intensity<1450) on b=0 image of DWI (F, mask imaging).
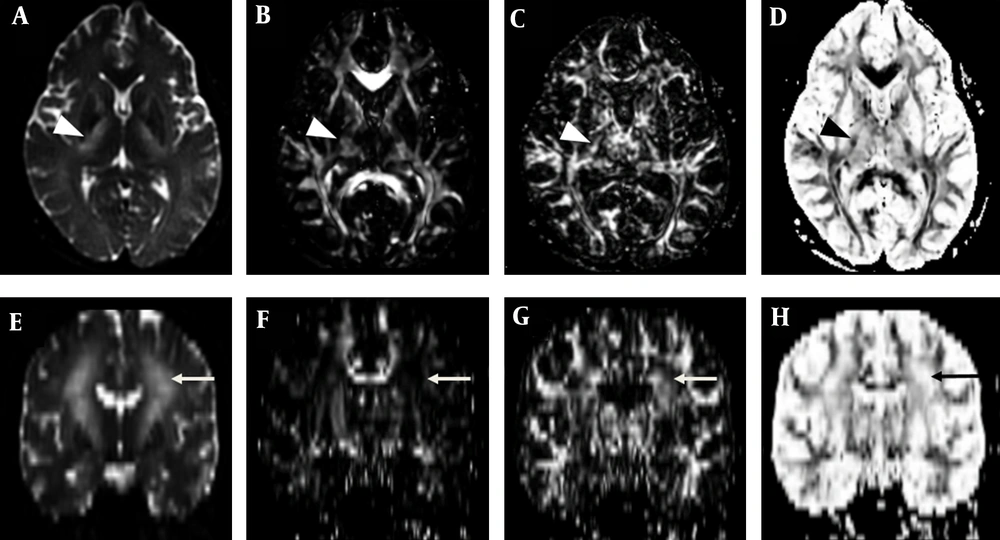
To obtain DTI parameters of tractography passing through CBT, the high signal intensity lesion on b0 image was segmented using threshold technique (signal intensity > 1450), with Image J program (1.47q, NIH, USA) (Figure 3A - C). To compare with tractographies passing the lesions regarded as CBT, tractography passing through the whole midbrain and lateral to the high signal intensity regarded as intact corticospinal tract were obtained at the level of crus cerebri using post-processing software MedINRIA (www-sop.inria.fr/asclepios/software/MedINRIA). We also obtained DTI parameters of combination linear (Cl), combination planar (Cp), and combination spherical (Cs) using ROI technique on the MedINRIA. The value of apparent diffusion coefficient (ADC; 1.67 versus 2.28), fractional anisotropy (FA; 0.29 versus 0.54), Cl (0.12 versus 0.26), Cp (0.14 versus 0.28), and relative anisotropy (RA; 0.18 versus 0.44) of CBT at the level of midbrain were lower than those of the corticospinal tract respectively, whereas Cs was increased (0.72 versus 0.45) (Appendix 2). The parametric anisotropy images could discriminate affected CBT, which was blended within the internal capsule on B0 image. The CBT showed low, high and high signal intensities on Cl, Cp and Cs map, respectively. Whereas, the corticospinal tracts showed high, high and low signal intensity respectively, which were similar to unaffected white matter tracts such as the corpus callosum (Figure 3).
Parametric anisotropy maps in a patient with neuropsychiatric systemic lupus erythematosus (SLE). A-D, Axial images of B0 diffusion tensor image, parametric intensity maps of combination linear (Cl), combination planar (Cp), and combination spherical (Cs) measures at the level of basal ganglia. E-H, Coronal images of B0 diffusion tensor image, Cl, Cp, and Cs. Affected lesion including corticobulbar tract (arrow) shows low, high and high signal intensity on Cl, Cp and Cs map, respectively; whereas, the corticospinal tracts (arrow head) show high, high, and low signal intensity, respectively, which was similar to unaffected white matter tracts.
Methylprednisolone pulse therapy was administered. The therapy was tapered and changed into oral methylprednisolone. After treatment, C3/C4 (77.8/10.3) increased to the normal range. Tacrolimus was added later in the maintenance phase with azathioprine. Most of the lesions except small white matter change were resolved on follow up MRI (Figure 1).
3. Discussion
MRI of the presented patient with NPSLE showed symmetric confluent hyperintensities in the bilateral cerebral white matter on T2-WI. The lesion extended from the precentral gyrus lateral to the hand knob through the corona radiata and the genu of the internal capsule. It finally extended into the medial side of the corticospinal tract at the level of crus cerebri of the midbrain, which is known as tonotopic localization of CBT (7). For conventional MRI, demyelinating disorders such as multiple sclerosis, or neuromyelitis optica could be included as the differential diagnosis. However, clinical features with serologic examination of the patient supported the diagnosis of NPSLE. In addition, the features of imaging modalities were reflective of the pathologic status of NPSLE.
MRS of the lesions with altered signal intensity on T2-WI showed decreased NAA. Previous MRS of NPSLE demonstrated decreased NAA/Cr and increased Cho/Cr in the lesion, which may represent inflammatory processes, demyelination or cell membrane degradation, as seen in most cases of white matter disease (8). Lactate peaks, an indicator of anaerobic metabolism, were not notable, which are observed in usual NPSLE (2). PET CT of this case showed decreased FDG uptake of the gray matter of the precentral gyrus lateral to the hand knob. According to PET CT study for NPSLE, the gray matter was more commonly involved than the white matter (9). Changes in the cognitive profile of NPSLE paralleled changes on PET (10), which supported the clinical features of memory impairment and mood change in the presented patient. The described findings of MRS and PET-CT corresponded with those of typical NPSLE. Slight diffusion restriction on ADC map and the decreased value of fraction anisotropy on FA map of DTI do not suggest acute ischemic change, but inflammation with loss of white matter integrity.
The presented patient showed bulbar symptoms, suggesting involvement of CBT. Pyramidal subsystems modulate the processing and integration of the ascending somatosensory information generated by the movement itself. CBT, as a component of the pyramidal system, selects the adequate motor synergies and modulates other descending systems to coordinate the activity of the distal musculature and the associated postural adjustment; whereas, the corticospinal tract is functionally related to motor activities requiring accuracy, and to motor neuronal recruitment to adjust the contractile force (7). Nuclei receiving from CBT are the trigeminal, facial, and hypoglossal, which make face and tongue move voluntarily (11). Unless certain diseases involve CBT, blended within projection fibers, it is impossible to visualize the tract on CT and conventional MRI due to its thin structure (12).
The CBT run together with the corticospinal tract, and are not discriminated on directional DTI color maps, but can be parsed by using specified tractographic algorithms (13, 14). Yim et al. (11) discriminated DTI tractography passing through the lesions related to bulbar symptoms due to ischemic stroke. In this case, we applied the seed of DTI as high signal intensity lesion on T2-WI in order to trace the CBT. Fibers on tractographies passing through the CBT showed relatively sparser than those passing the lateral portion of crus cerebri, regarded as tonotopic localization of the corticospinal tract. Interestingly, the signal of the lesion was decreased on Cl map; whereas, the signal on Cp map remained as high signal intensity. These discrepancies between the linear and planar shape components of the diffusion tensor do not reflect destruction of the neuronal tract, but they do reflect a considerable loss of neuronal integrity, which suggests demyelination of the white matter. In conclusion, we presented a rare case of involvement of CBT in a patient with NPSLE. The findings of T2-W1 and DTI showed precise anatomical location of the neuronal damage of CBT. In addition, MRS, PET-CT and parameters of DTI supported the explanations of the inflammatory process and metabolic change of the white matter caused by NPSLE.


