

1. Background
Diffuse thyroid diseases include hyperthyroidism, chronic autoimmune hyperthyroidism [Hashimoto’s thyroiditis (HT)], subacute thyroiditis (SAT), and Graves’ disease (GD). Although they share similar clinical, biochemical, and sonographic properties, they have different etiopathogeneses and require different treatments. Therefore, a correct diagnosis of these types of thyroiditis by ultrasonography is critical. Ultrasound assessment has limited value in terms of the differential diagnosis of thyroiditis. In this regard, radiological imaging techniques may have to be developed to provide important information to clinicians for planning treatment algorithms.
Palpation has long been used for thyroid examination. Sonoelastography (SEL) has replaced palpation in thyroid examination, and it was first used by Ophir (1).
During USE, slight pressure is applied to the tissue or lesion. By doing so, elasticity of the tissue or lesion can be assessed easily by measuring the degree of deformation (1, 2).
Elastography is used in different clinical scenarios such as hepatic fibrosis staging (3), breast tumor differentiation (4), distinction of thyroid lesions (5), characterization of bowel wall lesions by discerning the active phase of inflammation from fibrotic stenosis (6), characterization of focal pancreatic lesions (7), discrimination of benign and malignant lymph nodes (8), assessment of fecal incontinence, nodal staging of esophageal cancer, and evaluation of musculoskeletal alterations.
The benefit of USE in thyroid disease has been described (9). Today, two important sonoelastographic methods are used in the evaluation of the thyroid gland; strain elastography (SE) and shear-wave elastography (SWE) (10). Both of the techniques evaluate the tissue elasticity by measuring the degree of deformation secondary to an external pressure. The main difference between these techniques is the constitutive factor of pressure. Strain elastography uses the pressure that is formed by an examiner. SWE uses acoustic pressure that is generated from the transducer with the shear waves. There are two main SE methods: a qualitative technique, real time elastography (RTE) and a semi- quantitative technique, strain ratio elastography. SWE is a quantitative method that does not relate with the ability of the examiner.
1.1. Graves’ Disease
GD is an autoimmune disorder characterized by thyrotoxicosis induced by the appearance of circulating thyroid-stimulating hormone receptor autoantibodies (TRAbs) with thyroid stimulating activity. Thyrotoxicosis can also be caused by different kinds of painless thyroiditis. To determine the exact cause of thyrotoxicosis, radioactive iodine uptake measurement remains the gold standard clinical application. However, nuclear medicine is inaccessible in many medical institutions, and radioactive iodine uptake is contraindicated for lactating and pregnant women.
The prevalence of GD is 5 - 10 times more common in females than in males, with a peak incidence in the third to sixth decades. GD usually presents with tremor, heat intolerance, nervousness, weight loss, goiter, fatigue, tachycardia, and exophthalmos. Measurement of TRAb levels in the blood is beneficial for differentiating GD from HT, and SAT. However, TRAb assays are unavailable in general hospitals and clinics.
Ultrasonography is a non-invasive and cost-effective imaging modality for rapid evaluation of the thyroid gland. GD on conventional ultrasound is characterized by the presence of diffuse thyroid enlargement with low echogenicity, accompanied with increased intrathyroidal flow on color Doppler examination (11). Thyroidal parenchymal hypervascularity is a typical finding in GD that is beneficial for differentiating GD from SAT and HT (12). In theory, the differential diagnosis of GD from SAT and HT by USE is possible because of the different histopathologic characteristics and kinds of thyroid gland vascularities for each condition.
In 2015, Yang and et al. demonstrated that RTE and strain ratio elastography may be useful in differentiating SAT from HT (13). However, the number of patients in their study was very small and they did not include patients with GD. To date, no study has compared the strain ratios (SRs) among patients with GD and other types of thyroiditis.
1.2. Subacute Thyroiditis
SAT is an unusual, self-limiting condition that generally develops after an upper tract infection caused by a viral infection, which in turn induces an autoimmune response (14). Clinically, this condition is associated with severe anterior neck pain and may radiate up to the mandible, ear, and occipital fossa. At the beginning of the disease, SAT presents with usually low-grade fever with thyrotoxicosis (15). Laboratory findings of SAT are suppression of thyrotropin (TSH) levels, elevated thyroid hormones (FT4 and FT3), and elevated C-reactive protein (16).
In general, B-mode and Doppler sonographic findings of SAT are thyroidal enlargement and ill-defined focal hypoechoic areas with hypovascularity (15). After treatment, these findings usually disappear (15). The usefulness of USE for determining SAT was first described by Ruchala et al. in 2011. In the early phase of SAT, tissues affected by inflammation lose elasticity and significantly show sonoelastographic abnormality. After treatment, thyroidal tissue stiffness usually becomes normal (17).
1.3. Chronic Autoimmune Thyroiditis
HT is the most common inflammatory disorder of the thyroid gland, and it causes hypothyroidism. It is reported in women as much as 15 times than in men, with a peak incidence between the third and fifth decades (18). The prevalence of HT is approximately 5% - 15% in women. HT is commonly associated with the presence of circulating anti-thyroid autoantibodies, which are responsible for morphological damage and thyroid function impairment. Thyroglobulin antibody (TgAb) and/or thyroid peroxidase (TPOAb) antibody positiveness is used for the diagnosis of HT. Ultrasonography demonstrates decreased echogenicity, heterogeneity, hypovascularity, and the presence of hypoechoic micronodules in patients with HT (19).
The degree of thyroidal fibrosis is correlated with increased stiffness in HT. The applicability of USE for the evaluation of thyroidal stiffness was first described by Sporea et al. in 2011 (20).
In 2014, Menzincioglu et al. showed that SR is higher in HT than in normal thyroid parenchyma via RTE (21). However, their study group was relatively small (only 31 patients with HT) and had limited value.
2. Objectives
Numerous studies have evaluated the stiffness of thyroid nodules, but few reports have examined the value of elastography in thyroid disease other than nodules. Given that data regarding the utility of USE in acute, SAT, and chronic thyroiditis by shear-wave elastography (SWE) (11) and strain elastography (SE) are limited, we aimed to investigate the applicability of USE in different types of thyroiditis.
3. Patients and Methods
3.1. Study Population
Most of our patients were sampled from the patient population treated in the department of endocrinology at our hospital between October 2015 and March 2016. Patients with a suspected diagnosis of thyroiditis were identified. Other patients were sampled from the patient population of the otorhinolaryngology department who applied to this department because of throat ache and suspected thyroiditis by physical examination and laboratory tests.
Patients with malignancy, antithyroidal treatment, chronic thyroidal illnesses, who were under 18 years and older than 90 years, or without available images (B-mode ultrasonography, color Doppler sonography, spectral analysis, and elastography) were excluded. Our study was a prospective original research study. Patients who were diagnosed with thyroiditis were also excluded.
The study was approved by the local Institutional Review Board, and all participants provided written informed consent. This prospective, single institution study was conducted in compliance with the Helsinki Declaration and good clinical practice guidelines of the ministry of health of Turkey. The study was approved by the local ethics committee of Kanuni Research and Education Hospital, Trabzon, Turkey.
An Aplio 500 ultrasound machine (Toshiba Medical Systems, Co., Ltd., Otawara, Japan) with linear 4.8 - 11 MHz transducers and elastography software was used. All the examinations were performed by one of two radiologists with experience of more than ten years on thyroidal imaging. The observers were blinded to early clinical suspected differential diagnosis of the patients, clinical findings, laboratory results, and final diagnosis. The observers were also blinded to whether the patient was in the healthy control group or thyroiditis group.
Elastographic images were recorded to be reviewed subsequently by the other observer to check our interobserver variability. The agreement on the elastographic scores was more than 90% between the two radiologists. Additionally, scoring by the two observers was identical in four individuals with thyroiditis. For these four patients, the final score was agreed upon by consensus after reexamination of these patients.
The examinations were performed according to the EFSUMB Guidelines and recommendations on the clinical use of ultrasound elastography Part 1 and Part 2 (9, 22).
A total of 229 individuals who were examined in our radiology department from October 2015 to March 2016 were screened. Finally, 24 cases were diagnosed as GD (9 men, 15 women; 40 ± 13 years), 94 cases were diagnosed as HT (8 men, 86 women; 41 ± 13 years), and 20 cases were diagnosed as SAT (8 men, 12 women; 47 ± 9 years). All cases were confirmed by clinical examination and laboratory findings. The control group (CG) consisted of 82 healthy volunteers (13 men, 69 women; 43 ± 10 years) whose ultrasound imaging and thyroidal laboratory results were normal (Table 1).
| Group | CG | HT | SAT | GD | P Value |
|---|---|---|---|---|---|
| Total Number of cases | 82 (37.3) | 94 (42.7) | 20 (9.1) | 24 (10.9) | |
| Female | 69 (37.9) | 86 (47.3) | 12 (6.6) | 15 (8.2) | ns |
| Male | 13 (34.2) | 8 (21.1) | 8 (21.1) | 9 (23.7) | ns |
| Age | 42.7 ± 10.3 | 40.9 ± 13.0 | 47.2 ± 9.2 | 39.5 ± 13.6 | 0.041 |
Abbreviations: CG, control group; GD, Graves’ disease; HT, Hashimoto’s thyroiditis; ns, non-significant; SAT, subacute thyroiditis; SD,standard deviation .
aValues are expressed as No. (%) or mean ± SD.
3.2. Ultrasound Imaging
Ultrasound examination started with B-mode sonographic imaging. The patient was supine with a slightly extended position over a special pillow that was built for thyroidal imaging. Grayscale ultrasound evaluation of thyroid glands was performed with standard transverse and longitudinal planes before USE. Thyroid dimensions and parenchymal echogenicity were evaluated. The echogenicity of the thyroid glands was classified into four categories, namely, marked hypoechogenicity, hypoechogenicity, isoechogenicity, and hyperechogenicity.
Marked hypoechogenicity was defined as low echogenicity compared with neighboring infrahyoid muscles. Blood flow of both thyroid lobes was observed by power Doppler ultrasound.
3.3. Elastography Imaging and Image Analysis
During grayscale ultrasound, thyroid gland lesions suspected for thyroiditis were identified and a region of interest (ROI) for elastography was identified. Once the elastography mode was selected, the scale of colors was superimposed over the grayscale image. The grayscale image was presented on the right side and the sonoelastogram was presented on the left side of the screen (Figure 1).

Elastogram of a healthy control group patient. The grayscale image is presented on the right side and the sonoelastogram is presented on the left side of the screen.
Light compression was applied to the thyroid region on the sagittal plane to the gland with linear 4.8 - 11 MHz transducers to limit the lateral movement of the lesion. Soft compressions were repeated several times with a similar pressure affected to the same area. Simultaneously, elastographic images were displayed over the B-mode image on the monitor. Multiple elastograms were evaluated, and tehnically best B-mode sonographic image’s elastogram (i.e exclude common carotid artery in the examination area, included as much of the thyroid tissue affected with thyroiditis and sternocleidomastoid muscle etc.) was used to identify the elasticity score (ES). Since pulsation of common catorid arteries may have a negative effect on elastography values, we excluded carotid artery from the examination area. Also, SCM was regarded as a reference marker, therefore, we included as much area of SCM in order to increase the accurancy of the examination.
Elastographic images depicted in blue, red, and green were related to hard, soft, and moderately hard regions of thyroidal tissue, respectively. Elastographic color scale, which was related to the degree of strain, was as follows: red (soft tissue), green (intermediate degree of stiffness), and blue (inelastic tissue). To classify the elastographic color pattern of the different kinds of thyroiditis, we used a four-point modified Ueno scale (23). ES I indicated normal thyroidal stiffness (predominantly green color with a red and yellow mosaic pattern). ES II denoted parenchyma of predominantly normal elasticity but containing areas of slightly increased stiffness (predominantly green color with a little tiny area of blue mosaic appearance). ES III suggested parenchyma of intermediate elasticity (predominantly blue color with some tiny areas of a green and blue mosaic pattern). ES IV revealed that most of the thyroid parenchyma presented highly increased stiffness, with blue color (Figure 2).
. Two region of interests (ROIs) for comparison were delineated to calculate the SR. The pink and big circle (target) in A is the local ROI on the thyroid tissue. The white and small circle (reference) in B is the local ROI on the sternocleidomastoid in front of the ipsilateral thyroid. SR-B/A. SR: strain ratio; ROI: region of interest. A, elastography score (ES) I; B, ES II; C, ES III; D, ES IV.")
Modified Ueno classification and method for measuring strain ratio (SR). Two region of interests (ROIs) for comparison were delineated to calculate the SR. The pink and big circle (target) in A is the local ROI on the thyroid tissue. The white and small circle (reference) in B is the local ROI on the sternocleidomastoid in front of the ipsilateral thyroid. SR-B/A. SR: strain ratio; ROI: region of interest. A, elastography score (ES) I; B, ES II; C, ES III; D, ES IV.
In addition to elastographic color-coded grading, the strain of tissues can be evaluated using numerical strain values and cross checked with a correlation of radiofrequency signals (24). Semiquantitative information is depicted as SR with a numerical value (9, 22). The SR increases when the parenchyma is affected with thyroiditis (21).
We selected two ROIs for comparing the affected thyroiditis area with the ipsilateral sternocleidomastoid muscle (SCM) for depicting control stiffness. Both ROIs included as much of the thyroid tissue affected with thyroiditis and SCM (Figures 1 and 3). We also ensured that both ROIs were placed at the same vertical axis to the transducer and in the central region of the image (25). Before calculating the SR, we checked that the B-mode image did not contain any carotid artery and jugular vein. If necessary, patients were asked to hold their breath to prevent elastographic artifacts. We obtained three elastographic images and strain measurements for the thyroid gland. After the examination, we chose the technically perfect one from the collected data for evaluation of stiffness. This selected elastogram was considered valid.
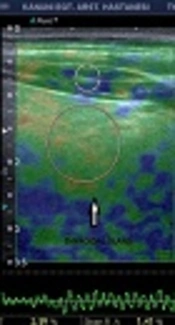
. Even the B-mode image has no specifity for subacute thyroiditis. The elastogram has a diagnostic value according to our study results. SCM; sternocleidomastoideus muscle.")
The grayscale image is presented on the right side and the elastogram is presented on the left side of the screen. Finally, this patient was diagnosed as subacute thyroiditis by the department of endocrinology. The elastogram depicts increased stiffness of thyroidal tissue (ES IV). Even the B-mode image has no specifity for subacute thyroiditis. The elastogram has a diagnostic value according to our study results. SCM; sternocleidomastoideus muscle.
3.4. Statistical Analysis
Continuous variables were expressed as the mean ± standard deviation (SD) and categorical variables were expressed in percentages. The analysis of normality of the continuous variables was performed with the Kolmogorov-Smirnov test. The categorical variables between the groups were compared using the chi-square test. The numerical variables between independent groups were compared. If the normal distribution requirement was provided, ANOVA analysis was used. If the normal distribution requirement was not provided, Kruskal-Wallis variance analysis was used.
The Mann-Whitney U test was performed to determine whether the distribution of ESs was different between SAT and GD or HT. The Mann-Whitney U test was also used to compare the SR of the groups.
The ROC curve was used to determine the cut-off point of the SR of normal and experimental subjects. P values smaller than 0.05 were considered statistically significant. In the presence of significant threshold, sensitivity and specificity values were calculated. To evaluate the area under the AUC, the diagnostic value of the test was accepted as statistically significant when type 1 error was less than 5%. Statistical analysis was conducted using IBM SPSS Statistics for Windows (Ver. 22, IBM Corp., Armonk, NY, 2013) statistical software (26).
4. Results
The clinical and demographic characteristics of patients are shown in Table 1 and the flow of participants is shown in Figure 4.

Flow diagram for enrollment. CG, control group; HT, Hashimato tiroiditis; SAT, subacute thyroiditis; GD, Graves disease.
4.1. B Mode Ultrasonography
Compared with the CG, patients with SAT, HT, and GD had statistically different grayscale findings (P < 0.001). However, SAT, HT, and GD demonstrated similar findings on grayscale, which were not statistically significant.
4.2. Strain Elastography
4.2.1. Strain Ratios
The strain ratios (SR) (mean ± SD) of patients with GD, HT, and SAT and the CG were 14.7 ± 14.8, 8.4 ± 9.6, 23.2 ± 10.8, and 1.37 ± 0.8, respectively (Table 2 and Figure 5A).
| Group | Number of Cases (%) | Mean ± SD | Range |
|---|---|---|---|
| CG | 82 (37.3) | 1.37 ± 0.8 | 0.16 - 3.26 |
| HT | 94 (42.7) | 8.4 ± 9.6 | 7.82 - 49.52 |
| SAT | 20 (9.1) | 23.2 ± 10.8 | 0.54 - 47.50 |
| GD | 24 (10.9) | 14.7 ± 14.8 | 2.33 - 51.95 |
| Total | 220 (100.0) |
Abbreviations: CG, control group; GD, Graves’ disease; HT, Hashimoto’s thyroiditis; SAT, subacute thyroiditis.
; B, Receiver operating characteristic (ROC) curve of strain ratios for differential diagnosis of the group of HT+GD and the group of SAT. Diagonal segment is produced by ties; C, ROC curve of elastography scores for differential diagnosis of the group of HT+GD and the group of SAT; D, ROC curve of strain ratios for differential diagnosis of GD and CG.")
A, Boxplot of strain ratios in different groups (CG, control group; GD, Graves’ disease; HT, Hashimoto’s thyroiditis; SAT, subacute thyroiditis); B, Receiver operating characteristic (ROC) curve of strain ratios for differential diagnosis of the group of HT+GD and the group of SAT. Diagonal segment is produced by ties; C, ROC curve of elastography scores for differential diagnosis of the group of HT+GD and the group of SAT; D, ROC curve of strain ratios for differential diagnosis of GD and CG.
The cut-off points of strain elastography of patients with GD, HT, and SAT to the CG were 2.69 (sensitivity 92%, specificity 90%, AUC 0.983; %95 CI), 2.18 (sensitivity 100%, specificity 85%, AUC 0.898), and 5.54 (sensitivity 100%, specificity 100%, AUC 1.000; %95 CI), respectively. SR values presented the following ascending order: CG < HT < GD < SAT.
To determine a cut-off point to differentiate SAT from the other kinds of thyroiditis such as HT and GD, we created two groups. The first group included both HT and GD subjects. Whereas, the second group comprised SAT subjects. According to ROC curve analysis (Figures 5B and 5C) the cut-off point of the strain ratios of the total amount of patients with HT and GD to SAT was 14.79 (sensitivity 80%, specificity 85%, AUC 0.869; %95 CI).
4.3. Elasticity Scores
The elasticity scores (ESs) of patients with GD, HT, and SAT and the CG are shown in Table 3. Compared with the CG, strain ratios and elasticity scores were significantly higher in patients with SAT, HT, and GD (P < 0.001) (Figures 5D - 6E).
| Elastography Score | |||||
|---|---|---|---|---|---|
| Group | ES1 | ES2 | ES3 | ES4 | Total |
| CG | 35 (42.7) | 47 (57.3) | 0 (0) | 0 (0) | 82 (100) |
| HT | 0 (0) | 32 (34.0) | 54 (57.4) | 8 (8.5) | 94 (100) |
| SAT | 0 (0) | 1 (5.0) | 10 ( 50.0) | 9 (45.0) | 20 (100) |
| GD | 0 ( 0) | 3 (12.5) | 15 (62.5) | 6 (25.0) | 24 (100) |
| Total | 35 (15.9) | 83 (37.7) | 79 (35.9) | 23 (10.5) | 220 (100) |
avalue are expressed as No(%).(P < 0.0001)
Abbreviations: CG, control group; GD, Graves’ disease; HT, Hashimoto’s thyroiditis; SAT, subacute thyroiditis.
 curve of strain ratios for differential diagnosis of HT and CG; B, ROC curve of strain ratios for differential diagnosis of SAT and CG; C, ROC curve of elastography scores for differential diagnosis of GD and CG; D, ROC curve of elastography scores for differential diagnosis of HT and CG; E, ROC curve of elastography scores for differential diagnosis of SAT and CG; F, ROC curve of differential diagnostic performances of strain elastography (STE) and real-time elastography (RTE) for thyroiditis (CG, control group; GD, Graves’ disease; HT, Hashimoto’s thyroiditis; SAT, subacute thyroiditis).")
A, Receiver operating characteristic (ROC) curve of strain ratios for differential diagnosis of HT and CG; B, ROC curve of strain ratios for differential diagnosis of SAT and CG; C, ROC curve of elastography scores for differential diagnosis of GD and CG; D, ROC curve of elastography scores for differential diagnosis of HT and CG; E, ROC curve of elastography scores for differential diagnosis of SAT and CG; F, ROC curve of differential diagnostic performances of strain elastography (STE) and real-time elastography (RTE) for thyroiditis (CG, control group; GD, Graves’ disease; HT, Hashimoto’s thyroiditis; SAT, subacute thyroiditis).
SR values and elastographic scores of all groups were analyzed by statistical analysis. Statistically significant differences were noted in the SR values and ESs of the GD, HT, and SAT groups compared to the CG. No statistically significant differences were found in ESs of the SAT and HT groups compared to GD.
The diagnostic performance of strain ratio elastography (P < 0.0001) imaging was significantly higher than that of real-time elastography (P < 0.001) (Figure 6F).
5. Discussion
In the present study, we found increased elasticity scores and strain ratios in diffuse thyroid diseases compared with the healthy CG. In terms of differentiating diagnosis, ES could differentiate SAT from HT, but it had no value in differentiating GD from HT and SAT.
We also found statistically significant strain ratios for the differential diagnosis of SAT from GD and HT. Strain elastography could be a useful method for the differential diagnosis of SAT from a healthy population or from other types of thyroiditis such as GD and HT.
Sonoelastography may be considered an additional tool that supports other methods in the diagnosis and treatment monitoring of thyroid diseases, other than thyroid nodules.
Objective and noninvasive assessment of tissue stiffness may be performed by USE, which is a constantly evolving imaging technique. Several USE methods have been developed, including quasi-static elastography (QSE) or strain elastography and share-wave elastography (1, 2, 5, 10).
In QSE or strain elastography, the evaluation of elasticity is semi-quantitative or qualitative. Two of the main strain elastography techniques are real time elastography (qualitative) and strain elastography (semi- quantitative). In these methods, constant stress is applied to the tissue and shape deformation is measured. The accuracy and reproducibility of these examinations are usually dependent on the experience of the examiner. The other advantage of such techniques are their easy implementation (22). In QSE, classifications using four or five visual categorical scores have been recommended, either color coded or in grayscale (5). The other method, share-wave elastography, is proposed to provide quantitative and more objective information on elasticity in real time. Share-wave elastography uses acoustic pressure from the probe to standardize the compression. Given that the tissue compression force does not depend on the skills of the person performing the examination, it ensures high reproducibility and objective results. Compared with QSE, share-wave elastography can produce quantitative and highly precise results.
There are two useful methods of share-wave elastography application in terms of examination and diagnosis of the thyroid gland, namely, acoustic radiation force impulse elastography (ARFI) and supersonic shear-wave (SSW). ARFI uses short-duration acoustic pulses that stimulate tissues within the ROI, generating displacements in local tissue and inducing lateral shear waves. SSW can be used to establish a diagnosis in several issues, especially in breast lesions (27), thyroid nodules, and thyroiditis (28).
Cantisani et al. demonstrated the utility of sonoelastography in differentiating between malignant and benign thyroid lesions (5). Ruchała et al. recently applied USE in the evaluation of thyroiditis and autoimmune thyroid diseases (10, 11).
Yang et al. investigated the utility of sonoelastography in diffuse thyroid diseases (14). They demonstrated significant differences in thyroid hardness between different diffuse thyroid diseases. Although their study is novel and deserves appreciation, we believe that the population number in their study is relatively small. Moreover, they regarded all the patients with hyperthyroidism in one group. GD is an important form of hyperthyroidism with a distinguishing appearance on Doppler ultrasound. The differentiation of GD from SAT is difficult by B-mode sonography. In our study, we created a special group that included only GD and excluded other entities presented as hyperthyroidism.
Data regarding the utility of ultrasonographic eleastography in acute, SAT, and chronic thyroiditis by share wave elastography (11) and strain elastography (14) are limited. Only one study has evaluated the value of strain elastography for the differential diagnosis of SAT (29), and only one study has evaluated the value of strain elastography for differential diagnosis of HT (21).
In 2015, Yang et al. (14) reported no statistically significant difference between the CG and hyperthyroidism groups, but they regarded all the patients with hyperthyroidism in one group. In our study, we created a special group that included only GD and excluded other entities presented as hyperthyroidism. Our results demonstrated increased elasticity scores and strain ratios in the GD population compared with the healthy CG.
Our study had some limitations. First, the gender of enrolled patients to our study was not equal because of the nature of thyroiditis. The total amount of thyroiditis group consisted of 25 males and 113 females. Such numbers were also supported by the literature. Second, cytological findings for each of the thyroiditis groups and long-term follow-up elastography results after treatment were not included.
Further studies in the recovery phase of thyroiditis are required to enrich the findings of the present study.
Conclusions
B-mode sonographic imaging is applicable for differentiating patients with thyroiditis and healthy individuals, but its differentiating value for different kinds of thyroiditis, such as SAT, HT, and GD is very limited. Real time elastography is valuable for differentiating thyroiditis from healthy individuals, but it has limited value for differentiating SAT-GD and GD-HT. According to our study results, real time elastography can only be a useful method for differentiating SAT from HT.
Strain elastography is also a useful method for the differential diagnosis of SAT from a healthy population or from other types of thyroiditis, such as GD and HT.
Strain elastography would be useful to differentiate SAT from other causes of hyperthyroidism to avoid over treating SAT and to give a prognosis. While nuclear medicine studies can be helpful for differential diagnosis of SAT from healthy individuals or the other causes of hyperthyroidism, they involve radiation and are not always available. Laboratory tests are also useful for differential diagnosis of SAT from healthy individuals or the other causes of hyperthyroidism but again not always available.
Apart from the usage of elastography for differentiating SAT from other subtypes of thyroiditis, it should be reserved mostly for tumoral lesions.
