3.1. Materials
BL enzyme (Anaheal 500 containing 200 mg of BL) was purchased from Salamat Parmoon Amin Company, Iran. MCNTs, (3-(4,5-dimethylthiazol-2-yl)-2,5-diphenyltetrazolium bromide) (MTT), trypsin-EDTA, methanol, fetal bovine serum (FBS), 6305UV-VIS spectrophotometer from Jenway (UK), Dulbecco's Modified Eagle Medium (DMEM), penicillin, streptomycin, hydrochloric acid, and sodium hydroxide were acquired from Sigma-Aldrich (USA). The HT-29 cell line (colorectal adenocarcinoma) was bought from Pasteur Institute (Iran) and cultured in DMEM medium (containing 10% FBS) and 100 U mL-1 penicillin and 100 μg mL-1 streptomycin at 5% CO2 pressure at 37°C in a flask (25 cm3). The cells were then cultured in 24-well culture plates (1.5 × 10⁵ cells per milliliter). Cell counts were performed using a hemocytometer slide.
3.2. Adsorption of BL on MCNTs
In this step, 1 g of Anaheal 500 was added to 1L of methanol to prepare the stock solution, and it was sonicated for 1 hour. In order to draw a calibration curve for spectrophotometry, diluted solution and standard solutions at concentrations of 5 to 50 mg L-1 were prepared. The standard absorbance values for each sample were obtained using spectrophotometry. All adsorption experiments were carried out indoors, inside 25 mL Erlenmeyer flasks containing 10 mL of BL solution and adsorbent (MCNTs) in various concentrations, temperatures, and exposure times.
It should be noted that the range of variation of the measured parameters was determined using the optimal range chosen by other researchers (
13,
14).
After stabilization of the conditions, samples were placed in a mixer at 240 rpm for proper mixing of adsorbent and adsorbed material. After a specified time, the adsorbent was separated from the solution using a magnet and nanometer filter, and residual concentrations of the solution were measured via the spectrophotometer calibration chart at the maximum absorbance wavelength of the BL (280 nm).
The pH of the solutions was adjusted using 0.1 M hydrochloric acid and 0.1 M sodium hydroxide to about 7.2 - 7.4 (
7). Each test was repeated three times, and their averages were presented as the final results.
The amount of BL adsorbed on the adsorbent, and its removal efficiency were obtained using Equations 1 and 2.
In Equation 1, qe is the BL (mg) absorbed on the absorbent (g), Ce and C0 (mg L-1) are the equilibrium and initial concentrations of BL, respectively, M and V are the mass of adsorbent (g), and the volume of solution (L), respectively.
3.3. Contact Time Effect
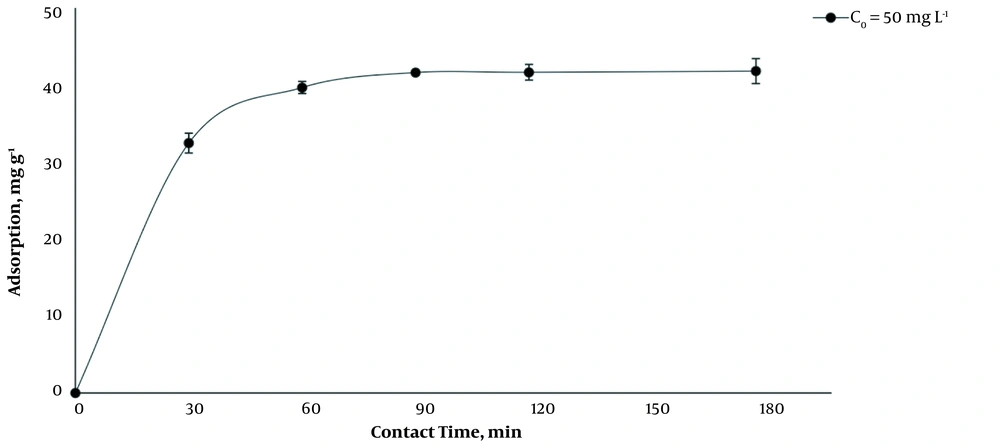
The contact time was studied during 180 min using optimum pH (7.2 - 7.4), 50 mg L-1 BL, and 1 g L-1 adsorbent (MCNTs) at room temperature, and then equilibrium time was determined.
In order to prepare the sample solutions, 1 mg of BL and 10 mg of MCNTs were poured into 10 mL of methanol and sonicated in an ultrasonic bath for 1 hour. Then, the pH of the samples was adjusted to 7.2 - 7.4. The absorbance of BL on MCNTs was measured after 30, 60, 90, 120, and 180 min. The percentage of BL absorbed at different contact times and the optimum contact time (the maximum adsorption of the drug by the MCNTs) was obtained by drawing the diagram. It should be noted that the kinetic equations of adsorption were obtained from the results of these experiments.
3.4. Different Concentrations of BL and MCNTs
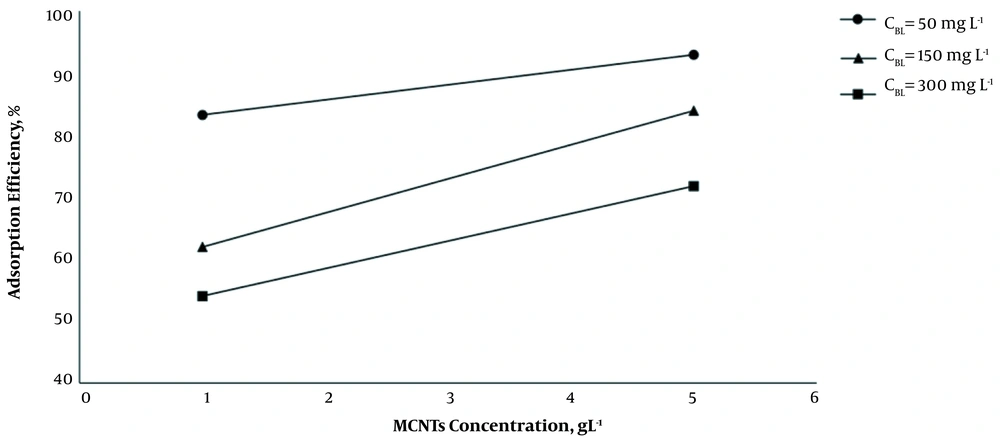
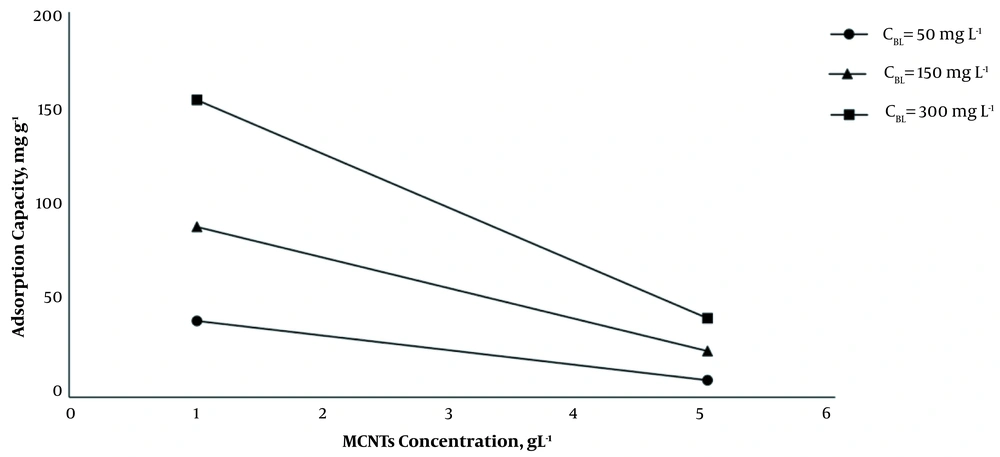
The effect of different concentrations of MCNTs (1 and 5 g L-1) and BL solution (50, 150, and 300 mg L-1) was studied at the optimum pH and contact time and at 35°C. Thus, three samples were prepared with 1 g L-1 MCNTs and 50, 150, and 300 mg L-1 of BL and three samples with 5 g L-1 MCNTs and 50, 150, and 300 mg L-1 of BL, respectively. Subsequently, the equilibrium isotherms of the adsorption were investigated, as previously explained.
3.5. Temperature Effect
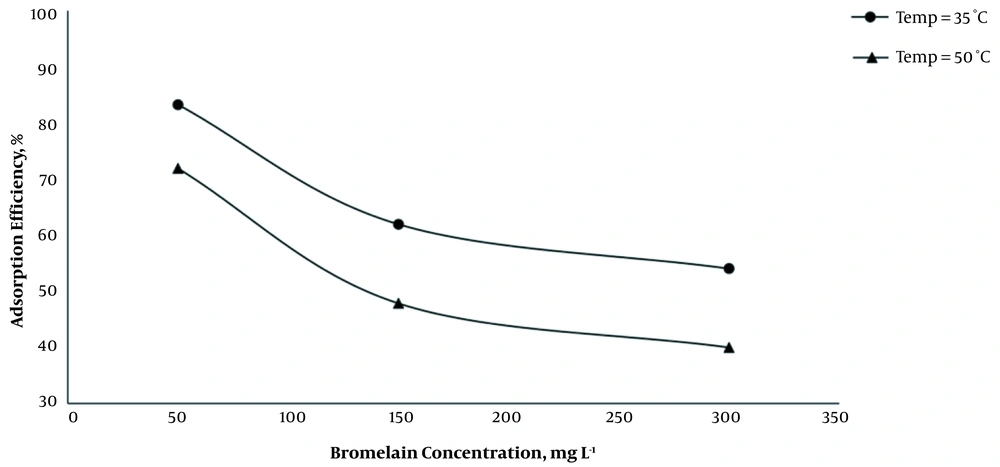
The adsorption process was carried out at two temperatures (35 and 50°C) to determine the optimum temperature as well as the thermodynamic study. At each temperature, three doses of BL (50, 150, and 300 mg L-1) aqueous solution under optimum conditions of pH, contact time, and adsorbent concentration of 1 g L-1 were used. Shaker-incubator was used to adjust the temperature and mixing speed. The BL-free adsorbent with a similar concentration was used as a control. Then, the effect of temperature on the adsorption of BL on MCNTs was determined, as explained previously.
3.6. Adsorption Equilibriums
When the solid surface is in front of the adsorbent, the adsorbed molecules hit the solid surface where some molecules are attached or adsorbed to the solid surface, and the rest of the molecules return. The adsorption rate is initially high due to the vacancy of the adsorbent surface, but gradually, the adsorption rate decreases as the adsorbent surface is coated. At this time, the rate of desorption (the rate of separation of the adsorbed molecules from the adsorbent surface) increases. At the equilibrium moment, the rate of absorption equals the rate of desorption, resulting in no change in the concentration of adsorbed material on the adsorbent surface, which is a dynamic balance. In other words, the number of molecules that adhere to the surface is equal to the number of molecules that are separated from the surface.
3.7. Adsorption Isotherms
The equilibrium amounts of the adsorbed material usually increase with increasing its concentration in the solution. The relationship between the amounts of matter adsorbed per unit mass of adsorbent (qe) in terms of equilibrium concentration absorbed in the solution (Ce) at a specific temperature is called adsorption isotherms. The most famous models used to analyze equilibrium adsorption data are Langmuir isotherm and Freundlich isotherm.
In the present study, Langmuir and Freundlich isotherm models were used to study and analyze the experimental data and to describe the equilibrium state in the adsorption between the solid and liquid phases. The Langmuir isotherm model represents a single layer and uniform adsorption of adsorbed material with the same energy on all the adsorbent surfaces. It also states that all adsorption sites have the same affinity for the adsorbent molecules, and there is no transition process of adsorbed materials on the adsorbent surface. On the other hand, in the Freundlich isotherm equation, the adsorption is considered multi-layered, non-uniform, and heterogeneous. The linear equations of the Langmuir and Freundlich equilibrium isotherms are shown in Equations 3 and 4, respectively.
In Equation 3, Ce is the equilibrium concentration of BL, qe is the amount of BL absorbed at equilibrium, qmax is the maximum adsorption capacity, and KL (L mg-1) is the Langmuir adsorption constant. KF and n are Freundlich constants dependent on the adsorption capacity and intensity, with n values less than 1 indicating weak adsorption and values between 1 to 2 and 2 to 10 indicating moderate and favorable adsorption, respectively. Parameters of n and KL are set using the slope and y-intercept of ln qe linear graph against ln Ce, respectively.
The desirability of the adsorption process in the Langmuir model can be determined using the RL dimensionless factor shown in Equation 5.
R
L values greater than 1 indicate undesirable adsorption, equal to 1, specify linear adsorption, equal to 0 shows irreversible adsorption, and values between 0 and 1 are desirable adsorption (
15).
3.8. Kinetic Models of Adsorption Systems
Two kinetic equations (pseudo-first-order and pseudo-second-order) were considered to find the best-fitted model for the experimental data.
The pseudo-first-order kinetic equation is based on the capacity of the adsorbent and is applicable when surface adsorption occurs from within a boundary layer via a diffusion mechanism (
16). The pseudo-second-order kinetic equation shows that chemical adsorption is the dominant and controlling mechanism in the process of surface adsorption, which is based on solid-phase adsorption. It also indicates that chemical adsorption is the deceleration process of surface adsorption (
17).
In Equation 6, qe and qt (mg g-1) are the absorption capacities at equilibrium time and a given time t (min), respectively, and k1 (min-1) is the pseudo-first-order rate constant. The values of qe and k1 were obtained from the intercept and slope of the ln (qe-qt) linear graph versus t, respectively.
In Equation 7, k2 (g (mg min)-1) is the pseudo-second-order rate constant. qe and k2 values were calculated from the intercept and the slope of the t/qt linear graph against t, respectively.
3.9. In Vitro Cytotoxicity
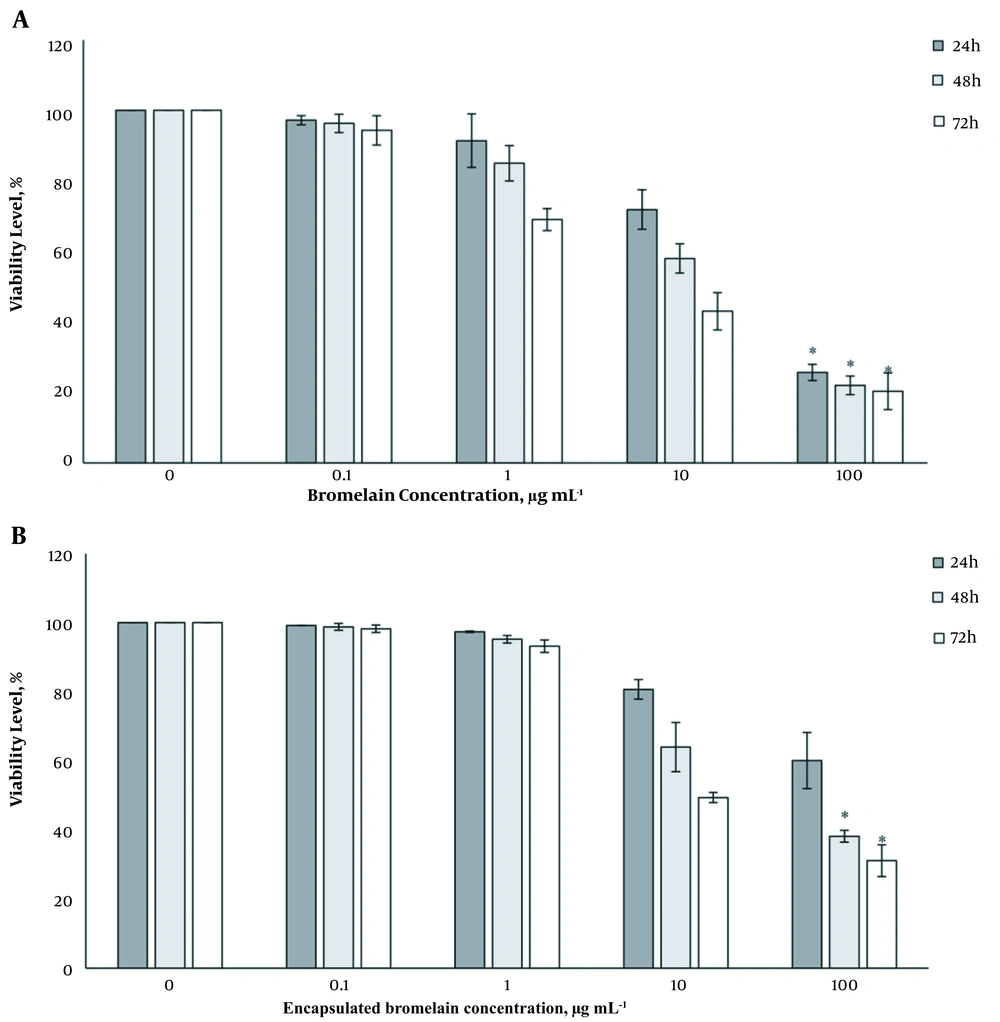
The potential cytotoxicity of BL and encapsulated BL enzyme in MCNTs on HT-29 cells was evaluated by methylthiazole tetrazolium (MTT) assay using various concentrations of BL (0.1, 1, 10, and 100 μg mL-1). In this method, 100 μL of culture medium containing 10000 HT-29 cells were added to 96-well plate and incubated for 24 - 72 hours. On the second day, 100 μL of pure BL solution and MCNTs containing BL with different concentrations were added to the plates and incubated for another 24 hours. Medium, untreated cultured cells and BL standard were served as the respective control. Then, 20 μL of MTT solution was added to all plates and incubated in the dark for 4 hours. Medium-containing MTT was withdrawn, and formazan crystals were dissolved in 150 μL of acidic isopropanol and incubated for 15 minutes at room temperature. Finally, the optical density (OD) of the solution was measured at 570 nm. The viability was determined as the ratio between viable treated cells against untreated control cells.
3.10. Statistical Analysis
Statistical analysis was carried out by SPSS software version 26. All the experiments were done in triplicate. Data were analyzed using one-way ANOVA, followed by the Tukey-Kramer post hoc test. The significant level was considered P < 0.05.