1. Background
One of the causes of liver injury is the toxic effect or side effects of alcohol (1). Alcohol consumption is estimated to cause 3.3 million deaths each year and is responsible for 6% of the causes of death globally (2).
Some bioactive compounds from herbs such as silymarin are thought to protect the liver in various ways, such as stimulating the synthesis of endogenous antioxidants and act as an anti-inflammatory agent (3). In Indonesia, silymarin is imported and relatively expensive. Therefore, the use of Indonesian herbs that are effective as hepatoprotective needs to be further improved for the supply of hepatoprotective drugs that are safe, efficacious, and inexpensive.
One of the herbs that can act as a hepatoprotective agent is temu giring or Curcuma heyneana. This plant grows easily in Indonesia. Research has shown that the C. heyneana extract was able to inhibit the increase of alanine transaminase (ALT) and aspartate transaminase (AST) induced by paracetamol as well as rifampin and isoniazid (4, 5). However, the hepatoprotective activity of this extract toward ethanol induction has never been studied.
2. Objectives
This research aimed to investigate the hepatoprotective activity of C. heyneana toward the rats induced by ethanol.
3. Methods
3.1. Plant
The rhizome was taken from PT. Sumatera Busan, Medan, Indonesia, harvested in July 2018. Plant authentication was conducted in Herbarium Medanense, Department of Biology, Universitas Sumatera Utara. The result was Curcuma heyneana (Valeton & Zijp.) (number: 3911/MEDA/2019).
3.2. Chemicals
The chemicals used were curcuminoid (Sigma-Aldrich, Missouri, USA), gallic acid (Sigma-Aldrich, Missouri, USA), quercetin (Sigma-Aldrich, Missouri, USA), Follin-Ciocalteu’s phenol reagent (Sigma-Aldrich, Missouri, USA), and ethanol (Merck, Germany).
3.3. Instruments
The instruments used in this experiment were GCMS-QP2010 SE (Shimadzu, Japan), UV-1800 UV-Vis spectrophotometer (Shimadzu, Japan), Thermo Scientific™ Shandon™ Finesse™ 325 manual microtome (England), tissue embedding system (Amos AEC 380, Australia), and Leica TP1020 tissue processor (United States).
3.4. Animals
The animal model used in this research was three-months-old Wistar rats bred in the Animal House of the Faculty of Pharmacy, Universitas Sumatera Utara. The protocol of animal handling was approved by the Ethics Committee of the Faculty of Mathematics and Natural Sciences, Universitas Sumatera Utara (Number: 0314/KEPH-FMIPA/2019).
3.5. Extraction
The rhizomes of C. heyneana were extracted using the maceration method. Every one gram of dry rhizome was soaked with 10 mL of ethanol in a macerator. In the first six hours, it was stirred occasionally and then let stand for 18 hours. The macerate was filtrated, and then the maceration was repeated with at least half the volume of the initial maceration. After collecting all, the macerate was evaporated with a rotary evaporator until gaining a thick extract. The yield was 10.22% (6).
3.6. Determination of Curcuminoid Quantitatively
The amount of curcuminoid in the extract was tested using a spectrophotometer with a wavelength of 425 nm through the following procedure. The extract was weighed as much as 0.1063 g and extracted with two mL of chloroform, and then was mixed and sonicated for 60 minutes. After that, it was macerated for 24 hours, mixed, and centrifuged. The filtrate was moved into a 10 mL volumetric flask. One mL of chloroform was added into residue, extracted, and the filtrate was taken. This step was repeated 5 times. The filtrate was evaporated by using nitrogen gas over the water bath until dried. Furthermore, ethanol was added. Dilution was carried out 25 times. The absorbance was read at 425 nm using a spectrophotometer. The curcuminoid standard curve was carried out by weighing curcuminoid; subsequently, it was put into the volumetric flask, and ethanol was added. The dilution was made to get the standard curve. The standard: 1000 mg/kg (A). A was diluted 10 times to get a concentration of 100 mg/kg (B). The serial concentration was made from solution B. The curcuminoid content was calculated by using following equation: Total curcuminoid (%w/w) = [Concentration of curcuminoid (ppm) × Last addition volume (mL) × Dilution factor ]/Sample weight (g).
3.7. Determination of Chemical Substances Using Gas Chromatography-Mass Spectra
The chemical substances in the extract were analyzed using gas chromatography-mass spectra (GC-MS) through the following procedure. The specifications of gas chromatography: (1) oven temperature from 80 to 300°C; (2) carrier gas was helium (He); (3) injection mode was split; (4) flow control mode was pressure 42.3 kPa; (5) the total flow was 117.5 mL/min; (6) column flow was 0.74 mL/min; (7) linear velocity was 31.8 cm/sec; (8) purge flow was 3.0 mL/min; and (9) split ratio was 153.0. The ion source temperature of the detector was 250°C, with the interface temperature 300°C. The column used was Rtx-5MS (5% diphenyl, 95% dimethyl polysiloxane) with a thickness of 0.25 µm, a length of 30.0 m, and an inside diameter of 0.25 mm. Before injection, the extract was dissolved into ethanol with a dilution factor of 1.0000; then, it was put in a vial and was placed in the sample holder of GC. The sample was injected as much as 0.5 µL automatically using the autoinjector. Identification and quantification were identified by matching retention times and mass spectral data with the library of WILEY7.LIB without using calibration standards.
3.8. Determination of Total Phenol
Total phenolic content of C. heyneana was measured using this procedure: 10 µg/mL gallic acid was taken as much as 0.5 mL and was put in a test tube; then, 2.5 mL of 10% Follin-Ciocalteu’s reagent was added, and the solution was mixed for 1 minute. After that, it was let stand for 5 minutes, and 2 mL7.5% Na2CO3 solution was added and incubated at room temperature for 30 minutes. The test was repeated three times. Furthermore, the solution was measured using a visible spectrophotometer at a wavelength of 766 nm. Total phenolic content was expressed in units of mg gallic acid equivalent (GAE)/g sample extract (7). The calculation of total phenolic content can be seen in following equation: Total phenolic content = [Sample concentration (µg/mL) × Sample volume (L)]/[Sample weight (g) × Dilution factor].
3.9. Determination of Total Flavonoid Content
Total flavonoid content of C. heyneana was measured using this procedure: 25 mg of the extract was dissolved in 50 mL methanol; then, 2 mL of solution was pipetted and added with 10 mL methanol. Afterward, 2 mL of this solution was taken and added with 0.1 mL 10% aluminum chloride, 0.1 mL acetic sodium, as well as 2.8 mL distilled water. The solution was incubated at room temperature for 30 minutes. The absorbance was measured using a spectrophotometer with a wavelength of 434 nm. Flavonoid concentration in the extract was calculated using the regression equation from quercetin calibration. The result was expressed in units of mg quercetin equivalent (QE)/g sample extract. The calculation of total flavonoid content can be seen in following equation: Total flavonoid content = [Sample concentration (µg/mL) × Sample volume (L)]/[Sample weight (g) × Dilution factor].
3.10. Hepatoprotective Activity of Curcuma heyneana
Animals were divided into 6 groups, with 5 rats in each group. The experimental design can be seen in Table 1.
| Groups | Treatments |
|---|---|
| Group 1 (negative control) | The rats were administered 0.5% carboxymethyl cellulose (suspending agent of extract) orally once a day for 7 days. |
| Group 2 | The rats were administered extract dose of 50 mg/kg BW orally once a day for 7 days. |
| Group 3 | The rats were administered extract dose of 100 mg/kg BW orally once a day for 7 days. |
| Group 4 | The rats were administered extract dose of 150 mg/kg BW orally once a day for 7 days. |
| Group 5 (positive control) | The rats were administered catechin dose of 150 mg/kg BW orally once a day for 7 days. |
| Group 6 (normal control) | The rats were given food and water freely for 7 days. |
Experimental Design
One hour after administration of the extract/carboxymethyl cellulose/catechin on the 7th day, the rats were given an ethanol dose of 5 g/kg BW. After that, the rats fasted overnight. On the 8th day, the rats were sacrificed, and the blood was withdrawn from the heart. The blood was put in the tube and then was centrifuged with 1500 - 3000 rpm for 10 - 15 minutes. The serum was taken to analyze ALT and AST (8).
3.11. Determination of Macroscopic Liver
The rats were sacrificed, and then the liver was taken out, washed with 0.9% NaCl and weighed, and its color, surface texture, and size was observed. The relative organ weight was calculated using following equation:
3.12. Determination of Microscopic Liver
The liver was soaked in 10% buffered formalin in preparation for hematoxylin-eosin (HE) staining.
4. Results
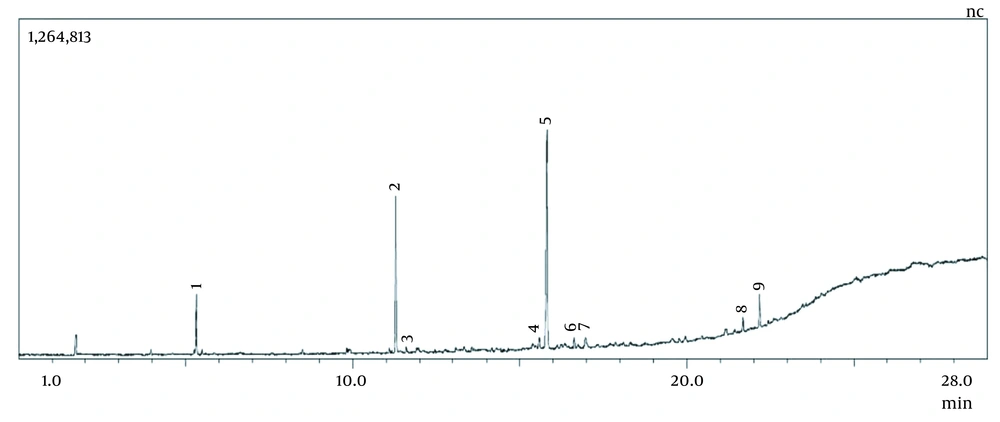
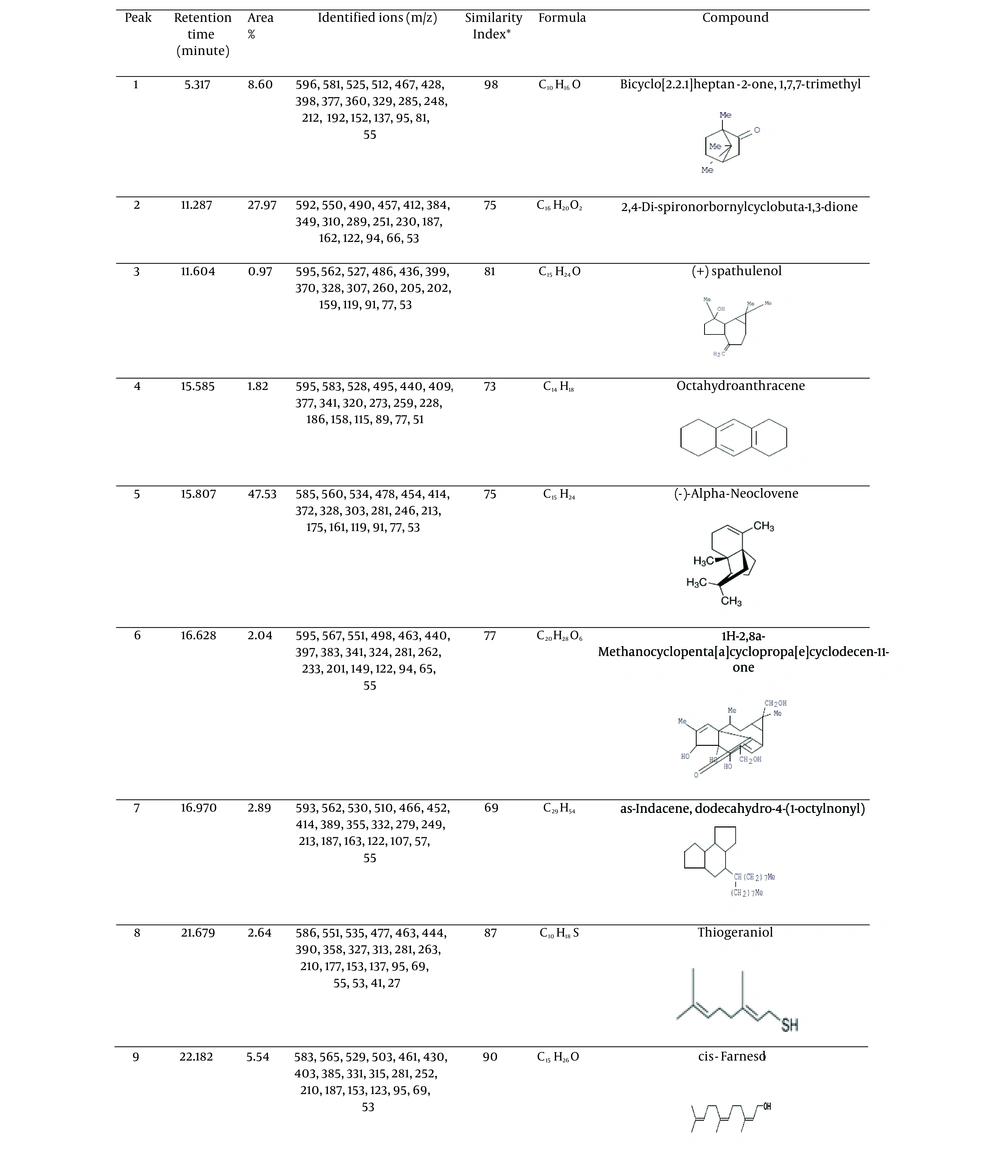
The curcuminoid content of the extract is 1.18% w/w. Chemical substances detected by GC-MS can be seen in Figures 1 and 2.
According to Figure 2, the chemical substances detected were 9 compounds.
4.1. Total Phenolic Content
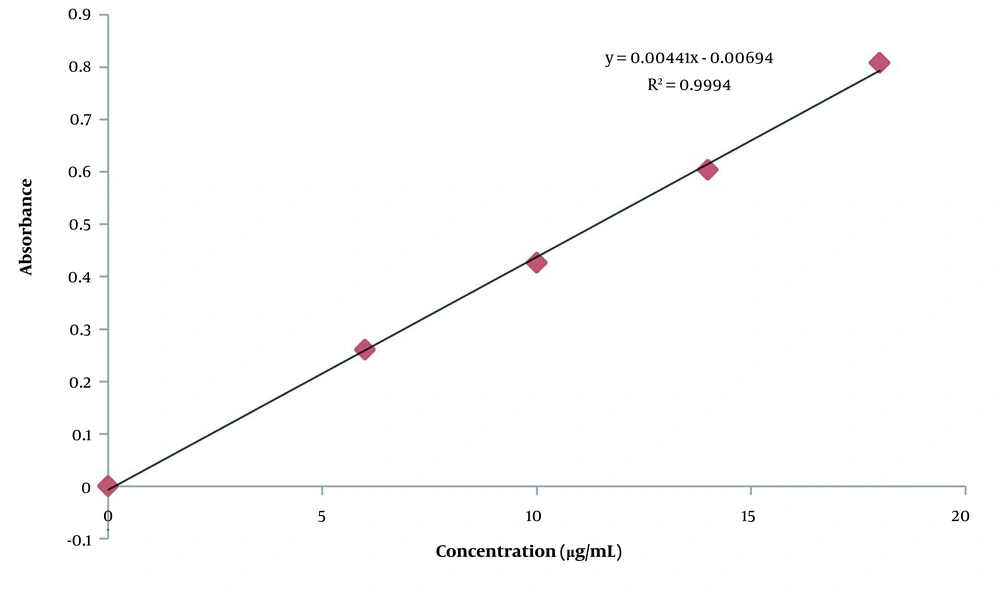
The regression of gallic acid is presented in Figure 3, and total phenolic content of the C. heyneana extract is shown in Table 2.
| Sample Number | Sample Weight (g) | Absorbance | Total Phenolic Content (mg GAE/g Sample) |
|---|---|---|---|
| Curcuma heyneana extract | |||
| 1 | 0.051 | 0.6611 | 401.61 |
| 2 | 0.053 | 0.6609 | 386.83 |
| 3 | 0.054 | 0.6622 | 412.63 |
| Average | 400.37 | ||
| Quercetin | |||
| 1 | 0.025 | 0.5156 | 630.6 |
| 2 | 0.025 | 0.7167 | 891.4 |
| 3 | 0.025 | 0.7306 | 909.5 |
| Average | 810.5 |
Total phenolic content of the Curcuma heyneana Extract and Quercetine
Based on Table 2, total phenolic content was quite high at 400.37 mg GAE/gram extract. This values a half compared to quercetin, which is a pure compound.
4.2. Total Flavonoid Content
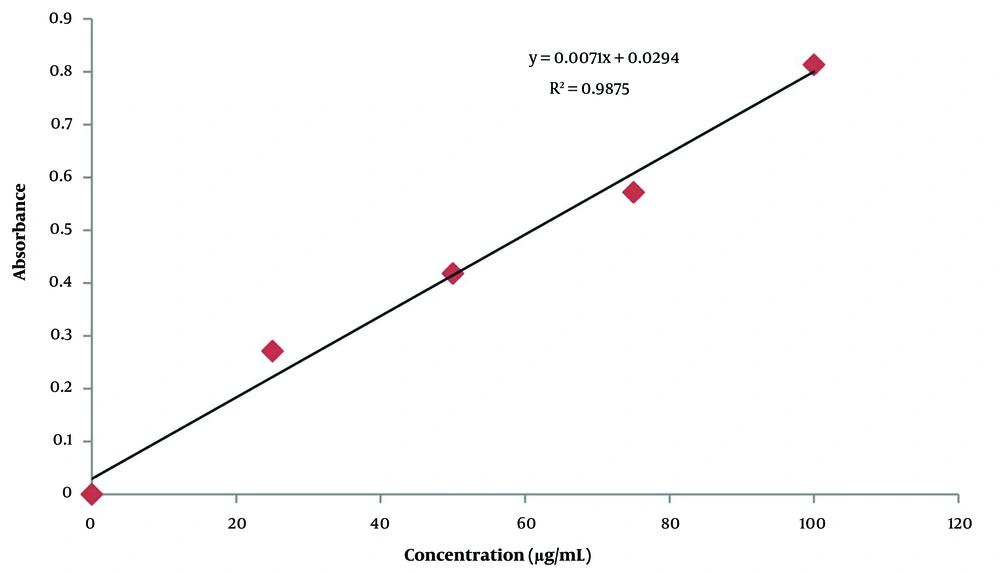
The regression of quercetin can be seen in Figure 4, and total flavonoid content of the C. heyneana extract can be seen in Table 3.
| Sample Number | Sample Weight (g) | Average of Absorbance | Total Flavonoid Content (mg QR/g Sample) |
|---|---|---|---|
| 1 | 0.02514 | 0.6036 | 27.34 |
| 2 | 0.02509 | 0.5787 | 26.26 |
| 3 | 0.02513 | 0.6214 | 28.15 |
| Average of total flavonoid content | 27.25 |
Total flavonoidcontent of Curcuma heyneana
4.3. Hepatoprotective Activity
4.3.1. The Relative Organ Weight
The result of relative organ weight can be seen in Table 4.
| Groups | Relative Organ Weight (%) ± SE | ALT Level (IU/L) ± SE | AST Level (IU/L) ± SE |
|---|---|---|---|
| Negative control | 3.65 ± 0.20 | 140.0 ± 12.33 a | 351.0 ± 48.22 a |
| Extract dose of 50 mg/kg | 3.60 ± 0.14 | 94.0 ± 7.10 b | 173.4 ± 7.78 b |
| Extract dose of 100 mg/kg | 3.58 ± 0.10 | 91.6 ± 10.09 b | 167.4 ± 8.38 b |
| Extract dose of 150 mg/kg | 3.40 ± 0.11 | 85.2 ± 5.83 b | 164.2 ± 11.96 b |
| Positive control (Catechin) | 3.36 ± 0.24 | 83.4 ± 2.87 b | 158.0 ± 11.83 b |
| Normal control | 3.29 ± 0.06 | 75.5 ± 4.05 | 149.4 ± 11.12 |
Parameters of Liver Injury
Based on Table 4, acute ethanol ingestion at the end of the experiment showed an increase in liver weight, even though this increase was not significantly different from the normal control. However, this fact indicated that there was inflammation in the liver that might cause the liver weight to increase. However, administration of the extract at doses of 50, 100 and, 150 mg/kg showed that the liver weight was lower than the negative control and close to the liver weight of the normal control. It means that without any hepatoprotective agent, the rat’s liver is more vulnerable to injury.
4.3.2. Macroscopic Findings of Liver
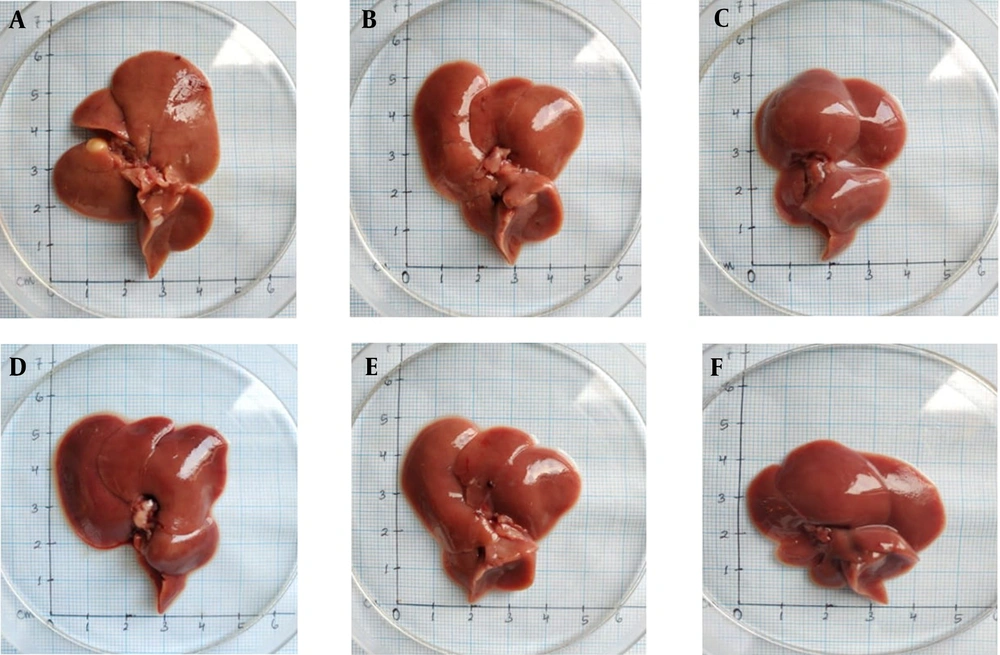
The results of macroscopic observations are shown in Figure 5.
According to Figure 5, the animals which did not receive any extract had pale red livers with white spots, suggesting an injury in the liver. Administration of the extract prevents the injury of the liver that can be seen from the liver color as dark red and without any white spots.
4.3.3. ALT and AST Levels
The results of ALT and AST levels can be seen in Table 4.
According to these results, administration of a high dose of ethanol at the end of treatment increases ALT and AST levels significantly compared to the normal control (P < 0.05). However, administration of the C. heyneana extract for 7 days significantly inhibited the elevation of ALT and AST levels compared to the negative control group (P < 0.05). The higher the dose of the C. heyneana extract, the greater the ability to inhibit the increase of ALT and AST.
4.3.4. Microscopic Findings of Liver
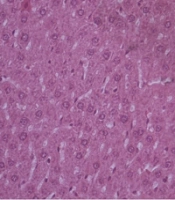
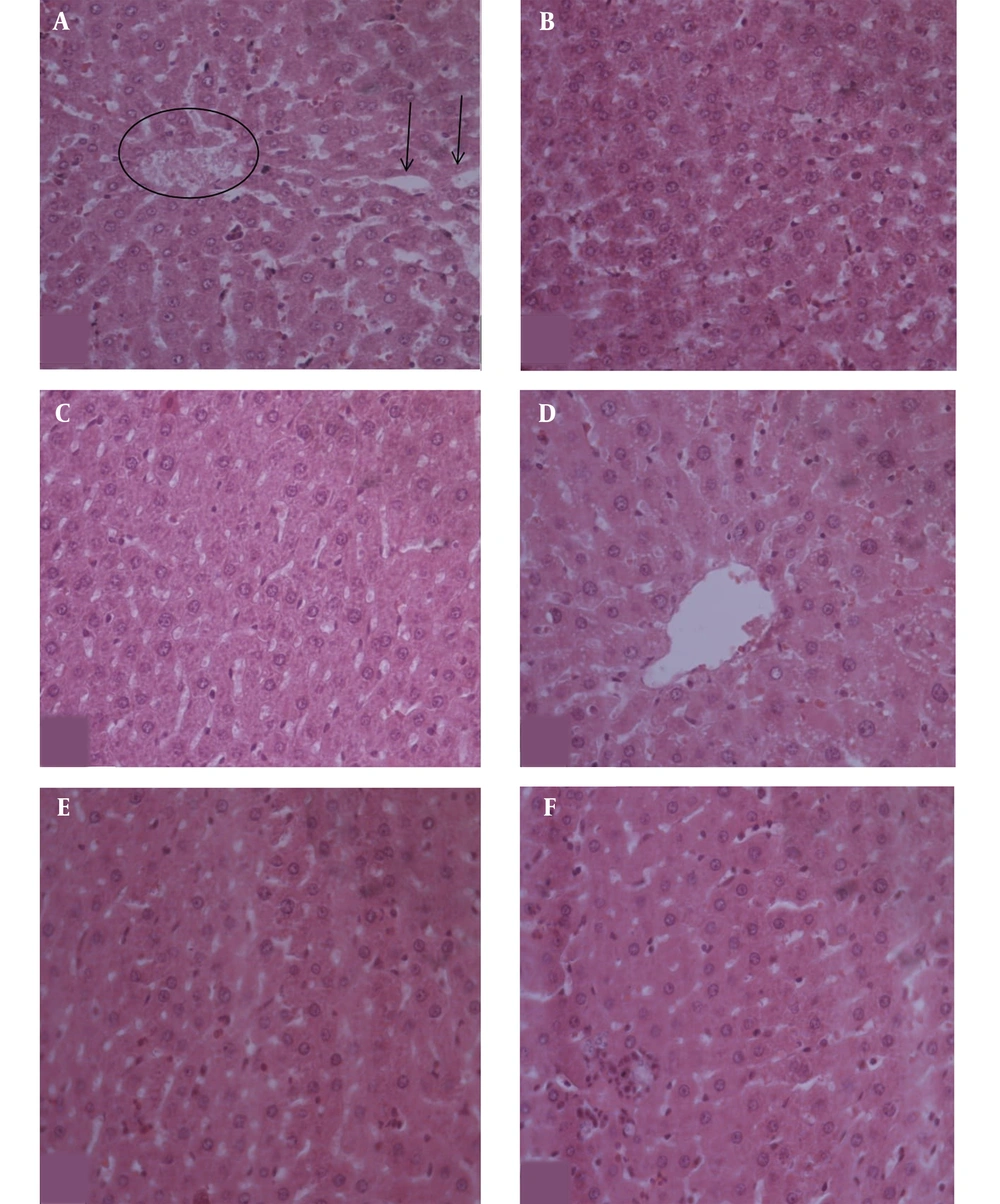
Microscopic findings of liver can be seen in Figure 6.
Based on Figure 6, the liver cells from all groups appeared the same as the normal control except for the negative control. In the negative control group, the liver cells appeared to be injured with dilatation at the sinusoid and the existing blood in the central vein.
5. Discussion
Ethanol is mainly metabolized in the liver by alcohol dehydrogenase (ADH), catalase, as well as cytochrome P4502E1, which catalyzes the oxidation of ethanol to acetaldehyde, and subsequently binds to the cellular macromolecules with the covalent bonds, forming toxic adducts and eventually, leading to cell death. Further, acetaldehyde is metabolized by aldehyde dehydrogenase (ALDH) to acetate, which is a less active metabolite, and then is broken down into water and carbon dioxide for easy elimination (9). In this research, the amount of ethanol ingested to the rats was excessive as much as 5 g/kg BW. This amount was intended to produce oxidative stress and peroxidation of liver lipids that can be seen from reactive oxygen species (ROS), hepatic malondialdehyde (MDA), and nitric oxide levels (not measured in this research) (10).
Based on this experiment, injury in the liver can be seen from macroscopic examination (pale color and white spot), the elevation of AST and ALT, and microscopic examination (sinusoid dilatation and the existing blood in the central vein). In this study, administration of C. heyneana at doses of 50, 100, and 150 mg/kg, 7 days before ingestion of a high dose of ethanol, revealed the protective effect to the liver that might be seen from inhibiting the elevation of AST and ALT, as well as the normal appearance of macroscopic and microscopic assessments of hepatocytes. The ability of C. heyneana to protect the liver from injury is suggested by its antioxidant activity.
Phenolic compounds are secondary metabolites found in plants, containing numerous compounds: (1) simple flavonoids, (2) phenolic acids, (3) complex flavonoids, and (4) colored anthocyanins (11). In this research, the determination of phenolic compounds was performed with total phenolic and flavonoid contents. Determination of the secondary metabolites is an important issue to justify the mechanism of the protective effect of C. heyneana on the liver. Since phenolic compounds, especially flavonoids, have been proved to be responsible for many mechanisms of cell protection, they may be applied to the prevention and treatment of human diseases (12). The prominent flavonoid present in the extract is curcuminoid as much as 1.18 %.
In this study, antioxidant activity was supported with phenolic and flavonoid contents existing in C. heyneana. One of the phenolic compounds that exist in C. heyneana is curcuminoid that is suggested to offer a protective mechanism through two ways: (1) direct, and (2) indirect. A direct mechanism is carried out by blocking the radical molecule or scavenging free radicals by donating a hydrogen atom to radicals (13). Generally, the radical-scavenging activity of flavonoids depends on the molecular structure and the substitution pattern of hydroxyl groups, i.e., the availability of phenolic hydrogens and the possibility of stabilization of the resulting phenoxyl radicals via hydrogen bonding or by expanded electron delocalization (14, 15), whereas by activating endogenous antioxidants, indirect protection defenses systems like superoxide dismutase (SOD), catalase (CAT), glutathione peroxidase (GPx), glutathione reductase (GR), glutathione, and glutathione S-transferase (GSH) (16). Free radicals generated from ethanol ingestion lead to the decreased endogenous antioxidants and increased lipid peroxidation. Administration of curcuminoids may reverse that condition by enhancing the number of endogenous antioxidants, as mentioned above, and decreasing lipid peroxidation (10). The mechanism underlying the curcuminoid to protect the liver is by reducing the levels of proinflammatory mediators such as tumor necrosis factor-alpha (TNF-α), interleukin-6 (IL-6), and monocyte chemoattractant protein-1 (MCP-1). Moreover, curcumin significantly inhibited extracellular matrix deposition, reduced the number of activated stellate cells, and decreased the levels of high-mobility group box 1 (HMGB1), toll-like receptor 4 (TLR4), and toll-like receptor 2 (TLR2) expression (17). It is not only curcuminoid as a phenolic compound that is responsible for liver protection, but essential oils in C. heyneana are also responsible for hepatoprotective activity. The data of essential oils were obtained from GC-MS. Some studies have mentioned that camphor, spathulenol, and farnesol found in the composition of C. heyneana volatile oil have various pharmacological activities. Camphor may enhance the immune system, and spathulenol may have strong antioxidants and prevent inflammation, while farnesol may reduce oxidative stress and inflammation (18-20). Therefore, various chemical compounds in C. heyneana contribute in different ways to protect the liver from injury.
5.1. Conclusion
It can be concluded that the C. heyneana extract at doses of 50, 100, and 150 mg/kg are effective as hepatoprotective in ethanol, causing liver injury. Further research is needed to do extract fractionation to get the pure compound that is responsible for the hepatoprotective effect.
