1. Background
Decades of research have focused on finding approaches to enhance the shelf life and original quality of foods (1). Regardless of significant improvements in food quality and advancements in the food industry, about one-third of food products deteriorate worldwide. Food spoilage is of the main factors leading to food insecurity and is one of the top priorities for the sustainable development of countries. Fish and marine food products are considered nutritious, with many beneficial effects on human health, such as preventing cardiovascular diseases (2). However, they are highly susceptible to deterioration and categorized as perishable foods.
Putrefaction of fish and marine food products may occur due to the chemical and/or microbiological spoilage. Nowadays, an excellent green consumerism trend avoids consuming foods containing chemical and synthetic preservatives (3). Essential oils and their constituents (e.g., thymol and carvacrol) are plant-originated natural preservatives with an excellent advantage for muscle food products such as antioxidant and antimicrobial effects (4), which have been drawn the attention of researchers. Moreover, edible coatings have been employed in foods as an excipient to convey essential oils and their constituents in recent years. For example, Chamanara et al. (5) incorporated chitosan coating with Thymus vulgaris essential oil and evaluated its effects on the quality of rainbow trout stored in the refrigerator. They reported that the application of the mentioned coating increased the shelf life by at least five days.
In addition, natural preservatives with other origins, e.g., microbial metabolites, have been used to maintain the quality of foods. Nisin is a major bacteriocin produced by lactic acid bacteria, known as a generally regarded as safe (GRAS) additive in many countries (6). Nisin has also been incorporated in Tartary buckwheat polysaccharides to produce an edible coating, successfully enhancing tilapia’s shelf life during 12 days of storage (7).
2. Objectives
Although nano-gelatin coating characteristics have been studied previously (8-10), a few studies have investigated its effects on food models. In the present work, we attempted to develop an edible nano-gelatin coating incorporated with thymol and nisin to evaluate its effects on the chemical quality of rainbow trout samples stored at 4°C for up to 16 days. For this purpose, we assessed pH, thiobarbituric acid reactive substances (TBARS), peroxide value (PV), free fatty acids (FFA), and total volatile basic nitrogen (TVB-N) on days 0, 4, 8, 12, and 16.
3. Methods
3.1. Preparation of Coating Solutions
Gelatin (5% w/v, Sigma-Aldrich, St. Steinheim, Germany) was immersed in distilled water (DW) while glycerol (0.75 ml/g) was added as a plasticizer. According to a previous study (11), analytical-grade nisin and thymol (Sigma-Aldrich, St. Steinheim, Germany) were added to the gelatin solution to obtain 250 and 500 ppm concentrations. Subsequently, the mixture was blended by a digital mixer (IKA, Staufen, Germany) for two minutes at 10,000 rpm. The obtained emulsion was exposed to ultrasound using an ultrasound device (Sonopuls, Bandelin, Berlin, Germany) with an on-time pulse (45 seconds) and an off-time pulse (15 seconds). This process continued for six minutes at an amplitude of 50% and ultimately led to nanogel formation. The obtained nanogel from the interaction chamber was then cooled using a water bath with ice whose temperature always remained below 20°C (12).
3.2. Particle Size Measurement
A dynamic light scattering (DLS) equipped with a backscatter detector and Zetasizer NanoZS laser diffractometer (Nano S, Marven, England) was utilized to evaluate the nanogel droplet size and polydispersity index (PDI). The device was set at 633 nm and 25°C.
3.3. Preparation of Fish Fillets and Treatment
Live rainbow trout (Oncorhynchus mykiss) with a mean weight of one kilogram was obtained from a local market in Ahvaz, Khuzestan, Iran. The fish were then immediately transferred to the Food and Drug Control Laboratory at Jundishapur University of Medical Sciences using a water tank. They were killed by the percussive stunning method, eviscerated, beheaded, scaled, and washed with cold water. Four fillets were obtained from each fish with an approximate weight of 120 ± 15 g and washed again with tap water. The fillets were then placed on a clean metal grid with pores to drip.
Samples were randomly categorized into six groups, including control (C), gelatin (G), nano-gelatin (NG), nano-gelatin + thymol (NG-T), nano-gelatin + nisin (NG-N), nano-gelatin + nisin, and thymol (NG-T-N). The control group was directly placed in a PET container, and treatment groups were immersed in different solutions for two minutes. The fillet samples were then drained on a laminar flow cabinet, placed in a PET container, and held in a refrigerator at 4°C for 16 days. Further chemical analyses were carried out every four days (days 0, 4, 8, 12, and 16) in three replications, and an average was reported for each test.
3.4. pH Determination
Ten grams of fillet samples and 100 mL of distilled water were added to a 500 mL beaker and homogenized with a blending device (Moulinex, France). The pH of the mixture was determined with a digital pH meter (Sartorius, USA).
3.5. Peroxide Value
Lipid extraction from fish fillet samples was carried out as per the method of Bligh and Dyer (13) with minor modifications conducive to reducing the use of methanol and chloroform. One gram of extracted lipid and 30 mL of the acetic acid: chloroform (3: 2) solution were transferred to a 250 mL Erlenmeyer and lipids were dissolved by gentle shaking. Distilled water (30 mL) and saturated potassium iodide solution (0.5 mL, 1% w/v) were added to the mixture and kept in the dark for one minute. Then, 0.01 N sodium thiosulfate solution was used to titrate the liberated iodine. Analysis was carried out in triplicate, and the mean milliequivalents of peroxide oxygen per kilogram of lipid were reported (14).
3.6. Free Fatty Acid
For free fatty acid (FFA) determination, 0.5 g of the extracted fish lipid was dissolved in 25 mL of ethyl ether and ethanol solution (ratio 1: 1, v/v), and phenolphthalein was added as an indicator. Then, NaOH (0.1 N) was used for mixture titration. Analysis was performed in triplicate, and the obtained results were reported as the mean percentage of oleic acid (15).
3.7. Thiobarbituric Acid Reactive Substance
The thiobarbituric acid reactive substance (TBARS) analysis was carried out as per the method described by Tsironi et al. (16). Briefly, five grams of fish fillets were homogenized with 15 mL of DW. Then, 2 mL of thiobarbituric acid (TBA) solution and one milliliter of the homogenate were transferred into a glass tube and held for one hour in a 90°C water bath. After cooling to room temperature, the tube was centrifuged for 15 min at 2,000 g. A spectrophotometer (Cecil, England) was used to measure the absorbance of samples (AS) and the absorbance of blank (AB) at 532 nm. Analysis was performed in three replicates, and mean TBARS values were reported as milligrams of malonaldehyde equivalent per kilogram of tissue, using the following formula:
3.8. Total Volatile Basic Nitrogen
The total volatile basic nitrogen (TVB-N) was measured as per the Goulas and Kontominas (17) method with slight modifications. Briefly, 10 g of fillet sample was mixed with 50 mL of DW using a blending device (Moulinex, France). The mixture and 200 mL of DW were poured into a round bottom flask, and 2 g of MgO and a drop of silicon were added to the flask. The mixture was distilled, and the distillate receiver flask was a 250 mL Erlenmeyer flask containing boric acid, methylene blue, and methyl red. The distillation continued for 20 min until the boric acid solution turned green. Captured TVB-N in the receiver flask was titrated by sulfuric acid solution (0.1 N) until the color turned pink. The TVB-N value (mg N/100 g fish samples) was calculated with the following formula:
V: Volume of consumed sulfuric acid for titration
C: Concentration of sulfuric acid
3.9. Statistical Analysis
All tests were carried out in three replications. The data were expressed as the mean ± standard deviation. SPSS version 16 software (SPSS, Inc., Chicago, IL, USA) was used to do statistical analysis using ANOVA and Tukey’s test to investigate the significant differences between the groups at a confidence level of P < 0.05.
4. Results and Discussion
4.1. Characterization of Nanogel Coating
A DLS device measured the diameter of the nano-gelatin coating droplet, showing a mean diameter of 140 nm. This result is well consistent with the study of Chen et al. (18). They synthesized a nanogel consisting of protein and gelatin incorporated with gold nanoparticles and reported that the size of the nanogel was between 50 and 200 nm (regarding the ratio of protein and gelatin). Zhang et al. (10) developed an edible coating from chitosan and gelatin containing tarragon essential oil and reported a 246 nm diameter, which was higher than that in the current results. Sarika et al. (19) developed nanogels with gelatin and aldehyde and reported a 120 - 147 nm diameter size for these nanogels, which is consistent with the current study. Different diameter sizes of nanogels could be attributed to applying different types of gelatins with different sizes. Moreover, the presence of other compounds such as chitosan in nanogels affects the size of the droplet. In the current study, nano-gelatin showed a PDI of 0.36, which is in line with the results of Abreu et al. (20). The PDI measures tending to zero indicate the homogeneity of size distribution, while PDI values around one point out the heterogeneity of size distribution (21). Therefore, PDI data in this study showed appropriate heterogeneous size distributions.
4.2. pH
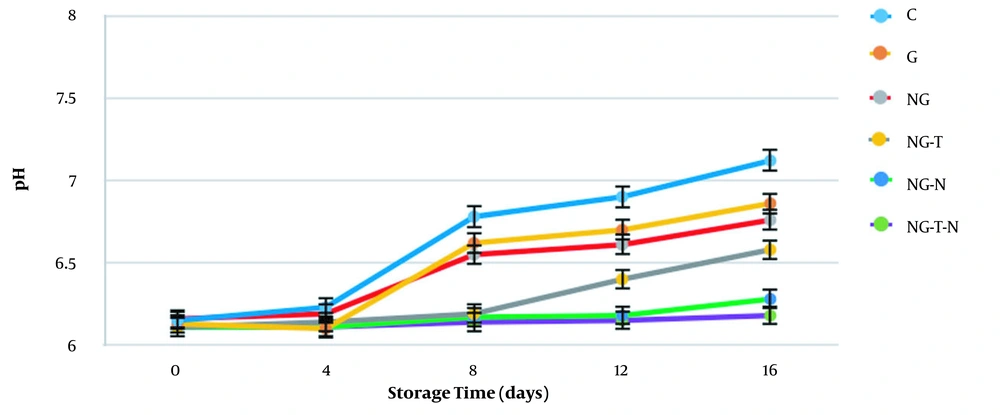
The mean pH values are presented in Figure 1 during 16 days of storage. Overall, the pH measures showed a significant constant increase, which is in line with the study of Vital et al. (22). The maximum pH value was recorded for the control group on day 16 (pH = 7.12 ± 0.02), while the lowest amounts were measured for NG-T-N (pH = 6.18 ± 0.02), followed by NG-N (pH = 6.28 ± 0.04), indicating better results in these groups. Bacterial metabolism is conducive to the production of ammonia and other alkaline compounds, which increase the pH. This progressive phenomenon is a sign of spoilage. Lower pH amounts in NG-T-N and NG-N may be attributed to the bacterial growth inhibition in these groups (23).
4.3. Lipid Oxidation in Fillet Samples
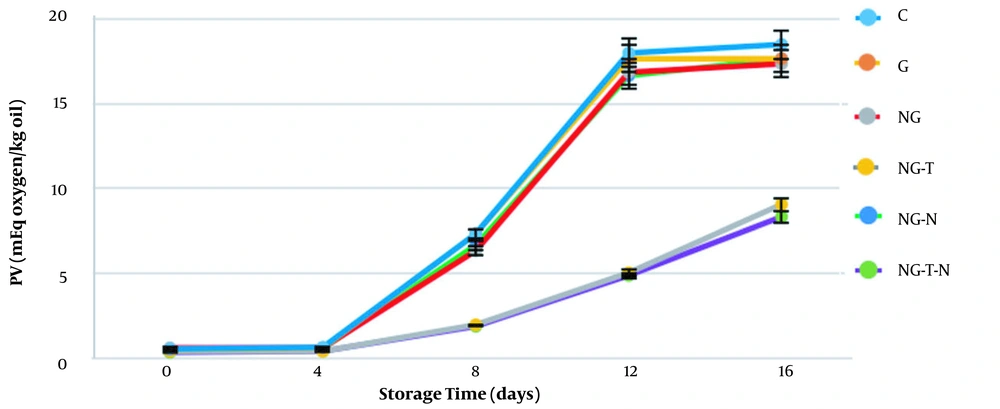
The amounts of PV in fish lipids of different groups are presented in Figure 2. The PVs for different treatments were low on days 0 and 4, but they increased significantly (P < 0.05) in subsequent days until 16 days of storage. On the final day of storage, the highest PV was recorded for the control group (18.5 ± 0.86 meq oxygen/kg oil), while the lowest amount was measured for NG-T-N (8.33 ± 0.57 meq oxygen/kg oil), followed by NG-T treatment (9.06 ± 0.94 meq oxygen/kg oil). Herein, the differences between NG-T-N and NG-T groups and other groups were observed from day 8 (P < 0.05) and remained until the last day of storage. Concerning the acceptable limit for PV (5 meq active O2/kg lipid) on day 8, the C, G, NG, and NG-N groups exceeded this limit, while the NG-T-N and NG-T groups remained within the acceptable range at least for four more days. Our results agree with the study of Dehghani et al. (24), which reported lower PV measures in rainbow trout samples treated with clove and Shirazi thyme essential oil. In another study, gelatin incorporated with orange leaf essential oil was utilized to increase the shelf life of shrimp stored at 4°C (25). They reported that the antioxidant activity of essential oil significantly affected the PVs and retained the samples below acceptable limits.
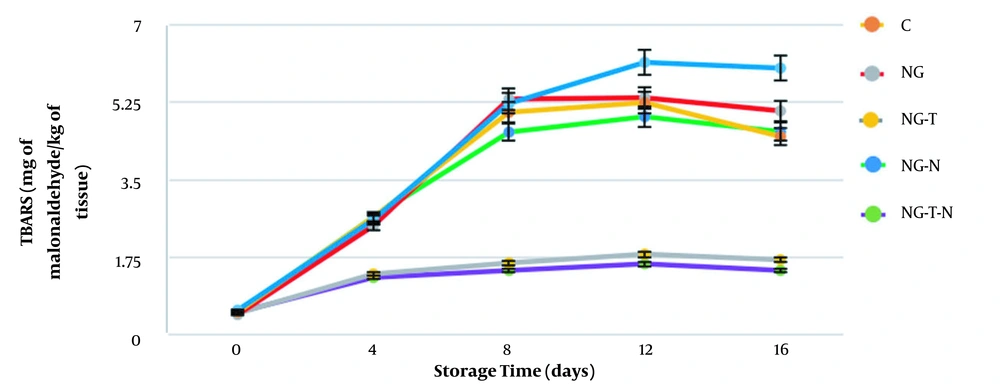
Another index for lipid oxidation is TBARS, which indicates the level of secondary lipid oxidation. Different TBARS values in fish fillets during storage are depicted in Figure 3. At the beginning of the storage, TBARS values for all groups were approximately 0.5 mg of malonaldehyde/kg tissue and reached the range of 1.45 ± 0.43 to 6.03 ± 0.2 mg of malonaldehyde/kg tissue. The lowest amounts of TBARS were 1.45 ± 0.43 and 1.69 ± 0.49 mg of malonaldehyde/kg tissue for the NG-T-N and NG-T groups, respectively. The increasing trend in TBARS values was similar to the study of Ojagh et al. (26), Rezaeifar et al. (27), and Sarmast et al. (28). In this study, a comparison of TBARS values between different treatments showed similar results to PVs, and the best results were obtained in the NG-T-N and NG-T groups. The maximum TBARS value allowed for fish is 5 mg of malonaldehyde equivalent/kg tissue (29). Considering this limit, only treatments containing thymol remained acceptable during storage. The effectiveness of a combination of gelatin and essential oils in reducing lipid oxidation and TBARS values was reported by other researchers (25, 30). They concluded that gelatin alone could not retard lipid oxidation, but the incorporation of gelatin with essential oils significantly reduced the TBARS values. However, in another study by Hosseini et al. (23), gelatin coating containing oregano essential oil was used to increase the shelf life of rainbow trout. The results showed that oregano essential oil could not significantly reduce the TBARS values.
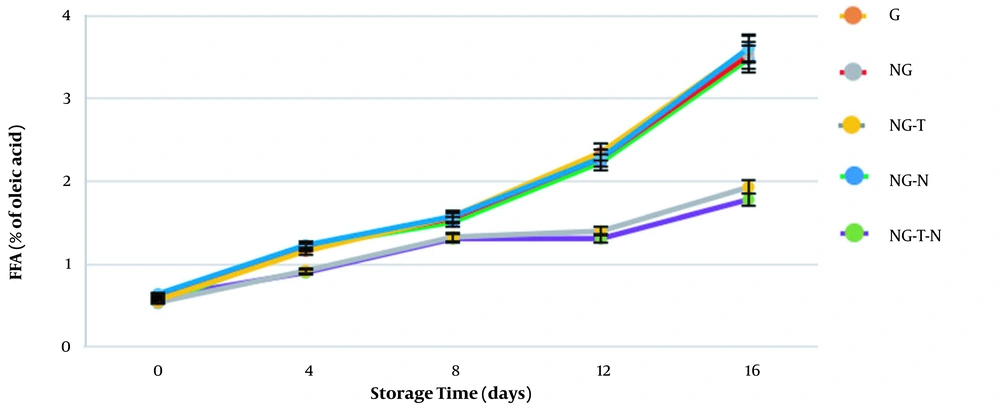
Determination of free fatty acid (FFA) is another typical analysis to reveal lipid oxidation in foods. Lipid hydrolysis gives rise to FFA, and FFA measurement can be used as an indicator of rancidity. Moreover, evidence denotes an indirect correlation between FFA levels and freshness (31). The FFA values in our study are presented in Figure 4. The initial amounts of FFA were in the range of 0.53%-0.64% of oleic acid and increased to 1.78%-3.61% of oleic acid on day 16. A constant increase in FFA was reported by other studies (32, 33). The best results were demonstrated in NG-T-N treatment, followed by NG-T treatment. The FFA values in other groups (C, G, NG, and NG-N) were significantly higher (P < 0.05), showing poor antioxidant activity. It seems that thymol was effective in reducing lipid oxidation. It has been reported that the gelatin coating embedded with cinnamon oil dramatically reduced the FFA amounts, which is compatible with our study (30). Heydari et al. (34) produced a coating including sodium alginate and Mentha longifolia essential oil to improve the shelf life of carp fillets. They reported that FFA values were significantly reduced in groups treated with Mentha longifolia essential oil. The FFA is the product of further oxidation of lipids with a low molecular weight that causes undesirable odor and taste of fish products (35). Better results of FFA analysis may be due to the antioxidant effect of essential oils. Moreover, it seems that gelatin nanogel, when surrounding fillets, isolates them from the environment and prevents the contact of oxygen with the samples. This phenomenon consequently retards the oxidation process.
Lipid oxidation leads to rancidity and spoilage of foods such as fish, induced by enzymatic reactions and autoxidation. Due to the considerable amounts of polyunsaturated fatty acids in fish, these food products are highly susceptible to deterioration. Better results of NG-T-N and NG-T treatments in lipid oxidation tests were ascribed to the presence of thymol. Thymol is one of the main constituents of some essential oils such as thyme (Thymus vulgaris) and Carum copticum, granting them excellent antioxidant activity. Thymol belongs to phenolic compounds with redox properties, demonstrating antioxidant effects in fish meat (36). Phenolic compounds are metal chelators, hydrogen donors, singlet oxygen quenchers, and reducing agents (37). The current study showed that gelatin and nisin could not prevent lipid oxidation. Overall, the incorporation of thymol in NG-T-N and NG-T groups resulted in exquisite retardation of lipid oxidation in PV, TBARS, and FFA analysis, while the lack of an antioxidant agent in C, G, and NG-N groups caused a high level of lipid oxidation and rancidity.
4.4. Total Volatile Basic Nitrogen
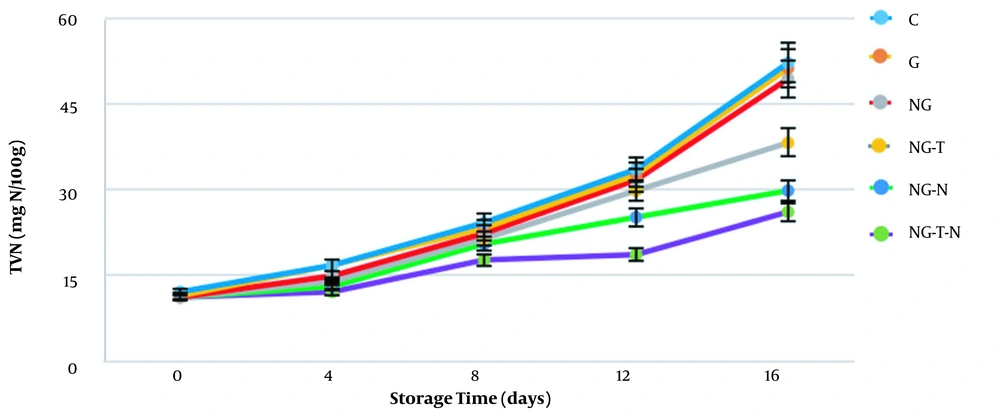
The total volatile basic nitrogen (TVB-N) is a well-known analysis for measuring ammonia, dimethylamine, trimethylamine, and other volatile nitrogenous compounds in muscle foods, reflecting the degree of deterioration. Therefore, it is exploited as an indicator of the quality of fish. The TVB-N values in different groups are shown in Figure 5. The TVB-N values on the first day ranged from 11.2 ± 0.0 to 12.13 ± 1.6 mg N/100 g and reached 26.13 ± 1.6 to 52.26 ± 1.5 mg N/100 g, which exhibited a constant increase during 16 days of storage. Similar results were reported by Dehghani et al. (24), Shadman et al. (32), and Hosseini et al. (23). On the final day of storage, the amounts of TVB-N were significantly lower in the NG-T, NG-N, and NG-T-N groups than in the C, G, and NG groups (P < 0.05). The TVB-N at the end of storage was recorded at 26.13, 29.86, and 38.26 mg N/100 g for NG-T-N, NG-N, and NG-T, respectively. These data showed that gelatin and nano-gelatin could not prevent the incremental trend of TVB-N. Conversely, the addition of nisin and thymol effectively reduced the TVB-N values. Moreover, simultaneous incorporation of nisin and thymol into the nano-gelatin demonstrated the best results, indicating their possible synergistic effects. Regarding the suggestion of 25 mg N/100 g TVB-N as the upper acceptability limit for rainbow trout (24), the NG-T-N group surpassed the defined limit on the final day of storage. However, other groups were above the defined limit on day 12, revealing that NG-T-N treatment enhanced the quality of rainbow trout fillets for four days (regarding the TVB-N test).
Different essential oils containing thymol could reduce the TVB-N values. Hosseini et al. (23) performed a study to increase the shelf life of rainbow trout by using the gelatin coating containing oregano essential oil. The primary constituent of oregano essential oil used by Hosseini et al. (23) was thymol, and its addition to the gelatin coating significantly reduced the TVB-N values. Moreover, Ziziphora clinopodioides essential oil was embedded with the chitosan-gelatin film to improve the quality of minced trout fillets (38). The analysis of Ziziphora clinopodioides showed that carvacrol and thymol were its main components. The TVB-N values in the study by Kakaei and Shahbazi (38) significantly decreased after adding Ziziphora clinopodioides essential oil. Besides, the beneficial effects of nisin on the quality of sea bass (Dicentrarchus labrax L.) were evaluated by Ucar et al. (39). They reported that the addition of 0.8% w/v nisin to sea bass fillets increased its shelf life by at least two days (concerning TVB-N analysis).
5. Conclusions
This study revealed that nano-gelatin incorporated with thymol and nisin exhibited beneficial effects on rainbow trout fillets’ shelf life and quality during 16 days of storage at 4°C. The pHs were significantly (P < 0.05) lower in NG-N, NG-T, and NG-T-N treatments than in other treatments indicating the better quality of samples. The PV, TBARS, and FFA analyses revealed that the addition of thymol to nano-gelatin retarded lipid oxidation. Nano-gelatin and nisin alone were ineffective in lipid oxidation reactions and unable to inhibit this process. However, among all treatments, the simultaneous application of nisin and thymol showed the best result, and the lowest amounts for PV, TBARS, and FFA were measured in the NG-T-N group. This phenomenon may be attributed to the synergistic effects of antioxidant activities ascribed to thymol and nisin. The NG-T, NG-N, and NG-T-N treatments showed significantly (P < 0.05) lower TVB-N values than others. Similar to the results of lipid oxidation tests, the lowest TVB-N values were observed in the NG-T-N treatment. Unlike the results of lipid oxidation tests, the addition of nisin alone significantly (P < 0.05) affected the TVB-N values, indicating the possible antimicrobial effects. We suggest that nano-gelatin coating incorporated with nisin and/or thymol can be utilized in muscle foods to increase chemical quality and shelf life. The seafood industry can use a nano-gelatin coating with nisin and thymol to remove synthetic chemical additives. Other studies should be carried out to investigate the effects of this coating on other food models.
