1. Background
Multidrug resistance (MDR) is a major obstacle to successful chemotherapy, which leads to resistance to combination chemotherapy (1). One of the most important reasons for cancer drug resistance is to prevent the accumulation of anticancer drugs within the malignant cells. This general type of resistance is often caused by the overexpression of one of the oldest protein superfamilies called ATP (adenosine triphosphate)-binding cassette (ABC) transporters, which expel the drug molecules out of dividing tumor cells (2). Therefore, inhibition of the ABC transporters might be an effective approach to sensitize the resistant cells to chemotherapy drugs (3). MDR proteins (MRPs) are the transporters belonging to the “C” branch of the ABC superfamily. These family members transport and detoxify many chemically unrelated compounds and hamper the success of cancer pharmacotherapy (4). MRP3 or ABC subfamily C member 3 (ABCC3) is expressed in several tissue, predominantly in the kidney, liver, pancreas, and small intestine (5). ABCC3 gene is located on chromosome 17q22 and consists of 31 exons. It encodes 1527 amino acids, and the resulting 170- and 190-kDa membrane proteins have different glycosylation patterns. Human ABCC3 (hABCC3) is presumed to have three membranes and two large cytoplasmic domains. These two cytoplasmic domains contain nucleotide binding domains 1 and 2 (NBD-1 and -2) (6). The hABCC3 can confer the resistance against anticancer agents; a finding supported by previous studies showing the hABCC3 overexpression in multiple cancer types. Accordingly, it can be considered as a prognostic marker and therapeutic target (3). To explore the exact mechanism of action of an ABC transporter, its structure should precisely be explored. Despite efforts to determine the three-dimensional (3D) structure of ABC proteins, their high-resolution structure is still unknown since eukaryotic transporters are refracted in structural analysis (7).
Nowadays, in-silico models provide a fast, inexpensive, and non-laborious screening platform with promising and valuable results (8). In the current research, the homology modeling of hABCC3 was presented using the crystal structure of bovine ABCC1 (bABCC1) as a template. Furthermore, its docking to combination chemotherapeutic drugs was analyzed. Then, the results of the computational approaches were used to assess the binding characteristics of hABCC3 to the acute leukemia therapeutic agents such as etoposide, methotrexate, doxorubicin, vincristine, mitoxantrone, idarubicin, cytarabine, daunorubicin, prednisolone, and fludarabine, and four hABCC3 inhibitors including indomethacin, sulfinpyrazone, verapamil, and glyburide were discussed.
2. Methods
2.1. Software
Two programs including SWISS-MODEL server (https://swissmodel.expasy.org/) (9) and MODELLER 9.19 (10) were used to build homology models of hABCC3. Then, predicted models were evaluated by PROCHECK 3.5 (11) and the web-based version of ProSA (12). Molecular docking was performed by AutoDock 4.6.2 to combine chemotherapeutic agents (13). Finally, UCSF Chimera 1.11.2 (14), LigPlot 1.4.5 (15), and Swiss PDB viewer 4.10 (SPDBV) (16) were utilized for interactive visualization and molecular structure analysis.
2.2. Sequence Alignment and Homology Modeling
The FASTA sequence of hABCC3 (accession number: O15438) was retrieved from UniProt database (17) and used to find a suitable template with the most similarity to this transporter by basic local alignment search toolbox (BLAST) at PDB database (18). The bABCC1 (PDB ID: 5UJ9) (19) was an appropriate template for hABCC3. Then homology modeling of hABCC3 was performed by MODELLER 9.19 and SWISS-MODEL server.
2.3. Structure Analysis and Model Validation
The models of hABCC3 generated by SWISS-MODEL and MODELLER 9.19 were assessed by the Ramachandran plot (20) using PROCHECK, and checking the Z-score of structures obtained by ProSA (12). Finally, the model presented by MODELLER was selected for subsequent studies based on geometric and 3D alignment analyses. Then, the structures of the constructed hABCC3 model and the template were compared by Chimera.
2.4. Selection of the Ligand Molecules
First, in vitro hABCC3 substrates and inhibitors, as well as acute leukemia combination chemotherapeutic agents were obtained from DrugBank (21) (supplementary file Appendix 1). Then, ligand coordinates were obtained from DrugBank, PubChem Compound (22), and ZINC databases (23) (supplementary file Appendix 2).
2.5. Blind Docking
Molecular docking was performed using AutoDock 4.6.2 software to detect the ligand binding sites and probable binding pattern of abovementioned agents. In order to reduce the computational cost and time, a rigid docking protocol was considered through rigid receptor and rotatable ligands (13). AutoDockTools 1.5.6 was used to add the Gasteiger charges, merge non-polar hydrogen atoms, and define rotatable bonds (24). For blind docking, the two cytoplasmic domains (containing NBD-1 and NBD-2) were covered with two separate grid boxes of 126 × 126 × 126 grid points and 0.375 Å space between the points. The Lamarckian genetic algorithm was used to explore the best conformational space of the ligand (24). Accordingly, number of the runs in each docking experiment was set to 100, while other parameters were set to default. After collecting binding free energies of each ligand, the top results were selected. Then, the interaction between the protein and the ligands were precisely analyzed using LigPlot software.
3. Results and Discussion
3.1. Structure Prediction and Validation
Generally, a high sequence identity is preferred for high-quality models, although to establish a membrane transporter protein model of adequate quality, more than 30% similarity between the target and template sequences is required (25-27). Accordingly, blast of hABCC3 sequence (accession number: O15438) in the PDB database showed that the crystal structure of bABCC1 (PDB ID: 5UJ9) had the most query coverage and sequence identity (57%) among all other proteins (Figure 1). Hence, the 3D structure of bABCC1 was used as a template for model generation. The SWISS-MODEL and MODELLER 9.19 programs were used to build hABCC3 model (supplementary file Appendix 3). Then, the predicted model quality was evaluated by PROCHECK and ProSA programs. Further evaluation of the model by PROCHECK demonstrated that 99.3% of residues were in the allowed regions, showing the acceptable quality of the constructed model (supplementary file Appendix 4) (Table 1). In addition, Z-score obtained from ProSA tool was also used to evaluate the model quality. Generally, ProSA is used to assess the similarity rate between the input structure and the native proteins with the same size. Here, the Z-score for hABCC3 model was -12.7, which was within the acceptable range according to the X-ray and NMR studies (12) (supplementary file Appendix 5). These values supported the structural validity of the hABCC3 model.
| Name | Most Favored Region, % | Additional Allowed Region, % | Generously Allowed Region, % | Disallowed Region, % |
|---|---|---|---|---|
| hABCC3 model | 90.3 | 8.1 | 0.9 | 0.7 |
3.2. Blind Docking Analysis to Predict the Ligand Binding Sites
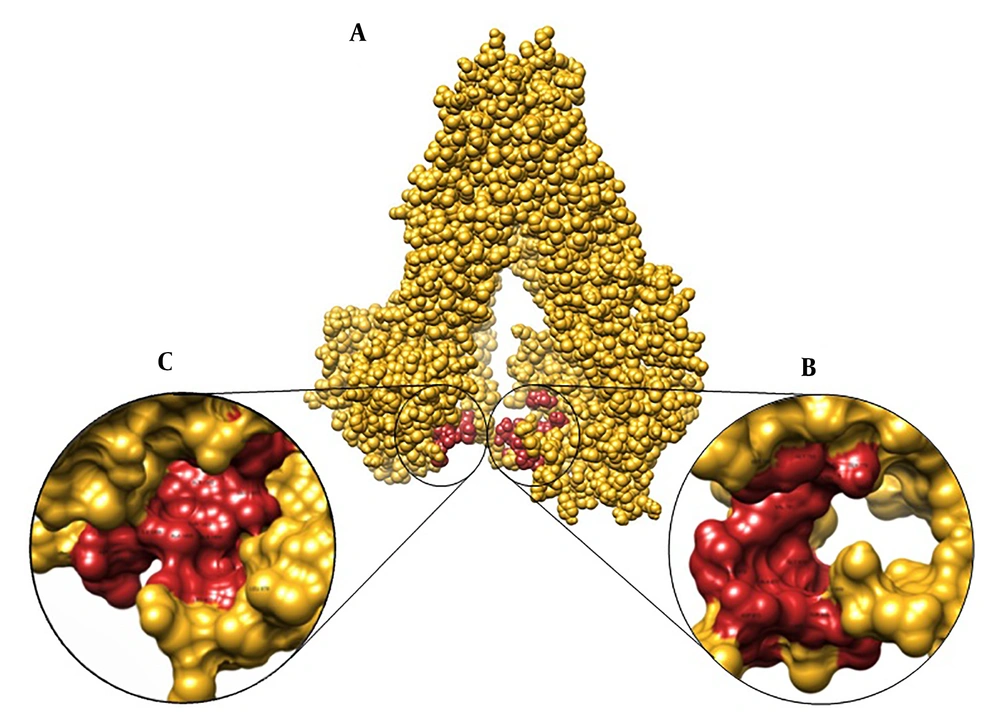
Blind docking is a reliable and useful approach to explore the possible ligand binding sites on a protein (28, 29). In fact, blind docking approach is used in a variety of docking studies to explore unknown binding sites on different proteins (7, 30-33). The blind docking approach was employed in the present study to dock the acute leukemia chemotherapeutic agents, considering the undefined ligand binding sites on hABCC3. These agents included etoposide, methotrexate, doxorubicin, vincristine, mitoxantrone, idarubicin, cytarabine, daunorubicin, prednisolone and fludarabine, as well as four hABCC3 inhibitors- i.e., indomethacin, sulfinpyrazone, verapamil, and glyburide. The current study employed two grid volumes covering two cytoplasmic domains of hABCC3 transporter. Then, the abovementioned ligands were blindly docked and the potent binding areas were predicted according to the most frequent binding sites and the highest binding affinities. In other words, the blind docking approach yielded 100 binding conformations for each ligand. The highest binding affinity of each compound belonged to a binding site that had the highest overlap among all ligands. Accordingly, all the agents examined in the study were bounded to two specific hotspot areas, located in two cytoplasmic domains of hABCC3 model; i.e., two ligand binding sites were exist. Structural analysis revealed that substantial amino acids involved in the conformation of PBS of cytoplasmic domain 1 (PBS-1) included Ser752, Gly753, Ser779, Ala780, Val781, Trp865, Thr866, Leu868, Glu869, Gly870, Ala871, Glu872, and Asp873, and amino acids involved in the conformation of PBS-2 were Leu877, Leu878, Ile879, Gln1371, Glu1451, Ala1452, Thr1453, Ala1454, Ala1455, Ile1456, Asp1457, and Leu1458. Moreover, residues such as Ser752, Gly753, Ser779, Ala780, and Val781 in PBS-1, and Gln1371, Glu1451, Ala1452, Thr1453, Ala1454, Ala1455, Ile1456, Asp1457, and Leu1458 in PBS-2 were conserved. These predicted binding sites were determined using AutoDockTools and Chimera (Figure 2) and then, the top binding free energy of each ligand in these sites was specified.
3.3. Docking Results of Cytoplasmic Domains 1 and 2
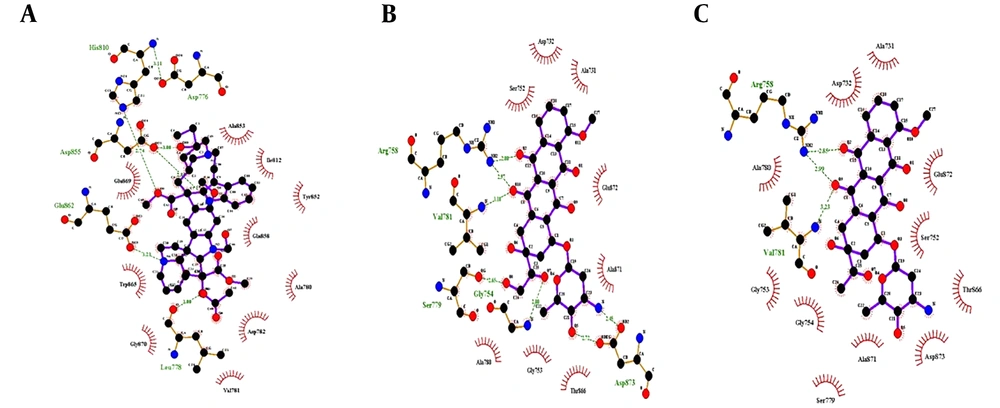
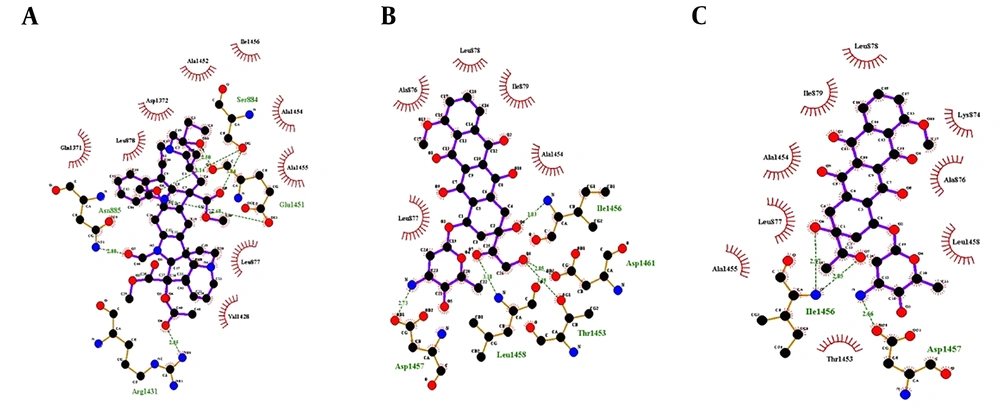
Docking energy of AutoDock showed the highest binding affinity to the PBS-1 in vincristine, followed by doxorubicin and daunorubicin. Interestingly, the three drugs with the highest binding affinities to PBS-2 were similar to those of PBS-1. In other words, these three drugs had more favorable interaction energies and higher affinities to both PBS-1 and PBS-2. The docking results of the ligands along with their binding energies for PBS-1 and PBS-2 are illustrated in Table 2. Residues involved in hydrogen binding and hydrophobic interactions in the binding modes are shown in Figures 3 and 4.
| Ligand | AutoDock Docking Energy (kcal/mol) | ||
|---|---|---|---|
| PBS-1 | PBS-2 | ||
| 1 | Vincristine | -10.79 | -8.86 |
| 2 | Doxorubicin | -9.26 | -8.5 |
| 3 | Daunorubicin | -8.82 | -7.77 |
| 4 | Idarubicin | -8.66 | -7.1 |
| 5 | Mitoxantrone | -8.47 | -7.36 |
| 6 | Verapamil | -8 | -6.95 |
| 7 | Etoposide | -6.79 | -6.98 |
| 8 | Methotrexate | -6.64 | -6.3 |
| 9 | Glyburide | -6.5 | -5.67 |
| 10 | Prednisolone | -6.2 | -5.23 |
| 11 | Sulfinpyrazone | -5.83 | -6.35 |
| 12 | Fludarabine | -3.43 | -3.11 |
| 13 | Cytarabine | -3.34 | -3.28 |
| 14 | Indomethacin | Not seen | -6.03 |
Representations of the binding modes of the three drugs with more favorable interaction energy and stronger affinity to the PBS-1 of hABCC3 model (vincristine, doxorubicin, and daunorubicin, respectively), showing the ligands (purple), residues involved in hydrogen binding with the ligand (brown) along with their hydrogen bonds (green), and residues involved in non-bonded interactions (red spikes).
Representations of the binding modes of three drugs with highest binding affinities to the PBS-2 of hABCC3 model (vincristine, doxorubicin, and daunorubicin, respectively), showing the ligands (purple), residues involved in hydrogen binding with the ligand (brown) along with their hydrogen bonds (green), and residues involved in non-bonded interactions (red spikes).
In the present study, three drugs with the highest affinity for hABCC3 were introduced to take a step toward the possible hABCC3 targeting in drug-resistant acute leukemia. Furthermore, the application of in-silico methods in targeted cancer therapies, especially leukemia treatment, was highlighted in the current study.


