1. Background
Amiodarone (AMI) is an anti-arrhythmic medication primarily indicated for the treatment of ventricular and supraventricular tachycardia (1). In emergency situations, such as acute myocardial infarction, it is administered intravenously. However, high doses of AMI may lead to side effects, including hypotension (2), and its clinical use is constrained by its low water solubility. Encapsulation can enhance both the solubility and clinical application of AMI (3). Previous research has explored various nanostructures, including nanoemulsions, liposomes, and lipid nanocapsules (4, 5). These studies have demonstrated improved apparent solubility, high loading efficiency, and extended drug release.
Solid lipid nanoparticles (SLN) are colloidal drug delivery systems made from biocompatible lipids with submicron diameters. Drugs classified under the Biopharmaceutical Classification System (BCS) Classes II and IV are well-suited for loading into Solid lipid nanoparticles (SLNs) to enhance dissolution and bioavailability (6). Esposito et al. have suggested that SLN and nanostructured lipid carriers (NLC) can increase the solubility of drugs with low water solubility (such as dimethyl fumarate, retinyl palmitate, progesterone, and the endocannabinoid hydrolysis inhibitor URB597) by 1.5 to 8 times. Their findings indicate that the intranasal administration of URB597 in SLNs is as effective as intraperitoneal administration in rats (7).
Various methods are available for preparing SLNs, including high-pressure homogenization, ultrasound techniques, and solvent-based techniques. For this research, hot homogenization was chosen. The characteristics of the formulation are influenced by numerous process and formulation factors, making it time- and cost-efficient to identify significantly effective parameters. The design of experiments (DOE) offers a systematic approach for optimization. Within the Quality by Design (QBD) framework, DOE helps identify critical process and formulation parameters. A dual approach, utilizing a fractional factorial design (FFD) for optimizing process parameters and then a Box–Behnken design (BBD) for a second-order experimental design, was employed. The BBD was chosen to optimize the formulation parameters and to explore the interactions between parameters (8, 9).
The foundation of all SLN preparation methods is the formation of an emulsion, reduction of droplet size, and lipid solidification, necessitating the presence of surfactants (10). However, determining the optimal surfactant concentration poses a challenge due to their toxicity and tendency to self-assemble into micelles once the surface saturation point is reached (11). High surfactant concentrations lead to micelle formation, which exhibits different structural characteristics compared to SLNs. The presence of micelles affects the in vitro and in vivo behaviors of the particles differently. Due to their toxicity, using a minimal amount of surfactant is ideal for SLN preparation. Halder et al. demonstrated that Tween 20, a non-ionic surfactant, is adsorbed on both hydrophilic and lipophilic surfaces below and above the critical micelle concentration (CMC) point. Adsorption beyond the CMC leads to the formation of multi-molecular surfactant layers (12). At very low surfactant concentrations, large areas of lipid surface remain uncovered and exposed to water molecules, causing the lipids to aggregate and form larger diameter particles. A challenging aspect of SLN preparation involves determining the optimal concentration of surfactants.
2. Objectives
This study aimed to theoretically evaluate the necessary concentration of surfactants and compare it with the outcomes of experimental optimization using DOE. To this end, AMI-loaded SLNs were prepared. The process was optimized through DOE, and the optimal formulation was characterized based on in vitro studies. Finally, the optimal surfactant concentration was calculated by considering the surface area occupied by surfactant molecules, and these results were compared with the optimizations derived from DOE.
3. Methods
3.1. Materials
Poloxamer 188, sodium lauryl sulfate (SLS), Tween 80, Witepsol, glyceryl monostearate (GMS), soy lecithin, and Precirol were obtained from Sigma-Aldrich Co. (MO, USA). AMI hydrochloride was provided as a gift. All materials were utilized as received without further purification.
3.2. Determination of Lipid Mixture Melting Point
The lipid mixture, in the optimal formulation ratios (Witepsol: GMS: Lecithin, 15:1.6:1), was heated to 70°C until fully melted and thoroughly mixed. After allowing it to solidify, a capillary tube was dipped into the mixture to collect a sample. The melting point (MP) was determined in open capillaries using an Electrothermal MEL-TEMP apparatus (model 9200), noting the temperature at which the lipid mixture melted.
3.3. Preparation of AMI-loaded Solid Lipid Nanoparticles
Solid lipid nanoparticles (SLNs) containing AMI were prepared using a hot homogenization method, as described by Bhattacharyya and Reddy (13) and Rahman et al. (14), with minor adjustments Various formulations, as specified in Table 1, were prepared. The lipid phase, containing 230 mg Witepsol, 25 mg GMS, and selected amounts of lecithin, was heated to approximately 75°C to melt all components, after which 50 mg AMI was added and dissolved completely. Subsequently, the aqueous phase containing SLS and poloxamer was heated to the same temperature as the lipid phase and combined with the lipid mixture under high shear homogenization (Heidolph, Silent Crusher M, Germany) at 15000 rpm for 10 minutes. The mixture was also stirred at 300 rpm to ensure complete emulsification of all lipids in water and to prevent any un-homogenized areas. Following this, the emulsion underwent further homogenization using a probe sonicator (Bandelin, Germany) at an amplitude of 65% for 4 minutes. The final nanoemulsion was stirred for 1 hour at room temperature to form SLNs, which were then stored at 4°C for subsequent analysis.
| Run order | Factor A | Factor B | Factor C | Factor D | Factor E | Response 1 | Response 2 |
|---|---|---|---|---|---|---|---|
| Lipid Type | Surfactant Type | Homogenization Time (min) | Homogenization Rate (-) | Cooling Temperature ( | Size (nm) | 2-Day Size (nm) | |
| 1 | witepsol | tween 80 | 10 | 5000 | 0 | 78 | 308 |
| 2 | precirol | Poloxamer | 30 | 5000 | 0 | 495 | 412 |
| 3 | precirol | tween 80 | 10 | 20000 | 25 | 75 | 77 |
| 4 | witepsol | Poloxamer | 30 | 20000 | 25 | 75 | 74 |
| 5 | witepsol | Poloxamer | 10 | 20000 | 0 | 76 | 685 |
| 6 | precirol | tween 80 | 30 | 20000 | 0 | 465 | 837 |
| 7 | witepsol | tween 80 | 30 | 5000 | 25 | 156 | 74 |
| 8 | precirol | poloxamer | 10 | 5000 | 25 | 326 | 78 |
3.4. Experimental Design
Given the numerous factors that can influence the outcomes, the variables were categorized into process parameters and formulation parameters, which included surfactant concentrations. To streamline the experimental process, two experimental designs were utilized to minimize the number of runs. Process variables were optimized using FFD, and the most effective preparation procedure identified was then used for the subsequent experimental design to prepare formulations. The quantities of each surfactant were optimized using BBD. The combined use of FFD and BBD enabled the identification of the optimal proportions of each parameter affecting Critical Quality Attributes (CQAs). An initial risk assessment was performed using an Ishikawa diagram, highlighting the process risks and their potential causes (15, 16) Minitab Statistical Software (Minitab Inc., USA) and ANOVA were employed for DOE and statistical analysis. The preparation of optimal formulations was replicated 3 times.
3.4.1. Fractional Factorial Design (FFD)
A 2(5-2) fractional factorial design with resolution III was implemented. The exponentiation indicates that five parameters were studied (k = 5), and the subtraction signifies that the study was executed using one-quarter of a full factorial design (P = 2). The independent variables considered were lipid type (A), surfactant type (B), homogenization time (C), homogenization rate (D), and cooling temperature (E). These factors are related to the preparation process and are influential on the particle size. Size reduction is achieved through the force of the homogenizer. Consequently, particles may aggregate, and their diameter may increase upon cessation of homogenization. A short-term evaluation of particle size was conducted to confirm the stability of the formulation. These parameters (A-E) were chosen as variables. The diameters immediately after preparation and after 2 days were considered as the target CQAs. The design matrix created by Minitab and the responses are detailed in Table 1.
3.4.2. Box-Behnken Design
The lipid phase ratio was determined based on a preliminary study of AMI's solubility in the lipid phase. Given that surfactant concentration is a critical parameter for SLN preparation, (17) it was optimized using BBD. The BBD matrix is presented in Table 2. A 15-run BBD with three levels was conducted, consisting of points at the middle of each edge of a multidimensional cube and a central point. The existence of "missing corners" helps to prevent data loss. The nonlinear quadratic Equation 1 used was as follows:
SLS concentration (X1), poloxamer concentration (X2), and lecithin concentration (X3) were the independent variables. Y represents the dependent variables, including particle diameter immediately after preparation and after one week, span value, and drug loading percentage (DL%). Regression coefficients of intercept, linear, quadratic, and interaction of parameters were defined as (a0), (a1, a2, a3), (a11, a22, a33), and (a12, a13, a23), respectively. X1, X2, and X3 were main effects.
| Run Order | X1 | X2 | X3 | Y1 | Y2 | Y3 | Y4 |
|---|---|---|---|---|---|---|---|
| SLS Amount (MG) | Poloxamer Amount (MG) | Lecithin Amount (MG) | Size (nm) | Span Value | DL % | 1 Week Size | |
| 1 | 2 | 17.5 | 5.0 | 696 | 1.24 | 14.22 | 25812 |
| 2 | 2 | 17.5 | 30.0 | 74 | 0.70 | 13.79 | 75 |
| 3 | 2 | 5.0 | 17.5 | 74 | 0.70 | 14.81 | 75 |
| 4 | 12 | 5.0 | 17.5 | 924 | 1.92 | 14.63 | 12285 |
| 5 | 12 | 17.5 | 5.0 | 618 | 0.68 | 14.63 | 42621 |
| 6 | 7 | 5.0 | 5.0 | 74 | 0.72 | 15.26 | 15097 |
| 7 | 12 | 17.5 | 30.0 | 10521 | 1.47 | 13.67 | 4538 |
| 8 | 2 | 30.0 | 17.5 | 94 | 0.73 | 13.97 | 74 |
| 9 | 7 | 30.0 | 30.0 | 18345 | 2.43 | 13.37 | 12667 |
| 10 | 12 | 30.0 | 17.5 | 698 | 1.27 | 13.59 | 24439 |
| 11 | 7 | 5.0 | 30.0 | 577 | 1.65 | 14.33 | 18286 |
| 12 | 7 | 17.5 | 17.5 | 130 | 0.77 | 14.37 | 74712 |
| 13 | 7 | 17.5 | 17.5 | 107 | 0.76 | 14.40 | 74625 |
| 14 | 7 | 17.5 | 17.5 | 160 | 0.75 | 14.42 | 52045 |
| 15 | 7 | 30.0 | 5.0 | 74 | 0.72 | 14.19 | 684 |
3.5. Evaluation of Diameter and Size Distribution
The average volume diameter of particles and the span value were measured using a particle size analyzer (Wing SALD 2101, Shimadzu, Japan). The size distribution was determined based on the span value using Equation 2. A narrower size distribution indicates the homogeneity of the formulation and low dispersity of particles (20).
DN% showed that the volume percentage of particles less than DN% was N% (N = 10, 50, 90).
3.6. Particle Morphology
The morphology of the particles was examined using a Leo 906 transmission electron microscope (TEM), Carl Zeiss AG, at 100kv (Oberkochen, Germany). The optimal formulation was diluted 20-fold with deionized water and stained with 2% uranyl acetate. A drop of the suspension was placed onto a carbon-coated copper grid, allowed to dry, and then observed further (21).
3.7. Drug Loading and Entrapment Efficiency Calculation
Entrapment efficiency (EE)% and drug loading (DL) % were determined indirectly using the ultrafiltration method. An Amicon® ultrafiltration unit (30 kDa molecular weight cut-off membrane, Millipore, USA) was employed to separate the free drug. The SLN suspension was centrifuged for 10 minutes at 5000 rpm, and the filtrate was analyzed using UV–VIS spectrophotometry at 242 nm (22). Entrapment efficiency % and DL% were calculated using the following Equations 3 and 4 (22):
Where, Wi, Wf, and Ws represent the initial weight of drug added to formulation, weight of unloaded drug, and weight of total solid components, respectively.
3.8. Differential Scanning Calorimetry Analysis
The physical state of the formulation components was investigated using differential scanning calorimetry (DSC) (Shimadzu, Japan). Witepsol, AMI, GMS, lecithin, the physical mixture, and SLNs were examined. Samples were placed in aluminum pans using special pistons, heated at a rate of 10°C/min, and then scanned. The scanning temperature ranged from 25°C to 300°C.
3.9. Which Concentration of Surfactant Was Enough for the Preparation of SLNs?
Based on Martin's Physical Pharmacy and Pharmaceutical Sciences, the area per molecule of surfactants can be calculated (23). Therefore, the surface tension of the surfactant solution versus the logarithmic concentration of the surfactant should be plotted. The Du Nouy ring method was utilized to measure the surface tension at room temperature (25°C). Various concentrations of poloxamer and SLS were prepared in clean beakers. The immersed ring and liquid surface were maintained at a specific distance, and the force required to detach the ring was recorded. The platinum-iridium ring and beakers were cleaned with a solution of potassium chromate and sulfuric acid in water after each measurement (24). The total surface area of the SLNs can be estimated based on the volumetric diameter of the particles. Consequently, by dividing the total volume of the lipid phase by the volume of each particle, the number of particles was determined. The related equations are detailed in the Results section.
4. Results
4.1. Melting Point Determination of the Lipid Mixture
The lipid phase crucial for effective SLNs remains solid at body temperature. It was hypothesized that the addition of GMS (MP
4.2. Experimental Design
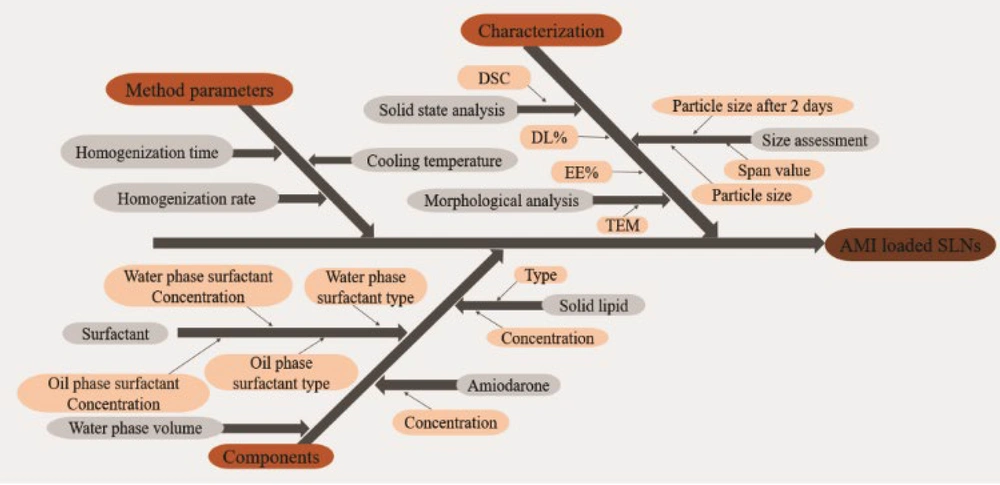
The Ishikawa diagram, shown in Figure 1, identified the CQAs for preparing SLNs. Evaluating potential process risks assists formulators in developing products with the desired characteristics efficiently and cost-effectively. According to the diagram, various risk parameters related to processes and components might influence the considered CQA. Particle size, span value, particle size stability over 2 days, and DL% were identified as CQAs for the development of SLNs.
4.2.1. Evaluation of Optimal Process Parameters by FFD
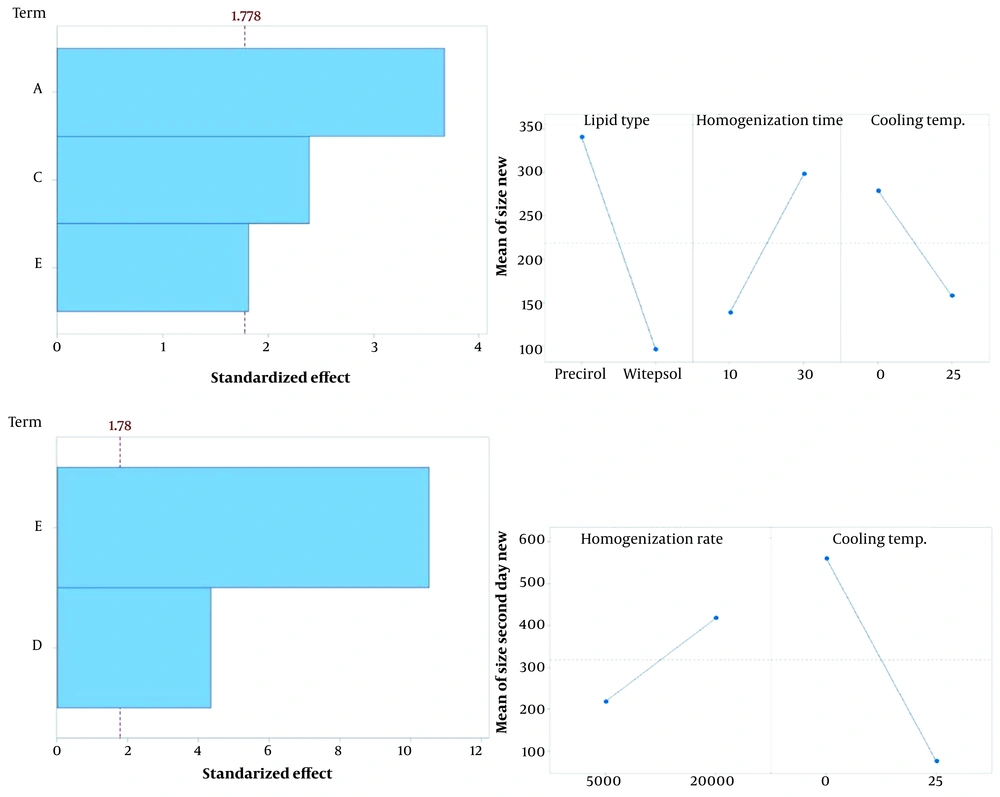
Given the numerous parameters involved in the fabrication of SLNs, employing two different designs to minimize the number of runs is recommended. The manufacturing process parameters were initially optimized using FFD to identify independent variables significantly influencing particle size. Fractional factorial design enables efficient resource use by reducing the number of test runs. The optimal preparation conditions identified through FFD were then applied for the remainder of the study. A Pareto chart of the parameters is shown in Figure 2 (left). According to the Pareto chart, the lipid type (A), homogenization time (C), and cooling temperature (E) significantly affected the particle size. The homogenization rate (D) and cooling temperature (E) were the primary factors for preparing stable SLNs. The main effect plot for the process parameters is depicted in Figure 2 (right), demonstrating that using Witepsol as the lipid base, homogenizing for ten minutes, and cooling at room temperature resulted in smaller particle sizes. Additionally, a lower homogenization rate yielded more stable SLNs. Therefore, a homogenization rate of 5000 rpm was selected.
Pareto charts (left) and main effects plot (right) of FFD are used to find the effective process variables. The upper is the size of the particles after preparation, and the bottom is the particle size after two days. (A), Lipid type;(B), surfactant type ;(C), homogenization time;(D), homogenization rate;(E), cooling temperature.
4.2.2. Evaluation of Optimal Surfactant Concentration by BBD
A three-level BBD of the response surface model was employed to determine the optimal concentration of surfactants. BBD is an efficient design for fitting second-order response surface models, enabling the generation of higher-order response surfaces with fewer runs by applying only 3 levels of factors. The designed formulations and their responses are outlined in Table 2. A p-value of less than 0.05 was considered significant. The BBD study identified the optimal formulation, which featured a smaller, stable particle size and span value, along with a higher DL%. The optimal formulation was number 3, consisting of 230 mg Witepsol, 25 mg GMS, 50 mg AMI, 2 mg SLS, 5 mg poloxamer, and 17.5 mg lecithin in a 10 ml aqueous phase, achieving an EE% of 97.58.
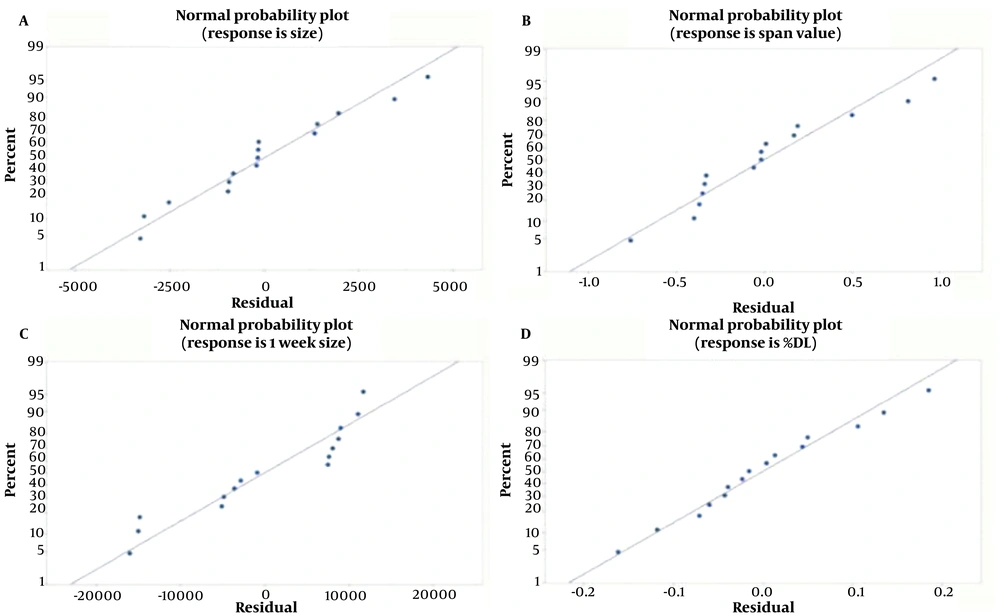
The results, detailed in Table 3, indicated that the quadratic model for size (P-value 0.012), DL% (P-value < 0.05), and one-week size (P-value 0.006) was significant, whereas it was not significant for the span value. The R2 value for size, DL%, and one-week size indicated a better correlation between dependent and independent variables compared to the span value. The model for each response highlighted the effects of independent variables and their interactions. A normal probability plot, shown in Figure 3, was used to assess the suitability of the model.
| Factors | Y1: Particle Size | Y2: Span Value | Y3: DL% | Y4: 1-Week Size | ||||
|---|---|---|---|---|---|---|---|---|
| Coefficient | P-Value | Coefficient | P-Value | Coefficient | P-Value | Coefficient | P-Value | |
| Model | - | 0.012 | - | 0.058 | - | 0.000 | - | 0.006 |
| a0 | 312 | - | 1.101 | - | 14.4165 | - | 67127 | - |
| X1 | 1478 | 0.190 | - | - | -0.0340 | 0.458 | 7231 | 0.157 |
| X2 | 2195 | 0.066 | - | - | -0.4883 | 0.000 | -985 | 0.837 |
| X3 | 3507 | 0.009 | 0.361 | 0.058 | -0.3943 | 0.000 | -6081 | 0.226 |
| - | - | - | - | -0.1808 | 0.022 | -25666 | 0.006 | |
| - | - | - | - | - | - | -32244 | 0.001 | |
| 3560 | 0.046 | - | - | -0.1435 | 0.055 | -23200 | 0.009 | |
| X1X2 | - | - | - | - | - | - | - | - |
| X1X3 | 2631 | 0.109 | - | - | -0.1335 | 0.062 | - | - |
| X2X3 | 4442 | 0.016 | - | - | - | - | - | - |
| Model R2 (%) | 81.89 | 24.87 | 96.57 | 85.20 | ||||
4.2.3. Effect of Variables on Responses (Y1-Y4)
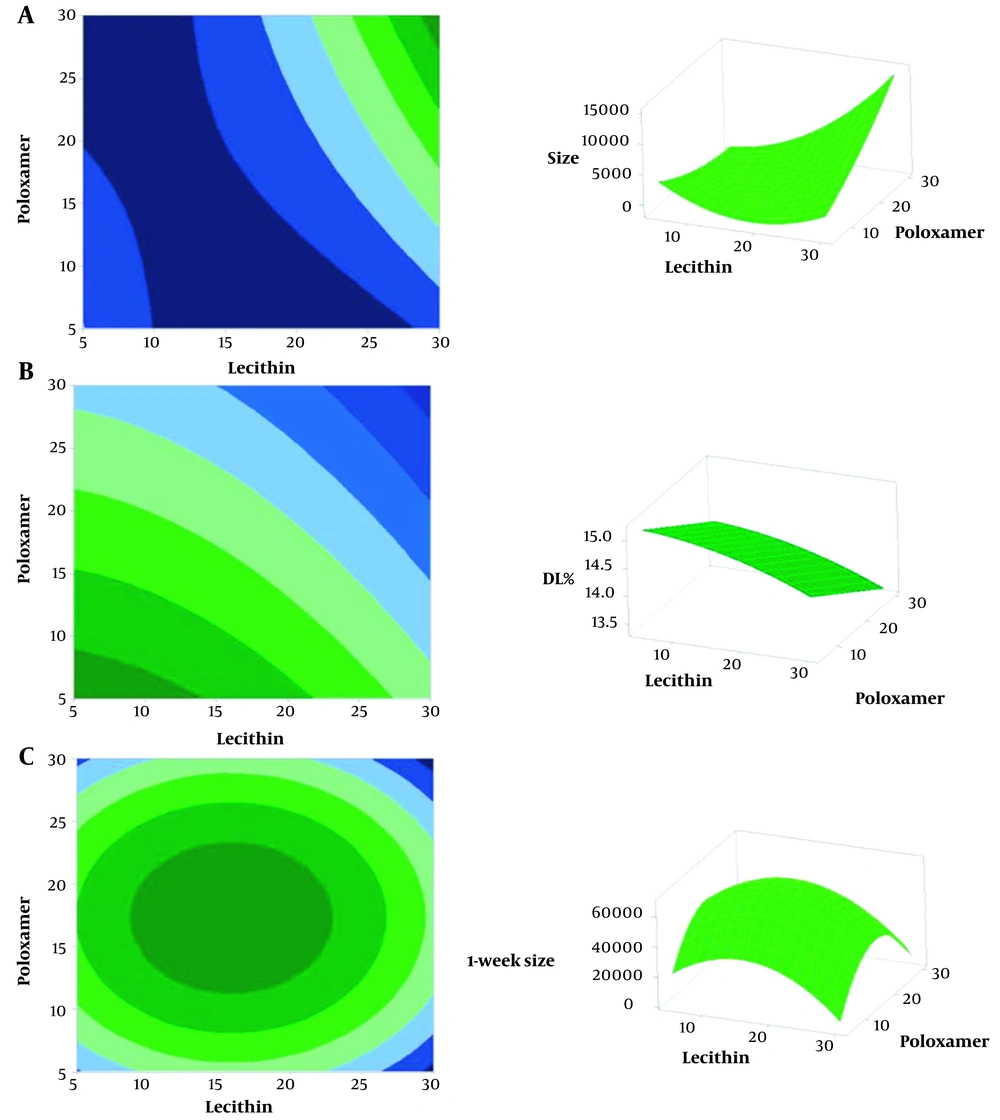
Table 4 presents the significant variables and their interactions. The correlation between particle size and independent variables was characterized by a regression coefficient of 81.89%, showing an inverse dependency on the concentrations of SLS, poloxamer, and lecithin. The contour plot demonstrated that increasing lecithin concentration initially led to a decrease in size, but beyond a certain point, it resulted in an increase in size, while a higher concentration of poloxamer led to smaller particles. This revealed that the span value was directly proportional to lecithin concentration, but the model was not sufficiently suitable for the span value. Hence, no contour or surface plot was generated for it. The polynomial equation showed that DL% increased as the concentration of poloxamer decreased and as the concentrations of SLS and lecithin increased, with a regression coefficient of 96.57%. The stability of the particles over time was assessed by measuring the particle size after one week, which had a regression coefficient of 85.20%. Figures 4 (A), (B), and (C) display the contour and surface plots for size, DL%, and one-week size, respectively, with SLS fixed at 7 mg.
| Responses | Equation |
|---|---|
| Particle size (Y1) | size=11101-441sls-322poloxamer-1309lecithin+22.78lecithin×lecithin+42.1sls×lecithin+28.43poloxamer×lecithin |
| Span value (Y2) | span value=0.595+0.0289lecithin |
| DL% (Y3) | DL%=14.802+0.1318sls-0.03907poloxamer+0.0156lecithin-0.00723sls×sls-0.000919lecithin×lecithin-0.002137sls×lecithin |
| 1-week size (Y4) | 1week size =-92078+15819sls+7144poloxamer+4710lecithin-1027sls×sls-206.4poloxamer×poloxamer-148.5lecithin×lecithin |
4.3. Particle Morphology
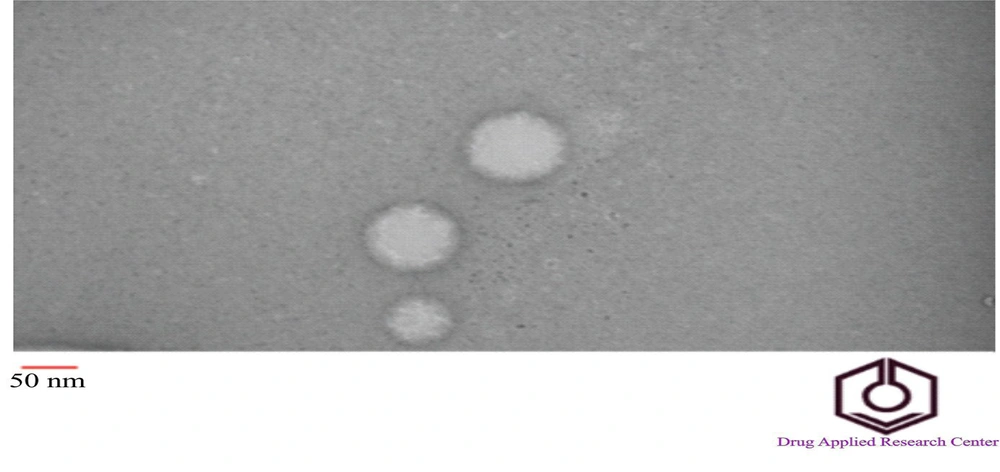
The morphology of the optimal formulation, as determined by BBD (formulation 3), was analyzed using TEM. Figure 5 shows that the particles were spherical and nanometer-sized. There was no observed aggregation of the particles. The average particle size measured by TEM was under 100 nm. Based on the TEM image and scale, the estimated particle diameter was approximately 90 nm, consistent with the results from the particle size analyzer.
4.4. Differential Scanning Calorimetry Analysis
Structural changes in the formulation components can be detected through heat exchange, which is reflected in the DSC thermogram. This thermogram demonstrates how melting (through heat absorption) or crystallization (through heat emission) occurs at specific temperature ranges, thereby determining the structural properties of the samples (25).
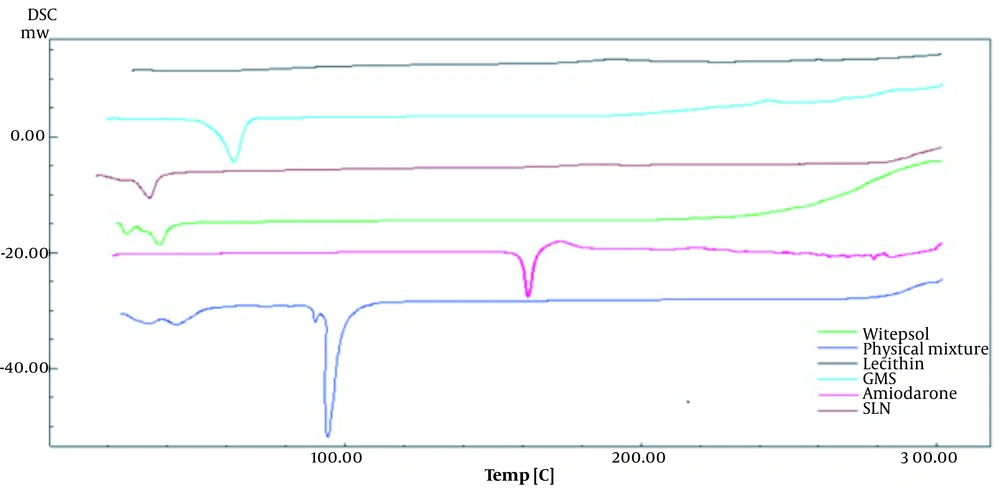
Figure 6 shows the thermogram of samples containing Witepsol, GMS, lecithin, AMI, a physical mixture of these components, and the optimal formulation of SLNs. The thermogram revealed that the sharp endothermic peak associated with AMI disappeared in the SLN preparation, indicating that AMI was completely dissolved in the lipid phase. Given that the endothermic peak of AMI occurs above 100°C, it was inferred that the AMI structure remained stable during the SLN preparation process (75°C). The presence of the endothermic peak of Witepsol in the SLNs confirmed the polymorphic form of the lipid, as Witepsol is a major component of the lipid phase. The endothermic peak of GMS was not observed in the SLN formulation. Previous studies have also noted that the sharp endothermic peak of AMI disappeared in the solid self-nanoemulsifying drug delivery system of AMI, indicating a transformation of the crystalline form of the drug upon incorporation into the system (26).
4.5. Which Concentration of Surfactant Was Enough for the Preparation of SLNs?
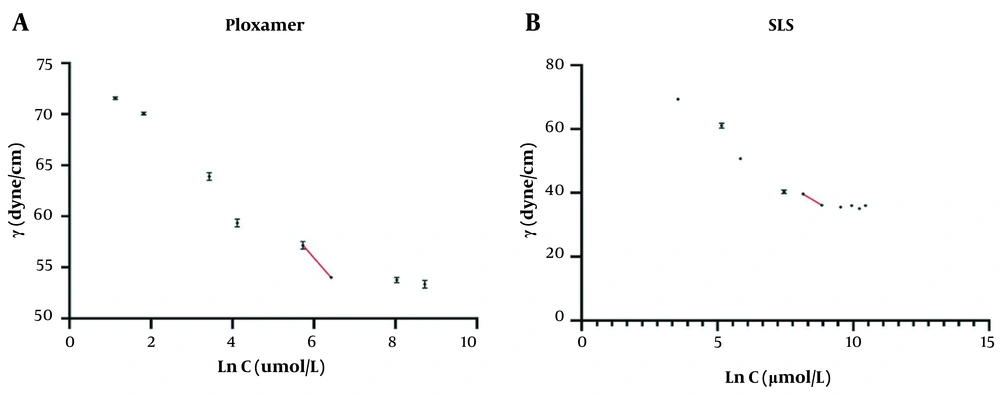
To identify the appropriate concentration of surfactants for the preparation of SLNs, the surface tension of poloxamer and SLS solutions against their logarithmic concentration was plotted, as shown in Figure 7. Following the principles outlined in Martin's Physical Pharmacy and Pharmaceutical Sciences, the surface excess (Γ), defined as "the amount of amphiphile per unit area of the surface in excess of that in the bulk of the liquid," was calculated using Equation 5 at a constant temperature (23).
The ratio of
Where Ss, ms, and Mw represent the area covered by a surfactant molecule, the total mass of the surfactant in the formulation, and the molecular weight of the surfactant, respectively. The total moles of poloxamer and SLS in the optimal formulation (number 3) were 30.82 and 6.93 μmol, respectively. Based on Equation 6, the total surface area that both surfactants could cover was calculated as follows:
Ss = surface covered by poloxamer + surface covered by SLS
Poloxamer and SLS could cover a total surface area of 20.12×104 cm2. Additionally, the total surface area of all particles needed to be estimated. The volume of each particle was calculated based on the volumetric diameter of the particles, as described in Equation 7.
Where St, np, Sp, Vl, Vp, ρl, ml, and d represent the total surface area of the particles, the number of particles, the surface area of one particle, the volume of the lipid phase, the volume of one particle, the density of the lipid phase, the mass of the lipid phase, and the volumetric diameter of the particles, respectively. Equation 8 illustrates that the total surface area of the particles is estimated by two factors: The volume of the lipid phase and the volumetric diameter of the particles. According to Equation 8, the total surface area for SLNs containing Witepsol and GMS as lipid components, with particles having a 74 nm volumetric diameter, was calculated to be:
Calculations showed that the total surface area for the amount of lipid used in the formulation was 21.72×104 cm2. Higher concentrations of surfactants often result in the formation of smaller particles, but it remains uncertain whether the resulting structure is a micelle or an SLN. Since the surfactants (SLS and poloxamer) would cover 20.12×104 cm2, the area occupied by surfactant molecules is less than the surface area of the lipids. Consequently, most molecules are likely situated on the surface of lipid particles to form the emulsion, leaving no free surfactant molecules to form micelle structures. Thus, all particles were SLNs. The remaining particle surface not covered by surfactants could be enveloped by the lipid phase surfactant, which has not been accounted for in this study. It would be beneficial to devise a method for assessing the surface area covered by surfactants in the lipid phase to obtain more precise estimations.
5. Discussion
The behavior of surfactants in aqueous solutions is dependent on concentration due to their lipophilic-hydrophilic structure; at low concentrations, molecules are adsorbed at the interface between the solution and air to minimize the energetic interaction between the nonpolar parts of the surfactant and water molecules. Once the surface is saturated, the molecules form self-aggregated structures known as micelles at the critical micelle concentration (CMC) point. After micelle formation, the surfactant no longer affects emulsion droplets. Therefore, the appropriate concentration of surfactants for the preparation of SLNs is below the CMC. Micelles have structural characteristics different from SLNs, and having only SLNs in formulations is preferred. Thus, determining the optimum concentration of surfactants is crucial, not only to avoid micelle formation but also because most synthetic surfactants are toxic (27). Schubert et al. observed that lecithin had a concentration-dependent effect on reducing particle size up to the CMC; beyond this point, no further size reduction occurred, as corroborated by the present study. Higher concentrations of lecithin led to the formation of liposomes due to the packing parameter of lecithin. Once all surfaces were covered, excess lecithin tended to form liposomes, which are slightly bent or planar systems (28). They also noted that particles were less stable at concentrations above the CMC. At lower concentrations, lecithin molecules were immobilized on the lipid matrix, but beyond the CMC, more free molecules moved and aggregated on the matrix surface, leading to an increase in size (29). The reduced size of particles in the presence of surfactant monomers was attributed to the adsorption of monomers onto particle surfaces.
When the surfactant concentration exceeded the critical micelle concentration (CMC), a smaller number of monomers were present. Consequently, the surface of the SLNs was not fully covered, rendering the particles unstable (30). Helgason et al. investigated the impact of surface coverage on the formation of nanoparticles in SLNs, concluding that the CMC plays a crucial role in the preparation of stable SLNs. Particle aggregation occurred at low surfactant concentrations due to insufficient coverage of the SLN surface (31). In a study by Raina et al., various surfactants were tested for particle preparation. The findings indicated that higher concentrations of Tween 80 and docusate sodium beyond the CMC resulted in low encapsulation efficiency (EE). The formation of micelles past the CMC point could explain the reduced EE% (32). Increased concentrations of poloxamer led to decreased EE, likely due to micelle formation once the lipid surfaces were fully saturated with surfactant molecules. Following micelle formation, micelles could not be separated by centrifugation for indirect EE% assessment. Thus, the supernatant contained both the drug within micelles and the unloaded drug, reducing the EE% at higher poloxamer concentrations (33). The melting point (MP) of Witepsol was lower than that of Precirol, indicating a higher energy transmission efficiency for Witepsol (8). It consists of mono-, di-, and triglycerides, creating imperfections in the lipid structure and spaces for drug loading. Conversely, highly crystalline lipids have a well-organized lattice with less space for drug loading (34). Another study highlighted the importance of optimal homogenization time for enhancing drug loading in SLNs. Prolonged homogenization times could remove surfactant molecules from the lipid particle surface due to applied energy, leading to the breakdown of exposed lipids in the water phase and the potential washing out of the drug from the lipid phase (35).
The findings indicated that Witepsol produced smaller particles. Previous research has suggested that there is an optimal duration for homogenization. Short homogenization times resulted in larger particles, possibly due to insufficient energy to break down the particles, leading to aggregation. Conversely, longer durations introduced excessive energy, causing particles to collide (36) Passive targeting is determined by the normal physiological process of distributing nanoparticles in the body. Particle size is a critical factor for passive targeting, influencing particle distribution; particles within the 50-200 nm range predominantly enter the circulatory system (37) Extended homogenization times produced larger particles. The optimal particle size in this study was 74 nm, suggesting that intravenous administration of these particles could result in passive targeting, allowing the particles to reach the blood circulation, which could be an area for future research.
5.1. Conclusions
In summary, AMI-loaded SLNs were successfully prepared using the hot homogenization technique. A dual DOE approach was utilized, where effective process parameters were identified through FFD, and surfactant concentrations were optimized using BBD. The optimal formulation, determined by the BBD results, was thoroughly characterized. A significant aspect of SLN preparation is the concentration of surfactants; hence, an equation for predicting the optimal surfactant concentration was developed. This equation demonstrated that surfactant molecules could sufficiently cover the surface of the particles, suggesting the absence of micelle structures in the formulation. Therefore, this equation could aid in determining the necessary concentration of surfactants in the aqueous phase for preparing SLNs. The derived equation focuses on evaluating the optimal concentration of aqueous phase surfactants. Given the crucial role of lipid-phase soluble surfactants in the formation of SLNs, this area warrants further investigation, and additional studies are needed to develop equations for predicting the required concentrations of lipid-phase surfactants.

