


1. Background
Edema is defined as the abnormal, excessive accumulation of fluid in the interstitial space. It can affect an entire limb, a specific organ, or be generalized throughout the body (1, 2). Several mechanisms can contribute to edema formation. It occurs when systemic or local fluid balance is disrupted, leading to an increase in plasma volume. Additionally, hypoalbuminemia and lymphatic obstruction can exacerbate edema (3). The prevalence of edema ranges from 5.0% to 66.1% depending on its definition and the patient’s medical condition (4).
The use of hypertonic saline increases intravascular fluid volume while reducing total infusion volume. This approach may be beneficial for edematous patients. Renal effects vary based on intravascular volume status, and shifts in osmolality and electrolytes typically return to baseline. Some evidence suggests that hypertonic saline reduces postoperative complications and mortality, although further clinical research is necessary (5).
The treatment of choice for patients with edema is diuretic therapy to manage water and salt retention (6, 7). Loop diuretics, such as furosemide, are the most potent class of diuretics and are widely used for treating edema and fluid overload, particularly in conditions such as chronic kidney disease, heart failure, and cirrhosis (8, 9).
Certain modalities can alter fluid balance and distribution, thereby enhancing diuretic efficacy. Recent studies suggest that adding hypertonic saline to high-dose furosemide may increase diuretic effectiveness in patients with advanced congestive heart failure (CHF), cancer, and refractory limb edema (10-13). In patients with heart failure, hypertonic saline has been shown to reduce body weight and may serve as a complementary therapy (8). By rapidly increasing the intravascular NaCl concentration, hypertonic saline causes an osmotic shift of fluid from the extravascular to the intravascular space (13, 14). Through the same mechanism, hypertonic saline is recommended for managing cerebral edema (15-17). Additionally, hypertonic saline improves renal blood flow and enhances the diuretic action of furosemide, particularly in elderly or dehydrated patients with renal impairment (12). Despite limited high-level evidence, the use of hypertonic saline in the intensive care unit (ICU) appears to be supported under controlled conditions (18).
This approach increases circulating volume while reducing the total infusion volume, offering potential benefits in edematous ICU patients by improving intravascular volume status. Consequently, hypertonic saline may have favorable effects in critically ill patients, provided it is used cautiously and supported by further studies (5, 19).
Although hypertonic saline has been widely studied for treating hyponatremia and cerebral edema in critically ill ICU patients, its role in reducing peripheral edema has not yet been clearly evaluated (20-22).
2. Objectives
Therefore, the present study was designed to assess the effect of adding 5% NaCl solution to loop diuretics on urine volume and edema management in critically ill ICU patients with acquired peripheral edema.
3. Methods
3.1. Population
This study was designed as a two-arm, parallel-group, randomized, open-label clinical trial with blinded outcome assessment. It was conducted from February 2020 to December 2020 in the ICU of Emam Hossein Medical Center, affiliated with Shahid Beheshti University of Medical Sciences, Tehran, Iran. Hospitalized adult patients with 2+ edema or greater were included in the study using a convenience sampling technique.
3.2. Study Objectives
The primary objective of this study was to determine whether hypertonic saline therapy reduces generalized edema in critically ill patients. The secondary objective was to assess the effect of adding hypertonic saline to furosemide on the urinary volume of these patients.
3.3. Exclusion Criteria
In this study, patients with the following conditions were excluded: Serum sodium level greater than 155 mEq/L, undergoing hemodialysis, serum albumin level less than 2 mg/dL, serum creatinine equal to or greater than 1.5 mg/dL, blood pressure dependent on norepinephrine, or blood pressure greater than 180/100 mmHg.
3.4. Study Protocol
3.4.1. Study Setting and Participation and Data Collection
This protocol manuscript was written based on the SPIRIT guidelines. All patients were evaluated according to the defined inclusion and exclusion criteria. Edema assessments before recruitment and during follow-up were conducted by an intensivist who was blinded to the study groups. Eligible patients were included in the study, and all demographic and clinical characteristics — including age, sex, vital signs, blood pressure, and relevant laboratory results such as serum sodium, serum albumin, and serum creatinine — were recorded. Clinical evaluations such as edema grading and urine output were also documented using a researcher-developed checklist.
To assess the severity of illness, the Acute Physiology and Chronic Health Evaluation II (APACHE II) score was calculated for all patients within 24 hours of ICU admission. Mean Arterial Pressure (MAP) was calculated based on systolic and diastolic blood pressure at the time of ICU admission using the formula:
To evaluate the extent of pitting edema, physical examinations were performed by an intensivist at the time of admission and again at 48 hours, using a 1 to 4 scale.
3.4.2. Randomization and Blinding
Patients were randomly allocated in a 1:1 ratio to either the control or intervention group. Concealed random allocation was performed using a simple randomization method. A series of random numbers were generated and randomly assigned to the groups using the RND, RANK, and ROUNDUP functions in Excel software. Investigators who assessed the primary and secondary outcomes were blinded to the treatment allocation.
3.4.3. Trial Intervention
Patients in the intervention group (group A) received 20 mg of furosemide plus 50 mL of hypertonic saline, infused over 30 minutes, three times daily. Subjects in the control arm of the study (group B) received 20 mg of furosemide plus 50 mL of normal saline, infused over 30 minutes, three times daily. Since the starting dose of furosemide for the treatment of peripheral edema is 20 mg in numerous studies, this dose was chosen as the fixed dose in both the control and intervention groups (23, 24). Because patients with decompensated heart failure and fluid overload should not start diuretics at a dose higher than 20 - 40 mg, this dosage was selected. Patients received the treatment regimen for 48 hours. The patients’ urine volume and edema were assessed daily for up to two days after the intervention. Blood pressure and creatinine levels were also checked daily.
3.4.4. Sample Size Calculation
Considering the difference in urine volume between the two groups of 450 mL, a standard deviation of 390 mL based on the study by Paterna et al. (14), a power of 88%, and a type I error (alpha) of 0.05, the required sample size was calculated to be 13 subjects in each group. By accounting for a 10% probability of subject attrition, 14 subjects were included in each group. This calculation was performed using MiniTab software.
3.4.5. Statistics Statistical Analysis
In this study, quantitative variables were described using mean ± standard deviation (SD) or median and interquartile range (IQR), while categorical variables were presented as frequency and percentage. The Shapiro-Wilk test and histogram curves were used to assess the normality of continuous variables. For comparisons of means between two groups, the independent t-test was used for normally distributed data, and the Mann-Whitney U test was applied for non-normally distributed data.
Parametric and non-parametric tests, such as the chi-square test and Fisher’s exact test, were employed to compare categorical variables between groups. To compare values before and after the intervention, the paired t-test or Wilcoxon signed-rank test was used based on the normality of the data.
Additionally, due to the non-normal distribution of urine output values, the non-parametric repeated measures Friedman test was used to examine changes in urine output during the study. A two-sided P-value of < 0.05 was considered statistically significant. All statistical analyses were performed using STATA version 14.
4. Results
Thirty-two subjects with edema were evaluated, and 28 (20 women and 8 men) completed the study. Figure 1 presents the consolidated standards of reporting trials (CONSORT) flowchart for this study.
 flow diagram")
Consolidated standards of reporting trials (CONSORT) flow diagram
There were no statistically significant differences in the baseline characteristics of the subjects, including age, sodium, albumin, APACHE II score (Table 1), serum creatinine, systolic and diastolic blood pressure, mean arterial pressure, and edema between the two arms of the study (Table 2).
| Variables | Intervention (n = 14) | Control (n = 14) | Total (%) | P-Value |
|---|---|---|---|---|
| Gender | 0.678 | |||
| Female | 11 (78.57) | 9 (64.29) | 20 (71.34) | |
| Male | 3 (21.43) | 5 (35.71) | 8 (28.57) | |
| Age | 69 (64 -73) | 70.5 (62 -75) | 70 (63 - 74) | 0.519 |
| APACHE II Score | 17.64 ± 4.10 | 17.28 ± 5.81 | 17.46 ± 4.94 | 0.852 |
| Na (mEq/L) | 140.42 ± 5.13 | 137.21 ± 4.59 | 138.82 ± 5.05 | 0.092 |
| Albumin (g/dL) | 2.37 ± 0.38 | 2.4 ± 0.47 | 2.38 ± 0.42 | 0.863 |
a Values are expressed as frequency (%), mean ± standard deviation or median (Q1 - Q3).
| Variables | Before (Baseline) | After (48 Hours) | P- Value c | ||||
|---|---|---|---|---|---|---|---|
| Intervention (n = 14) | Control (n = 14) | P- Value b | Intervention (n = 14) | Control (n = 14) | P-Value b | ||
| Serum creatinine (mg/dL) | 0.9 (0.7 - 1.2) | 1.05 (0.7 - 1.7) | 0.473 | 0.95 (0.7 - 1.5) | 1.3 (0.8-1.6) | 0.542 | 0.251 |
| Systolic blood pressure (mmHg) | 129 ± 17.13 | 116.5 ± 20.82 | 0.095 | 115 (100 - 140) | 115 (100-130) | 0.673 | 0.431 |
| Diastolic blood pressure (mmHg) | 76.92 ± 9.94 | 71.42 ± 10.45 | 0.166 | 74 ± 11.47 | 70.64 ± 9.82 | 0.413 | 0.271 |
| Mean arterial pressure (mmHg) | 95.21 ± 11.54 | 87.63 ± 12.62 | 0.110 | 89.58 ± 14.01 | 86.11 ± 12.81 | 0.499 | 0.176 |
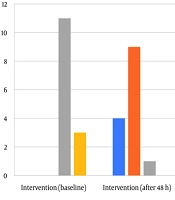
| Edema grade (mm) | 0.109 | 0.838 | < 0.001 | ||||
| 1+ | 0 (0.00) | 0 (0.00) | 4 (28.57) | 6 (42.86) | |||
| 2+ | 0 (0.00) | 4 (28.57) | 9 (64.29) | 7 (50.00) | |||
| 3+ | 11 (78.57) | 9 (64.29) | 1 (7.14) | 1 (7.14) | |||
| 4+ | 3 (21.43) | 1 (7.14) | 0 (0.00) | 0 (0.00) | |||
a Values are expressed as frequency (%), mean ± standard deviation or median (Q1 - Q3).
b Based on t-test or Mann-Whitney and Fisher’s exact tests.
c Comparing values before and after of intervention based on paired t-test or Wilcoxon test.
Two days after the intervention, serum creatinine, systolic and diastolic blood pressure, mean arterial pressure, and edema did not differ significantly between the two groups. However, edema significantly decreased in both groups after the intervention compared to baseline (P < 0.001) (Table 2 and Figure 2).

Edema Scale based on grade pitting edema in both groups at baseline and after 48 hours of treatment
According to the results in Table 3, the median baseline urine volumes were 2025 (1200 - 3300) mL in the intervention group and 1550 (1200 - 4300) mL in the control group. There was no significant difference between the control and intervention groups in baseline urine volume (P = 0.720). Overall, the changes in urine volume from baseline to 48 hours after the intervention were significant in both groups. Specifically, at 24 and 48 hours after the intervention, urine volume increased significantly in both groups compared to baseline (P < 0.001). However, the difference in urine output between the two groups at 24 and 48 hours after the intervention did not reach a significant level (Table 3). Additionally, the amount of change in urine volume was not significantly different between the two groups (Table 3).
| Urine Volume (mL) | Intervention | Control | P-Value b | Total | Friedman Test Results c |
|---|---|---|---|---|---|
| Baseline | 2025 (1200 - 3300) | 1550 (1200 - 4300) | 0.720 | 1782.50 (1200 - 3300) | χ2 = 15.500; df = 2; P < 0.001 |
| 24h after intervention | 5075 (1400 - 5500) | 3900 (2700 - 5200) | 0.872 | 4775 (2275 - 5475) | |
| 48h after intervention | 3600 (1550 - 5600) | 4450 (3400 - 4850) | 0.783 | 4050 (2262.50 - 5300) | |
| Urine output baseline - 24h d | -1642.85 ± 380.89 | -1523.92 ± 375.45 | 0.825 | -1583.39 ± 1389.89 | - |
| Urine output baseline - 48h d | -1500 ± 498.18 | -1470.35 ± 455.30 | 0.965 | -1485.17 ± 1752.30 | - |
a Values are expressed as frequency (%), mean ± standard deviation or median (Q1 - Q3).
b Based on Mann-Whitney test or t-test.
c Based on non-parametric repeated measure Friedman’s test.
d Comparing intervention and control groups based on the difference of urine volume before and after of intervention.
5. Discussion
In this randomized clinical trial, we aimed to evaluate the effect of adding hypertonic saline to furosemide on edema and urine volume in ICU-admitted patients. Theoretically, hypertonic saline solution combined with furosemide may overcome patients’ resistance to diuretics and be more effective in reducing edema.
To the best of our knowledge, this is the first study to evaluate the effect of adding hypertonic saline to furosemide for edema management in critically ill patients. The synergistic effect of this combination has been studied previously in patients with heart failure, foot edema in cancer patients, cerebral edema, and ascites (9, 12-17, 25, 26). In one study, Mercadante et al. found that a combination of 60 mEq NaCl with 250 mg of furosemide might be an effective strategy for treating peripheral edema in patients with advanced cancer (12). In contrast to Mercadante’s findings, we did not detect any significant difference between the two study arms, which may be due to the lower dose of furosemide (i.e., 20 mg) used in our study.
The sample size of the present study, based on the article by Paterna et al. in 2015, was 28 patients (14 in each group). The method followed that of Mercadante et al. in 2009, in which one group received 50 mL of hypertonic saline and 20 mg of furosemide TDS, while the second group received 50 mL of normal saline and 20 mg of furosemide TDS (12, 14). After conducting the study and reviewing the results, we observed that urine volume increased in both groups compared to baseline. However, unlike other studies, we did not observe a synergistic effect of furosemide combined with hypertonic saline in ICU patients with edema.
A combination of 150 mL hypertonic saline with 500 - 1000 mg of furosemide was found effective for treating edema in heart failure patients in studies by Paterna et al. and Licata et al. (10, 27). In contrast, we used a total dose of 60 mg/day of furosemide for two days and, unlike the findings of Paterna et al. and Licata et al. (10, 27), could not detect any significant difference between the two groups.
According to studies conducted in 2000, patients were prescribed 20 - 40 mg of potassium during the study to prevent hypokalemia. In our study, serum sodium levels increased in the hypertonic saline group, uric acid levels increased in both groups, and serum creatinine increased in the group receiving furosemide alone (27). In a 2003 study, both groups received 20 - 40 mg of IV KCl to prevent hypokalemia. Potassium levels decreased in both groups, sodium increased in the hypertonic saline group but decreased in the other, and uric acid levels increased in both (10). In a study by Tuttolomondo et al. and Paterna et al. in 2011, serum sodium levels increased in the hypertonic saline group (26, 28). A 2013 study reported decreased serum creatinine levels in the hypertonic saline group (25). According to our data analysis, we did not observe any adverse effects in terms of sodium, blood pressure, or serum creatinine changes, and the differences were not statistically significant.
It is well known that diuretic resistance poses a major challenge in heart failure treatment. The underlying pathophysiology is likely multifactorial, including renal impairment, pharmacokinetic/pharmacodynamic alterations of diuretics, hormonal dysregulation, and cardiorenal syndrome. The typical therapeutic response involves increasing the diuretic dose (29, 30). For this reason, the furosemide doses used in heart failure patients are higher than in our study. Additionally, at the time of designing the present study, no similar research had been conducted on ICU patients with edema. Our results revealed that critically ill patients with edema respond well to low-dose diuretics, and there may be no need for dose escalation in the absence of heart failure.
5.1. Limitations and Recommendations
Among the limitations of this study are the small sample size, the single-center design, and the limited dosage of diuretics and hypertonic saline. Therefore, it is recommended that future studies be conducted with larger sample sizes, in multiple centers, and with higher doses of furosemide and hypertonic saline to better assess potential synergistic effects.
5.2. Conclusions
The results of this study showed that critically ill patients with edema respond well to diuretic treatment. However, adding hypertonic saline to loop diuretics did not demonstrate a synergistic effect in critically ill patients with generalized edema.
