


1. Background
The medicinal properties of ciplukan (Physalis angulata L.) have been widely studied for their anti-inflammatory, immunomodulatory, antibacterial, anticancer, and antifibrotic properties (1). A more thorough study by Rohmawaty et al. (2) demonstrated that the 70% ethanol extract of ciplukan, fractionated into ethyl acetate, exhibited a significant anti-fibrosis effect, with therapeutic doses starting from 2.22 mg to lower serum alanine aminotransferase levels in rats (2). This indicates that the 70% ethanol extract of ciplukan has great potential for development into standardized herbal medicines or even phytopharmaceuticals. If developed, it could be conveniently available as a solid dosage form, such as a capsule. Similar to other pharmaceutical preparations, quality capsules must ensure homogeneity in active ingredient content, ease of production, and effective disintegration in the digestive tract. To achieve this, specific excipients are required according to their function.
The general challenge in scaling up herbal formulations from the laboratory to industrial production is that larger quantities with different energy strengths can affect quality. Therefore, a method to ensure that critical quality attributes (CQA) are maintained is necessary. Formulation development should lead to quality by design, necessitating the study of the effect of excipient function and composition variation on the expected quality response (2, 3). Among formulation designs, the two-level factorial design is frequently used due to its adequate yield precision. In a two-level factorial design, only two main points of the independent variable (lowest and highest) are tested to understand how each factor influences the dependent variable and how these factors interact, allowing for concise conclusions (3-5).
Recommendations for good quality design formulations developed in the laboratory may change when scaled up in industries with different facilities. Therefore, it is necessary to test the similarity of critical quality attributes between the two products. The criteria chosen to compare product quality from both facilities, which are most critical and affect dose homogeneity and bioavailability, are loss on drying (LOD), flowability, and disintegration time. These parameters will be fixed variables checked for similarity. Similarity is calculated using the Jaccard similarity index formula, which is based on a comparison between the intersections of the two data groups and their union (6). The Jaccard similarity coefficient measures the similarity between sample sets. It is the ratio between the intersection size and the union size of the sample set. The Jaccard Similarity Index method was chosen because it is simple to calculate, unaffected by the size of the data set, reliable for determining similarity when sets have different sizes, and can be used to compare the similarity of any type of data (7).
2. Objectives
This article will facilitate the handling of traditional medical goods derived from extracts in accordance with regulatory requirements, which have been challenging to achieve process validation, particularly during the transition from laboratory to production scale.
3. Methods
3.1. Materials
The entire Physalis angulata Linn., excluding the radix component, was collected from various regions in West Java, Indonesia, between December 2019 and February 2020. The Department of Biology, Faculty of Mathematics and Natural Sciences, Universitas Padjadjaran assessed the harvest samples. Excipients for formulation, such as colloidal silicon dioxide, microcrystalline cellulose pH 102, lactose, benzoic acid, starch glycolate salt, and capsule size no. 1, were purchased from Bratachem, Inc. Reagents, including aluminum chloride, sodium acetate, quercetin, and solvents such as acetone, ethanol, and toluene, were purchased from Sigma-Aldrich (Merck) with grade analysis.
3.2. Preparation of Physalis angulata Linn. Ethanol Extract
The extraction method used was cold maceration, which involved stirring a solvent multiple times at room temperature. Ciplukan herbs (excluding roots) were suspended in 70% ethanol for 3 × 24 hours. A rotary vacuum evaporator was used to concentrate the filtrate.
3.3. Extract Standardization
To evaluate quality, standardization was conducted using evaluations from the Indonesian herbal pharmacopoeia, including organoleptic properties, total ash content, acid-insoluble ash content, water-soluble extract content, ethanol-soluble extract content, and drying shrinkage (8, 9). Analyzing these indicators provides a general idea of the overall chemical component content in a herbal material.
3.4. Thin-layer Chromatography Analysis of Treatment Outcomes
Using a toluene-acetone-acetic acid (6:6:0.05) solution, a mixture containing the temperature and pH test results and controls was prepared and spread over silica gel F254 on the thin-layer chromatography (TLC) plate, then eluted. The test solution was prepared by combining an extract solution with a concentration of 15% in 70% ethanol and a quercetin solution as a reference with a concentration of 0.3% in 96% ethanol. The TLC plate was removed and allowed to dry naturally. It was then examined under UV light at 254 and 366 nm. To determine the Rf value, the areas were sprayed with LP citronella detection, heated at 100°C for 5 - 10 minutes, and then evaluated again under 366 nm UV light.
3.5. Flavonoid Total Content as Quercetin
The test was conducted by weighing 10 - 20 capsules, each equivalent to 0.2 grams of extract. The test solution was prepared by diluting the sample in 25 mL of alcohol and extracting it for 1 hour using a magnetic stirrer. The solution was then filtered into a 25 mL volumetric flask, and the filter paper was rinsed with ethanol P, with ethanol P added up to the mark. The reference solution was obtained by diluting 10 mg of quercetin in a 25 mL volumetric flask with ethanol P and further diluting to concentrations of 80, 75, 60, 50, and 40 ppm. The concentration was determined by pipetting 0.5 mL of the test solution, followed by the addition of 2.8 mL of water, 0.1 mL aluminum chloride (10%), 0.1 mL sodium acetate (1 M), and 1.5 mL of ethanol P. After shaking, the solution was allowed to stand at room temperature for 30 minutes. Blank solutions were prepared in the same manner, excluding the addition of aluminum chloride or the test solution. The solution was analyzed at a maximum absorption wavelength of 425 nm. The terms of acceptance require the level of active ingredients to be within the range of 90 - 110% of the label statement (10).
3.6. Formulation by Two Levels Factorial Design
Formulation optimization was performed using a two-level factorial design with three replications as input factors in experiments using Design Expert version 11. Colloidal silicon dioxide was used as an adsorbent dryer with values ranging from 3% (low) to 10% (high), and starch glycolate salt was used as a disintegrator with values ranging from 2% (low) to 8% (high). Excipient variations were based on the ability of these materials, commonly used in granulation, to enhance the flowability and compressibility of granules as well as their dispersing ability. The number of variations was adjusted according to the handbook of pharmaceutical excipients. The three types of responses included were LOD, flow rate (g/s), and disintegration time (s). The recommendations from the two-level factorial design resulted in four formulas that were tested for response in three repetitions (Tables 1 and 2).
| Ingredients | Amount/Caps (mg) | Annotation | |||
|---|---|---|---|---|---|
| F1 | F2 | F3 | F4 | ||
| 1. Ciplukan extract | 125.0 | 125.0 | 125.0 | 125.0 | Active compound |
| 2. Microcrystalline cellulose | 57.8 | 57.8 | 57.8 | 57.8 | Binder, adsorbent |
| 3. Colloidal silicon dioxide | 12.5 | 12.5 | 3.8 | 3.8 | Adsorbent |
| Ingredients | Amount/Caps (mg) | Annotation | |||
|---|---|---|---|---|---|
| F1 | F2 | F3 | F4 | ||
| 1. Extract Powder | 190.0 | 196.5 | 190.4 | 196.7 | Active compound |
| 2. Na. starch glycolate | 5.8 | 5.8 | 23.2 | 23.2 | Disintegrant |
| 3. Benzoic acid | 0.029 | 0.029 | 0.029 | 0.029 | Preservative |
| 4. Lactose | Ad 290 | Filler | |||
3.7. Similarity Study Between Capsule Products
Jaccard similarity is used for its convenience; the concept involves directly comparing the intersection of two data groups with their union. The Jaccard similarity equation is presented as follows.
This equation determines the level of similarity between the two variables tested (11).
3.8. Evaluation of Granules and Capsules
The resulting granules were evaluated for LOD, flowability, angle of repose, capsule weight uniformity, and disintegration time of the capsules. The LOD was calculated by determining the water content of the extract using 10 g of granules heated at 70 - 80°C. The LOD requirement was 2 - 5%.
3.8.1. Flowability and Angle of Repose
The diameter and height of the granule cone were measured using a flow tester with 25 g of granules flowing through the funnel. The flow rate and angle of repose were calculated using the following formula:
The values of the acceptance requirements can be seen in Tables 3 and 4.
| Flow Rate (g/s) | Means |
|---|---|
| > 10 | Free flowing |
| 4 - 10 | Easy flowing |
| 1.6 - 4 | Cohesive |
| < 1.6 | Very cohesive |
| Angle of Repose | Means |
|---|---|
| 25 - 30 | Excellent |
| 31 - 35 | Good |
| 36 - 40 | Fair |
| 41 - 45 | Poor |
| 46 - 55 | Poor |
| 56 - 65 | Very poor |
| > 66 | Extremely poor (cohesive) |
3.8.2. Capsule Weight Uniformity
Weight homogeneity was assessed by individually weighing 20 capsules, then removing their contents and weighing the empty capsule shells. The total weight of the capsule contents was calculated, and the average weight of each capsule's contents was determined. The percentage difference in the weight of the contents of each capsule compared to the average weight cannot exceed the limits specified in column "A," and for every 2 capsules, it cannot exceed the limits specified in column "B" (8, 9).
The values of the acceptance requirements can be seen in Table 5.
| Capsules Weight Average | Differences Between Capsules (%) | |
|---|---|---|
| A | B | |
| ≤ 120 mg | 10 | 20 |
| ≥ 120 mg | 7.5 | 15 |
3.8.3. Disintegration Time Test
The disintegration time test was conducted using a disintegration tester by placing six capsules into each tube in a basket, beneath which was 10 mesh steel gauze, with an aqueous medium maintained at 37 ± 2°C. The requirement for capsule disintegration time is that all capsules must disintegrate, except for a part of the capsule shell. If one or two capsules do not completely disintegrate, the test should be repeated with another 12 capsules; at least 16 of the 18 tested capsules must be completely disintegrated. The capsule disintegration time should not exceed 15 minutes.
4. Results and Discussion
The yield of the ciplukan herb extract from the maceration method in 70% ethanol was 11.75%. The extract was obtained and examined for the suitability of the extract parameters based on the Republic of Indonesia herbal pharmacopoeia, and the results met the requirements (Table 6). Qualitative and quantitative tests were conducted on several total flavonoids to determine the content responsible for the therapeutic effect. Qualitative testing was performed using TLC with the standard flavonoid quercetin, as shown in Figure 1. The image shows that the stain results from the test sample (extract) and the working reference (quercetin) are at the same Rf of 0.467, indicating that the extract contained a sufficient amount of flavonoids, similar to quercetin. For quantitative testing, according to the herbal pharmacopoeia guidelines, the total flavonoid content was determined for finished products (both laboratory and pilot-scale results from industrial partners) using the AlCl3 reagent, and it was found that conformity to acceptance requirements was in the range of 90 - 110% (Figures 2 and 3).
| Evaluated Parameter of Extract | Physalis angulata Linn. Herbs b | Physalis minimae Leaves (from FHI) c |
|---|---|---|
| Specific parameters | ||
| Organoleptic | ||
| Water soluble extract content | 27.70 | > 8.10 |
| Ethanol soluble extract content | 7.21 | > 2.80 |
| Total flavonoid content (with quercetin as standard) | 0.82 | > 0.58 |
| Physalin A | 0.97 | - |
| Withanolid A | 0.31 | - |
| Gallic acid | 0.26 | - |
| Saponin | 2.58 | - |
| Non-specific parameters | ||
| Density of ethanol extract | 1.02 | - |
| Water content | 10.00 | < 10 |
| Loss on drying | 9.53 | < 10 |
| Total ash content | 17.14 | - |
| Acid insoluble ash content | 4.83 | - |
| Extract rendement | 13.70 | > 9.6 |
a Values are expressed as %.
b Dark greenish brown viscous extract, very thick, smells of extract.
c Extract thick, dark brown, and bitter taste.
 profile with the standard flavonoid quercetin in visible light (A); UV 254 nm (B); and UV 366 nm (C). Q: Quercetin; S: Sample.")
The thin layer chromatography (TLC) profile with the standard flavonoid quercetin in visible light (A); UV 254 nm (B); and UV 366 nm (C). Q: Quercetin; S: Sample.

The angle of repose results from each formula

The total flavonoid contents between finished products
Therefore, extracts that satisfy these requirements can be used for capsule preparation. A two-level factorial experimental design was employed for the laboratory development of capsule formulations. The input variables included variations in the composition of colloidal silicon dioxide as an adsorbent for the dried thick extract (Table 1) and starch glycolate salt as a disintegrant within the capsules (Table 2). The response to this variability was assessed by evaluating the quality of LOD, flowability, angle of repose, compressibility, and disintegration time. All parameters, except for the angle of repose, were entered into the Design Expert version 11 software, which recommended performing four variations of this formula. The optimization results provided a mathematical equation regarding the influence of composition variations on each response, where the P-value for assessing the overall quantitative flowability was fulfilled, while the angle of repose served as a qualitative assessment influencing it.
The disintegration time responses are < 0.05, except for the LOD response, which is > 0.05 (Tables 7 and 8). This indicates that compositional variations do not affect LOD, whereas the other responses were strongly influenced by variations in the two excipients. This can be observed in the contour plots, where the color for LOD does not differ, whereas for the other responses, there is a color shift. The difference in color indicates that the red color of the response is stronger, while the blue color indicates a lower response value. The statistical recommendations from the experimental design software yielded F4 (composition of 3% colloidal silicon dioxide and 2% glycolate starch salt) with a desirability value of 0.686. It can be seen that F4 tends to be closer to the red color for both responses (flowability and disintegration time) than the other formulas (Figure 4).
| Excipient | Flowability (g/s) | LOD (%) | Disintegration Time (s) |
|---|---|---|---|
| 1. Colloidal silicon dioxide | 38.98 | 0.2133 | 92.96 |
| 2. Na. starch glycolate | 9.21 | 0.0001 | 53.34 |
| 3. Premix of colloidal silicon dioxide-Na. starch glycolate a | 0.65 | 0.0481 | 257.61 |
Abbreviation: LOD, loss on drying.
a P-value > 0.05.
| Excipient | Flowability | LOD | Disintegration Time |
|---|---|---|---|
| 1. Model | 0.0018 | 0.4856 | 0.0002 |
| 2. Colloidal silicon dioxide | 0.0005 | 0.1777 | 0.0031 |
| 3. Na. starch glycolate | 0.0255 | 0.9714 | 0.0132 |
| 4. Premix of colloidal silicon dioxide-Na. starch glycolate a | 0.4877 | 0.5026 | 0.0001 |
Abbreviation: LOD, loss on drying.
a P-value > 0.05.
 and B-Na. starch glycolate (P) where are the equations for: Loss on drying (LOD) = 0.946032 - 0.007937A + 0.040317P - 0.006032AP; flowability = 13.24651 - 0.404148A - 0.147912P - 0.022163AP; and disintegration time = 94.06111 - 1.41111A - 3.57103P + 0.441270AP")
The contour plots of each excipient contribute to quality responses with A-coloidal silicon dioxide (A) and B-Na. starch glycolate (P) where are the equations for: Loss on drying (LOD) = 0.946032 - 0.007937A + 0.040317P - 0.006032AP; flowability = 13.24651 - 0.404148A - 0.147912P - 0.022163AP; and disintegration time = 94.06111 - 1.41111A - 3.57103P + 0.441270AP
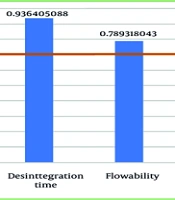
Considering the results of formulation development and the availability of ingredients in the partner pharmaceutical industry, there are changes in excipients, as shown in Table 9. The difference in the use of these excipients resulted in a variation in the final weight of the capsules between the two different facilities. Thus, ensuring similarity in quality becomes more critical due to these differences. From a quality comparison with pilot-scale products, the closeness of quality results is seen in F3 and F4, with the Jaccard similarity index showing a similarity value of 0.88 (Figure 5), indicating that capsules from the laboratory and pilot scales have a fairly good resemblance. This suggests that the variation in the usage of excipients between the two facilities is not significant, and the composition of the formula from partner industries can be produced in larger batches. The dissimilarities in LOD may occur due to environmental factors, excipients, and measurement instruments used in the two locations, but for herbal preparations, this small difference in drying decimation does not have a major impact on overall quality. The quality of microbial contamination of the capsules from both products (laboratory and pilot scale) was also examined, as shown in Table 10, by calculating the average total plate number of 7.07 × 10⁴, which is still in line with the Indonesian Food and Drug Administration (FDA) requirements of 107 (3).
| Ingredients | Amount/Caps (mg) | Annotation |
|---|---|---|
| Adsorbent | ||
| Ciplukan extract | 125.0 | Active compound |
| Amylum maydis | 118.8 | Binder, adsorbent |
| Colloidal silicon dioxide | 6.3 | Adsorbent |
| Capsule filler | ||
| Lactose | 150.0 | Filler, disintegrant |

The Jaccard similarity index between lab and pilot-scale products
| Variables | Cup 1 | Cup 2 | Bacteria Amount |
|---|---|---|---|
| Controlled | 0 | - | 0 |
| 10-1 | 0 | 0 | 0 |
| 10-2 | 25 | 1 | 2.5 ×10³ |
| 10-3 | 0 | 1 | 103 |
| 10-4 | 15 | 6 | 1.5 × 10⁵ |
| 10-5 | 2 | 1 | 2 × 10⁵ |
5. Conclusions
The yield of the ethanol extract of ciplukan complies with the requirements of the Indonesian herbal pharmacopoeia, allowing it to be prepared into capsule dosage forms. The results of similarity testing between capsule production at two facilities with different formulations show a Jaccard similarity index of 0.88, indicating a fairly good similarity. The results of the microbial contamination test, by calculating the average total plate number, were found to meet the requirements of the Indonesian FDA of 107, with an average total plate number of 7.07 × 10⁴. Thus, the composition of the formula from the partner industry can be continued in the production of larger batches.
