


1. Background
SARS-CoV-2 marked the onset of a global pandemic worldwide (1, 2) with symptoms of acute respiratory distress, characterized by tachypnea, hypoxia, and dyspnea (3). This shunt is stimulated as an adaptive mechanism during SARS-CoV-2 infection, enhancing oxygen delivery by reducing hemoglobin's oxygen affinity (4). The enzyme phosphoglycerate mutase (PGM) facilitates the conversion of 1,3-bisphosphoglycerate (1,3-BPG) to 2,3-bisphosphoglycerate (2,3-BPG), which is subsequently hydrolyzed to 3-phosphoglycerate (3-PG) and inorganic phosphate (Pi) by phosphoglycerate phosphatase (PGP) (5, 6). Under hypoxic conditions, eukaryotic cells predominantly rely on anaerobic glycolysis for ATP production, regulated at the transcriptional level through the hypoxia-inducible factor 1-alpha (HIF-1α), which promotes the expression of glycolytic enzymes such as PGM and PGP (7, 8). Remdesivir (REM), an adenosine nucleoside triphosphate analog, is utilized in COVID-19 treatment (9). Remdesivir disrupts the function of viral RNA-dependent RNA polymerase (RdRp) by acting as a delayed chain terminator, which hinders RNA synthesis when it is incorporated into the viral RNA (10-12). Once REM is integrated into the growing RNA strand, it facilitates the addition of three additional nucleotides before the RNA synthesis is halted. However, the addition of the fourth nucleotide to the chain is paused, interfering with the entry of the subsequent nucleoside triphosphate and leading to the stalling of RdRp (13).
2. Methods
All participants (60 individuals) were randomly divided into three groups: Twenty healthy individuals as the negative control, 20 outpatient (mild) patients, and 20 hospitalized (severe) patients. The severe patient group was further divided into two subgroups: Those with and those without REM injection. The treating physicians were aware of the intervention for clinical monitoring, but laboratory personnel analyzing gene expression were blinded to patient groupings to prevent measurement bias.
2.1. Eligibility Criteria
- Diagnosed with COVID-19 via PCR testing.
- Age ≥ 30 years.
- No history of hypertension or high blood pressure at the time of consultation.
- Not pregnant or breastfeeding.
- Iranian nationality.
- Not using heparin.
- Completion of the consent form.
2.2. Exclusion Criteria
- Concurrent infection with other viral diseases (e.g., hepatitis).
- Use of other medications that could interfere with the study.
- Failure to complete the consent form.
- Withdrawal from the study at any stage.
- Death before study completion.
2.3. Primary Outcome
The primary outcome was the effect of REM on the expression levels of PGM and PGP, key enzymes in the Rapoport-Luebering shunt, assessed using real-time PCR.
2.4. Secondary Outcomes
Secondary outcomes included changes in blood oxygenation levels, disease severity progression, and overall patient response to REM treatment.
2.5. RNA Extraction
RNA was extracted from 5 mL of whole blood from each of the three groups using the QIAzol Lysis kit (QIAzol Lysis Reagent) (Qiagen, Frankfurt, Germany). Its quantity and purity were measured with a Nanodrop.
2.6. cDNA Synthesis of Extracted RNA
cDNA molecules were synthesized using a kit from Tajhiz Azma Teb Company (Tehran, Iran), following the protocol of manufacturer.
2.7. Real-time PCR
Real-time PCR was performed using the ABI-7500 system with primers specific for PGM, PGP, and GAPDH (a housekeeping gene used as a reference), following the guidelines of manufacturer. The oligonucleotide sequences for these genes are listed in Table 1. The ΔCt values for PGM and PGP were calculated by subtracting their cycle threshold (Ct) values from that of GAPDH, the control gene. The ΔΔCt values were obtained by comparing the ΔCt values between the severe and control healthy groups, and the mild and control healthy groups. The fold change in gene expression for the target genes was determined using the formula: Fold change of target gene = 2-ΔΔCt.
| Genes and Direction | Primers | Length | T.M |
|---|---|---|---|
| PGM | |||
| Forward | GCACCCACTCCCTTCATACAAT | 22 | 62.1 |
| Reverse | TAACATACTTCCCTCACCCACG | 22 | 62 |
| PGP | |||
| Forward | CTTGGCTCTGCTGACCTTTC | 20 | 60.5 |
| Reverse | CTTTCCAGTCGTCTCGGTTC | 20 | 60.4 |
| GAPDH | |||
| Forward | GACAACTTTGGTATCGTGGAAGG | 23 | 59.56 |
| Reverse | AGGCAGGGATGATGTTCTGG | 20 | 59.45 |
Abbreviations: PGM, phosphoglycerate mutase; PGP, phosphoglycerate phosphatase; GAPDH, glyceraldehyde 3-phosphate dehydrogenase; T.M, melting temperature.
2.8. Statistical Analysis
Statistical analysis was conducted using SPSS version 28 software. A P-value of < 0.05 was considered significant. A one-way variance test was done for data analysis, Tukey’s post hoc test was used for pairwise comparisons between the groups, and an independent t-test checked the level of significance in the PGM group Kruskal-Wallis’s test, and between two groups Dunn test was applied.
3. Results
The results indicated that PGM expression in the severe group without REM was high at 1.67 (95% CI, 1.05 - 3.20), whereas it was lower at 0.18 (95% CI, 0.04 - 1.74) in the severe group with REM. In the mild patients’ group, PGM expression was 2.41 (95% CI, 1.29 - 3.15), and in the control group, it was 0.54 (95% CI, 0.34 - 0.80). The results of the Kruskal-Wallis test indicated that the difference in gene expression medians was significant across all studied groups (P < 0.001) (Table 2).
| Genes and Groups | Median (Q1, Q3) | P-Value |
|---|---|---|
| PGM | < 0.001 | |
| Severe + REM | 0.18 (0.04, 1.74) | |
| Sever without REM | 1.67 (1.05, 3.20) | |
| Mild | 2.41 (1.29, 3.15) | |
| Control | 0.54 (0.34, 0.80) | |
| PGP | < 0.001 | |
| Severe + REM | 0.08 (0.04, 0.15) | |
| Sever without REM | 0.54 (0.33, 1.09) | |
| Mild | 0.55 (0.35, 1.08) | |
| Control | 2.84 (1.36, 7.31) |
Abbreviations: PGM, phosphoglycerate mutase; PGP, phosphoglycerate phosphatase; REM, remdesivir.
Gene expression levels in the three studied groups are shown in Table 3 and Figure 1. For PGM gene expression, there was a significant difference between each pair of studied groups (P < 0.05), except between the severe group with REM and the control group (P > 0.9), and between the severe group without REM and the mild group (P > 0.9) (Table 3).
| Genes | Mean Rank Diff. | P-Value |
|---|---|---|
| PGM | ||
| Severe + REM vs. severe | -17.5 | 0.045 a |
| Severe + REM vs. mild | -21.0 | 0.008 b |
| Severe + REM vs. control | -2.05 | > 0.999 |
| Severe without REM vs. mild | -3.50 | > 0.999 |
| Severe without REM vs. control | 15.4 | 0.038 a |
| Mild vs. control | 18.9 | 0.005 b |
| PGP | ||
| Severe + REM vs. severe | -15.1 | 0.324 |
| Severe + REM vs. mild | -13.3 | 0.531 |
| Severe + REM vs. control | -34.4 | < 0.001 c |
| Severe without REM vs. mild | 1.75 | > 0.999 |
| Severe without REM vs. control | -19.3 | 0.015 a |
| Mild vs. control | -21.1 | 0.006 b |
Abbreviations: PGM, phosphoglycerate mutase; PGP, phosphoglycerate phosphatase; REM, remdesivir.
a P-value < 0.05.
b P-value < 0.01.
c P-value < 0.001.
 Gene expression levels in the four studied groups. * P-value < 0.05; ** P-value < 0.01. Exact P-values are shown in <a href=\"#A156902TBL3\">Table 3</a>.")
Phosphoglycerate mutase (PGM) Gene expression levels in the four studied groups. * P-value < 0.05; ** P-value < 0.01. Exact P-values are shown in Table 3.
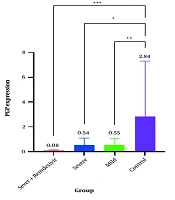
For the PGP gene, expression in the severe group with REM was very low at 0.08 (95% CI, 0.04 - 0.15), and low at 0.54 (95% CI, 0.33 - 1.09) in the severe group without REM. In the mild group, PGP expression was 0.55 (95% CI, 0.35 - 1.08), and in the control group, it was higher than in all other groups at 2.84 (95% CI, 1.36 - 7.31). The results of the Kruskal-Wallis statistical test indicated that the difference in gene expression medians was significant across all studied groups (P < 0.001) (Table 2 and Figure 2).
 gene expression levels in four studied groups. * P-value < 0.05; ** P-value < 0.01; *** P-value < 0.001. Exact P-values are shown in <a href=\"#A156902TBL3\">Table 3</a>.")
Phosphoglycerate phosphatase (PGP) gene expression levels in four studied groups. * P-value < 0.05; ** P-value < 0.01; *** P-value < 0.001. Exact P-values are shown in Table 3.
In PGP gene expression, there was a significant difference between the severe group and the control group (P = 0.015), between the mild group and the control group (P = 0.006), as well as between the severe group with REM and the control group (P < 0.001). However, there was no significant difference in PGP gene expression between other studied groups (Table 3). A non-parametric Spearman analysis test showed no significant correlation between PGM and PGP expression in the severe group with REM (P = 0.54) (Table 4).
| Genes | Correlation Coefficient | P-Value |
|---|---|---|
| PGM | 0.221 | 0.54 |
| PGP |
Abbreviations: PGM, phosphoglycerate mutase; PGP, phosphoglycerate phosphatase.
4. Discussion
Phosphoglycerate mutase gene expression in severe patients without REM was high at 1.67 (95% CI, 1.05 - 3.20), while PGP gene expression in the same group was low at 0.54 (95% CI, 0.33 - 1.09). This resulted in the production of high levels of 2,3-BPG, which stabilizes the T form structure of hemoglobin, reducing its affinity for oxygen molecules and thereby increasing oxygen supply to tissues. Similar conditions were observed in the mild group, with PGM expression at 2.41 (95% CI, 1.33 - 3.00) and PGP expression at 0.55 (95% CI, 0.35 - 1.08).
In the severe group treated with REM, PGM gene expression was 0.18 (95% CI, 0.04 - 1.74), lower than in the untreated severe group [1.67 (1.05, 3.20)]. This reduction in PGM expression is likely due to the effect of REM on viral RNA polymerase, leading to reduced alveolar infection and increased oxygen supply through enhanced pulmonary ventilation. In this group, PGP gene expression was also low at 0.08 (95% CI, 0.03 - 0.15).
According to these findings, oxygen ventilation in the lungs has an inverse relationship with the expression of PGM and PGP genes. When oxygen pressure is low, the expression of these genes increases, promoting the production of 2,3-BPG and enhancing oxygen release to tissues. In the absence of adequate lung ventilation in COVID-19, due to the accumulation of infection in the lungs, the expression of PGM increases sharply while the expression of PGP decreases significantly. Tissue hypoxia is a major factor regulating PGM and PGP gene expression. Acute hypoxia induces HIF-1α and erythropoietin release, whereas chronic hypoxia induces hypoxia-inducible factor 1-beta (HIF-1β). Both HIF-1α and HIF-1β are regulated at the transcriptional level (14, 15). HIF induces anaerobic glycolysis under both pathological and non-pathological conditions, such as in malignancies, SARS-CoV-2 infection, and pneumonia (7, 16).
The Rapoport-Luebering shunt in the glycolysis pathway is accelerated under hypoxic conditions due to COVID-19, leading to excess production of 2,3-BPG through the coordinated action of PGM and PGP (17, 18). A study found that a type of kinase enzyme called sphingosine kinase 1 (SPHK1) in mature red blood cells releases glycolytic enzymes from the RBC membrane into the cytosol, thereby increasing 2,3-BPG production (19), which supports our findings. The increased expression of PGM and PGP genes is not unique to COVID-19 but is also observed in many types of cancer (20, 21). In cancer, the uncontrolled proliferation of cells increases the oxygen demand, leading to hypoxia. This condition induces the HIF gene, which increases the expression of PGM and PGP genes and activates the Rapoport-Luebering shunt pathway (22, 23). Additionally, it causes a shift in the metabolic pathway from aerobic to anaerobic glycolysis, likely due to the immediate need for oxygen and energy (24).
In our study, we observed an increasing level of mRNA PGM gene expression with worsening hypoxic conditions due to COVID-19. This finding is supported by other studies; for example, in a study on rat embryo fibroblasts exposed to hypoxia, the expression of the PGM gene and 2,3-BPG protein increased. After 16 hours of hypoxia, the expression of PGM increased two to three times, reaching a maximum level, which aligns with our results (25).
There are two isoenzymes of PGM: The PGM-BB, which is present in the brain, and its activity increases under hypoxia, and PGM-MM, which is found in the liver and muscle and is not affected by hypoxia. However, the expression and activity of PGM-MM are increased by thyroid hormone T3 (26, 27). In our study, PGP gene expression decreased, and there was no correlation between PGM and PGP. This is consistent with findings in a study conducted by Goh and Klaenhammer on glycogen metabolism in Lactobacillus acidophilus, which demonstrated a similar lack of correlation between gene expressions involved in carbohydrate metabolism, indicating independent regulation of these metabolic pathways (28).
To mitigate the effects of hypoxia caused by pathological conditions, the body adapts, and several traditional and chemical drugs are used. In our study, we investigated the effects of REM on the SARS-CoV-2 virus. Our results showed that PGM gene expression increased and PGP gene expression decreased, similar to individuals without REM injection, but the changes were less pronounced. Since REM interferes with SARS-CoV-2 RNA polymerase, it may reduce the viral load and infection levels in the lungs of hospitalized individuals, leading to increased ventilation and oxygen transfer to the pulmonary alveoli, thus reducing the expression of these genes. In other studies, compounds such as methyl rosmarinate, octahydrocurcumin, hexahydrocurcumin, and N-(p-coumaroyl) serotonin have been shown to activate PGM and increase 2,3-BPG under hypoxic conditions in RBCs (29). Additionally, endogenously produced H2S by the enzyme cystathionine-γ-lyase (CSE) was found to reduce 2,3-BPG levels and elevate P50 (30). It appears that in some cells, such as brain astrocytes, increased levels of PGM-BB and 2,3-BPG inhibit the release of HIF-1α and prevent oxygen release under hypoxic conditions. This may be essential for shifting the energy production pathway from oxidative phosphorylation to anaerobic glycolysis (5). Hypoxic conditions lead to the concentration of glycolysis enzymes in the cytosol of cells, enhancing glucose utilization and increasing energy production (31).
4.1. Conclusions
Our findings suggest that manipulating the expression of PGM and PGP genes with REM can reduce mortality rates in patients with severe COVID-19. In summary, the findings can be explained as follows:
- Hypoxia induces higher PGM expression and suppresses PGP, promoting 2,3-BPG production to enhance oxygen release.
- Remdesivir reduces PGM expression by improving oxygenation, meaning less compensatory 2,3-BPG is needed.
- Phosphoglycerate phosphatase remains low in all COVID-19 cases, suggesting its downregulation is a persistent adaptation to hypoxia.
In other words, REM, by inhibiting the transcription of SARS-CoV-2 RNA polymerase, reduces viral infections and subsequently decreases the expression of PGM and PGP compared to those not treated with REM. Additionally, further investigation into chemical and traditional medicinal factors affecting PGM and PGP expression may help reduce COVID-19 mortality due to hypoxia. By targeting these pathways, we may improve oxygen delivery and utilization in tissues, thereby alleviating the severe hypoxic conditions often associated with COVID-19.
