


1. Background
Type 2 diabetes mellitus (T2DM) and systemic hypertension (HT) are major global health burdens. According to the latest 2017 data from the World Health Organization (WHO), an estimated 425 million adults are living with T2DM worldwide. Currently, India ranks second only to China, with a diabetes population of 74 million; it is speculated that India will surpass China by 2045. The high incidence is attributed to a combination of genetic susceptibility and the adoption of a high-calorie diet and low physical activity by the growing middle-class population in India (1).
According to recent nationwide data, there are approximately 207 million hypertensive patients living in India, and around 10.8% of deaths in India can be attributed to HT. Furthermore, the incidence of HT in patients with T2DM is approximately two-fold higher than in age-matched subjects without the disease. Hypertension has been identified as a major risk factor for the development of micro- and macro-vascular complications such as neuropathy, nephropathy, retinopathy, coronary artery diseases, stroke, and peripheral vascular diseases in T2DM patients (2).
The component of insulin resistance in T2DM increases the concentration of cytosolic malonyl CoA, an intermediate product in fatty acid biosynthesis, which in turn inhibits the enzyme carnitine palmitoyltransferase I (CPT-1) that regulates the β-oxidation of fatty acids. As there is an impairment of β-oxidation, the concentration of acyl-CoA increases in the liver. The excess acyl-CoA gets esterified into triglycerides and is transported out as very low-density lipoprotein (VLDL) in very large numbers, and consequently, the VLDL gets deposited in the peripheral tissue, leading to an elevation in blood pressure (3). Hypertension and T2DM are thus closely interlinked and, to an extent, can be viewed as a cause and effect of each other. The coexistence of both T2DM and HT is clinically important as they act as multiplicative risk factors for macro- and micro-vascular diseases, resulting in increased cardiovascular morbidity and mortality.
Although the currently used antidiabetic drugs are highly effective, some patient-related factors, such as a deficiency in patient compliance, lack of regular physical activity, and inappropriate dietary habits, can lead to suboptimal control of hyperglycemia. From the physician’s perspective, clinical inertia, in addition to the inherent feature of deterioration in insulin sensitivity, contributes to therapeutic failure. In India, it is estimated that more than 50% of people with T2DM have poor glycemic control, uncontrolled HT, and dyslipidemia, and a large proportion have diabetic vascular complications (4). It is also often postulated that in a developing country like India, more systematic studies are required to evaluate the drug use patterns of antidiabetic and antihypertensive medications (5, 6).
2. Objectives
This study was carried out to determine the prescribing and drug use patterns of antidiabetic and antihypertensive drugs in T2DM patients with or without HT, to measure the glycemic response, and to assess the cost of prescribed antidiabetic and antihypertensive drugs.
3. Methods
3.1. Study Design, Setting, and Subjects
This retrospective observational study was conducted in the Department of Pharmacology in Collaboration with the Department of General Medicine (Division of Diabetology) at a tertiary care teaching hospital in Puducherry, India. T2DM patients with or without systemic arterial HT, aged between 35 and 65 years and of either gender, were included in the study. Patients with renal and liver diseases, pregnant and lactating women, and patients with type 1 diabetes mellitus (DM) were excluded from the study.
3.2. Sample Size
According to the WHO guidelines manual on "How to Investigate Drug Use in Health Facilities?" (7), the sample size was fixed at 100 with a 95% confidence interval of plus or minus 10%. The sample size was deemed appropriate as the study involved a single healthcare facility, and moreover, the treating physician (prescriber) was also a single person.
3.3. Study Procedure
The study was approved by the Scientific Research Committee (SRC) [SVMC/SRC/2017/04/CTR341] and the Institute Ethics Committee (IEC) [SVMCH/IEC/2017/13]. The principles of the Declaration of Helsinki, following good clinical practices, were strictly adhered to throughout the entire course of the study. Patients were given clear explanations about the details of the study in their native language, and written informed consent was obtained. Patients attending the Diabetology Outpatient Department were screened over a period of two months and recruited based on the inclusion and exclusion criteria. The demographic characteristics of the patients were documented in the case record form. The prescriptions of the patients were screened for the antidiabetic and antihypertensive drugs prescribed. The proportion of drugs prescribed from the "National List of Essential Medicines (NLEM), 2015" (8) was noted.
The dosage details of the drugs prescribed were recorded. The drug utilization of antidiabetic and antihypertensive agents was analyzed using the World Health Organization-anatomical therapeutic chemical (ATC)/defined daily dose (WHO-ATC/DDD) system (9). In accordance with this system, each drug (active substance) is assigned an alphanumerical ATC code, and the defined daily dose (DDD) is calculated. The DDD is the assumed average maintenance dose per day for a drug used for its main indication in adults; it is a unit of measurement of drug utilization. The actual utilization of antidiabetic and antihypertensive drugs in the present study was measured in terms of the average prescribed daily dose (PDD), which was computed from the total daily dose prescribed divided by the number of patients receiving the drug. Furthermore, the PDD:DDD ratio was derived, and drugs with ratios "less than one", "equal to one", and "more than one" were considered as "underutilized", "optimally utilized", and "overutilized", respectively.
The medical case records and lab reports were accessed to determine the values of fasting blood glucose (FBG), systolic blood pressure (SBP), and diastolic blood pressure (DBP) over the last three months. The retrospective data with the FBG, SBP, and DBP values three months prior to the day of enrollment were considered as the baseline values. The change and relative change in FBG were calculated; the relative change in FBG was given by the formula "(treatment FBG – baseline FBG) ÷ baseline FBG". The cost per unit strength of the medications prescribed was ascertained from the pharmacy and billing sections. The average cost spent per day for each drug was calculated based on the cost per unit strength of the drug prescribed and the average PDD.
3.4. Statistical Analysis
Data were expressed as mean ± standard deviation for continuous variables and percentages (%) for categorical variables. Unpaired t-tests and Mann-Whitney tests were used for comparing continuous parametric and continuous non-parametric variables, respectively. Fisher’s exact tests and chi-square tests were utilized for assessing the categorical variables. Two‐tailed P-values were used, and a P-value less than 0.05 (P < 0.05) was considered statistically significant. The software GraphPad InStat, version 3.06 (GraphPad Software, San Diego, CA, USA), was used for data analyses.
4. Results
4.1. Patient Characteristics
Ninety-eight T2DM patients fulfilling the eligibility criteria were selected for the final analysis of the study. There was almost equal representation of both genders (54% females), and the patients were found to be marginally overweight, with a BMI of 25 ± 3.4 kg/m2. Fifty patients were diagnosed with co-existing systemic HT (51%). The disease duration for both T2DM and HT was approximately 7 years each.
Patients with a baseline FBG value of less than 110 mg/dL were considered controlled T2DM patients (N = 24), and those with a baseline FBG value of 110 mg/dL and above were considered uncontrolled T2DM patients (N = 74). As depicted in Table 1, there were no statistically significant differences in the parameters studied between the controlled and uncontrolled T2DM patients (P > 0.05), except for the baseline FBG values, which were understandably lower in the controlled group than in the uncontrolled group (95.1 ± 11.8 mg/dL vs. 189.2 ± 63.4 mg/dL, P < 0.001).
| Parameters | All Patients (N = 98) | Patients with Controlled T2DM (n = 24) | Patients with Uncontrolled T2DM (n = 74) | P c |
|---|---|---|---|---|
| Age (y) | 56.5 ± 11.3 | 59.7 ± 11.5 | 55.1 ± 11.4 | 0.092 d |
| Females | 53 (54.1) | 12 (50) | 41 (55.4) | 0.815 e |
| Weight (kg) | 61.2 ± 11.6 | 63.4 ± 12.8 | 61.0 ± 12.0 | 0.528 d |
| Height (cm) | 156.3 ± 9.7 | 155.3 ± 7.8 | 157.0 ± 10.1 | 0.518 f |
| Body Mass Index (kg/m2) | 25.0 ± 3.4 | 26.3 ± 5.0 | 24.8 ± 4.0 | 0.143 f |
| Duration of diabetes (y) | 7.5 ± 5.7 | 7.8 ± 5.3 | 6.3 ± 5.3 | 0.392 d |
| Baseline FBG (mg/dL) | 168.2 ± 68.6 | 95.1 ± 11.8 | 189.2 ± 63.4 | < 0.001 f |
| Family history of diabetes | 47 (48.0) | 11 (45.8) | 36 (48.6) | 1.000 e |
| HT | 50 (51.0) | 10 (41.7) | 40 (54.1) | 0.351 e |
| Duration of HT (y) | 6.8 ± 4.9 | 9.0 ± 5.0 | 6.4 ± 4.9 | 0.362 f |
| Baseline SBP (mmHg) | 128.9 ± 14.9 | 124.8 ± 13.9 | 130.27 ± 15.0 | 0.105 f |
| Baseline DBP (mmHg) | 81 ± 6.8 | 77.9 ± 7.8 | 82.0 ± 6.2 | 0.058 f |
| Alcoholics | 13 (13.3) | 3 (12.5) | 10 (13.5) | 1.000 e |
| Smokers | 6 (6.1) | 2 (8.3) | 4 (5.4) | 0.633 e |
| Physical activity | 0.516 g | |||
| Level 1 | 44 (44.9) | 13 (54.2) | 31 (41.9) | |
| Level 2 | 21 (21.4) | 5 (20.8) | 16 (21.6) | |
| Level 3 | 33 (33.7) | 6 (25.0) | 27 (36.5) | |
| Level 4 | 0 (0) | 0 (0) | 0 (0) |
Abbreviations: T2DM, type 2 diabetes mellitus; FBG, fasting blood glucose; SBP, systolic blood pressure; DBP, diastolic blood pressure; HT, hypertension.
a Controlled T2DM refers to FBG ≤ 110 mg/dL; uncontrolled T2DM refers to FBG > 110 mg/dL.
b Values are expressed as mean ± SD or No. (%).
c P < 0.05 was considered statistically significant.
d Unpaired t-test.
e Fisher’s exact test.
f Mann-Whitney test.
g Chi-square test were used for comparing the different parameters between the controlled and uncontrolled T2DM patients.
4.2. Antidiabetic and Antihypertensive Drugs Prescribed
Nearly half (47%) of the study population (Figure 1A) received metformin (belonging to the class of biguanides), and all fixed-dose combinations (FDCs) (Figure 1B) contained metformin as one of the components. 42% of the patients with T2DM and HT and 52% of the patients with T2DM alone were on metformin-based treatment. The next most commonly prescribed drug was teneligliptin (a DPP-4 inhibitor), with around 20% of the population receiving it. Glimepiride and glibenclamide (sulfonylureas) were prescribed to 12% of the population; pioglitazone (a thiazolidinedione) to 5%; voglibose (an α-glucosidase inhibitor) to 5%; empagliflozin (a sodium–glucose cotransporter-2 inhibitor) to 4%; and repaglinide (a meglitinide) to 1%. There was no statistically significant difference noted between the proportion of patients on metformin and non-metformin-based oral antidiabetic drugs (P = 0.273).
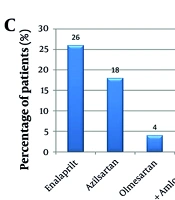
: A, the study analyzed antidiabetic drugs used by the population, comparing metformin users with those on other oral hypoglycemic agents. The chi-square test yielded a P-value of 0.273, showing no significant difference (P < 0.05). It also identified drugs from the national list of essential medicines (NLEM), 2015. NPH insulin, neutral protamine hagedorn (isophane) insulin; insulin mixtard, regular insulin (30%) + isophane insulin (70%); B, the study evaluated antidiabetic fixed-dose combinations (FDCs), comparing sulfonylureas-based metformin therapy with gliptin-based metformin therapy. The chi-square test resulted in a P-value of 0.610, indicating no significant difference (P < 0.05); C, the study assessed antihypertensive drugs used by the population, noting which were included in the NLEM, 2015. The * denotes the groups compared for the inferential statistics (computed P value).")
Antidiabetic and antihypertensive agents taken by the study population (A - C): A, the study analyzed antidiabetic drugs used by the population, comparing metformin users with those on other oral hypoglycemic agents. The chi-square test yielded a P-value of 0.273, showing no significant difference (P < 0.05). It also identified drugs from the national list of essential medicines (NLEM), 2015. NPH insulin, neutral protamine hagedorn (isophane) insulin; insulin mixtard, regular insulin (30%) + isophane insulin (70%); B, the study evaluated antidiabetic fixed-dose combinations (FDCs), comparing sulfonylureas-based metformin therapy with gliptin-based metformin therapy. The chi-square test resulted in a P-value of 0.610, indicating no significant difference (P < 0.05); C, the study assessed antihypertensive drugs used by the population, noting which were included in the NLEM, 2015. The * denotes the groups compared for the inferential statistics (computed P value).
Sulfonylureas-based metformin-containing FDCs were consumed by 44% of the population compared to gliptin-based metformin-containing FDCs consumed by 41% of the population (P = 0.610). The sulfonylureas-based FDCs include a voglibose-containing triple therapy, i.e., metformin + glimepiride + voglibose, taken by 12% of the population.
The drugs modulating the Renin-Angiotensin System, namely, the angiotensin-converting enzyme inhibitors (ACEIs) and the angiotensin ii receptor blockers (ARBs), were the most commonly prescribed, accounting for 58% of the antihypertensive drugs (Figure 1C). Enalapril, azilsartan, olmesartan, and telmisartan (as an FDC with amlodipine) were the drugs prescribed. The other classes of antihypertensives prescribed were metoprolol (a β-blocker), 18%; amlodipine and cilnidipine (Ca2+ channel blockers), 16%; and chlorthalidone (a thiazide-type diuretic), 8%.
52% of the study population was receiving antidiabetic drugs prescribed from the NLEM, and similarly, 52% of hypertensive patients were receiving antihypertensive drugs prescribed from the list.
4.3. Antidiabetic and Antihypertensive Drug Utilization Based on the World Health Organization-Anatomical Therapeutic Chemical/Defined Daily Dose System
The average PDD of metformin (1.2 g) was much lower than the recommended DDD of 2 g. The average PDD of other oral antidiabetic drugs was more or less equivalent to the corresponding DDD of individual drugs; however, the average PDD of pioglitazone, voglibose, and repaglinide were lower, whereas those of glimepiride and empagliflozin were on the higher side (Table 2).
| Drugs a | ATC Code | DDD | PDD b | PDD/DDD | Interpretation |
|---|---|---|---|---|---|
| Antidiabetic agents | |||||
| Metformin | A10BA02 | 2 g | 1.2 g | 0.6 | Underutilization |
| Glibenclamide | A10BB01 | 10 mg | 10 mg | 1 | Optimal utilization |
| Glimepiride | A10BB12 | 2 mg | 2.6 mg | 1.3 | Overutilization |
| Pioglitazone | A10BG03 | 30 mg | 26 mg | 0.9 | Underutilization |
| Voglibose | A10BF03 | 0.6 mg | 0.4 mg | 0.7 | Underutilization |
| Teneligliptin | Not assigned | - | 21 mg | - | - |
| Empagliflozin | A10BK03 | 17.5 mg | 22 mg | 1.2 | Overutilization |
| Repaglinide | A10BX02 | 4 mg | 2 mgd | 0.5 | Underutilization |
| Regular insulin | A10AB01 | 40 U | 75 Ud | 1.9 | Overutilization |
| Neutral protamine hagedorn (NPH, isophane) insulin | A10AC01 | 40 U | 15 Ud | 0.4 | Underutilization |
| Regular insulin (30%) + isophane insulin (70%) | A10AD01 | 40 U | 35 U | 0.9 | Underutilization |
| Insulin lispro | A10AB04 | 40 U | 41 U | 1 | Optimal utilization |
| Antihypertensive agents | |||||
| Enalapril | C09AA02 | 10 mg | 4 mg | 0.4 | Underutilization |
| Azilsartan | C09CA09 | 40 mg | 33 mg | 0.8 | Underutilization |
| Olmesartan | C09CA08 | 20 mg | 20 mg | 1 | Optimal utilization |
| Amlodipine | C08CA01 | 5 mg | 4 mg | 0.8 | Underutilization |
| Cilnidipine | C08CA14 | 10 mg | 8 mg | 0.8 | Underutilization |
| Metoprolol | C07AB02 | 0.15 g | 0.04 g | 0.3 | Underutilization |
| Chlorthalidone | C03BA04 | 25 mg | 13 mg | 0.5 | Underutilization |
Abbreviations: ATC, anatomical therapeutic chemical classification; DDD, defined daily dose; PDD, average prescribed daily dose.
a No FDCs were included for the analysis. ATC and DDD were extracted from the WHO-ATC/DDD Index 2019 (Available from: https://www.whocc.no/atc_ddd_index/).
b Repaglinide, regular insulin and NPH insulin, each of which, was prescribed to a single patient.
Similarly, with respect to the most commonly used antihypertensive, enalapril, the average PDD was 4 mg compared to the required DDD of 10 mg. Azilsartan's PDD was 33 mg compared to the DDD of 40 mg. Except for olmesartan, the PDD of other drugs was much lower compared to their corresponding DDD.
4.4. Glycemic Response in the Study Population
As depicted in Figure 2, the controlled T2DM patients had a statistically significant increase in FBG values at the end of three months compared to the uncontrolled T2DM patients. The mean increase in FBG was 17.1 mg/dL in controlled T2DM patients compared to a 10.4 mg/dL decrease in uncontrolled T2DM patients (P = 0.003). Similarly, the difference in the mean relative change in FBG between these groups was found to be statistically significant (P = 0.005).
 patients (N = 98), focusing on two measures: A, the mean change in fasting blood glucose (FBG); B, the mean relative change in FBG. Controlled DM (N = 24) was defined as FBG ≤ 110 mg/dL, while uncontrolled DM (N = 74) was defined as FBG > 110 mg/dL. The Mann-Whitney test was used, with a significance level of P < 0.05. The relative change in FBG was calculated using the formula: (treatment FBG - baseline FBG) ÷ baseline FBG")
Glycemic response in the controlled and uncontrolled diabetes mellitus (DM) patients (N = 98), focusing on two measures: A, the mean change in fasting blood glucose (FBG); B, the mean relative change in FBG. Controlled DM (N = 24) was defined as FBG ≤ 110 mg/dL, while uncontrolled DM (N = 74) was defined as FBG > 110 mg/dL. The Mann-Whitney test was used, with a significance level of P < 0.05. The relative change in FBG was calculated using the formula: (treatment FBG - baseline FBG) ÷ baseline FBG
4.5. Cost of Antidiabetic and Antihypertensive Agents Prescribed
Among the oral antidiabetic drugs prescribed, the costliest was empagliflozin, with an average cost per day of ₹. 50, whereas the cheapest was glibenclamide, with an average cost per day of ₹. 2 (Table 3). Likewise, the average cost per day of voglibose, teneligliptin, glimepiride, pioglitazone, and metformin was ₹. 16, ₹. 11, ₹. 10, ₹. 4, and ₹. 4, respectively. Insulin lispro was the costliest insulin preparation, costing around ₹. 291 per day.
| Drugs a | Usual Strength Available | Cost per Unit Strength (₹) | Average PDD | Average Cost per Day (₹) |
|---|---|---|---|---|
| Antidiabetic agents | ||||
| Metformin | 500 mg | 1.5 | 1.2 g | 4 |
| Glibenclamide | 5 mg | 1 | 10 mg | 2 |
| Glimepiride | 1 mg | 4 | 2.6 mg | 10 |
| Pioglitazone | 15 mg | 5 | 26 mg | 9 |
| Voglibose | 0.2 mg | 8 | 0.4 mg | 16 |
| Teneligliptin | 20 mg | 10.5 | 21 mg | 11 |
| Empagliflozin | 25 mg | 57 | 22 mg | 50 |
| Repaglinide | 1 mg | 2 | 2 mg | 4 |
| Regular (soluble) insulin | 40 U | 143 | 75 U | 54 |
| Neutral protamine hagedorn (NPH, isophane) insulin | 40 U | 143 | 15 U | 268 |
| Regular insulin (30%) + isophane insulin (70%) | 40 U | 143 | 35 U | 123 |
| Insulin lispro | 100 U | 704 | 41 U | 291 |
| Antihypertensive agents | ||||
| Enalapril | 5 mg | 3 | 4 mg | 2 |
| Azilsartan | 40 mg | 9 | 33 mg | 8 |
| Olmesartan | 20 mg | 11 | 20 mg | 11 |
| Amlodipine | 2.5 mg | 3 | 4 mg | 5 |
| Cilnidipine | 5 mg | 6 | 8 mg | 9 |
| Metoprolol | 25 mg | 2 | 0.04 g | 3 |
| Chlorthalidone | 12.5 mg | 6 | 13 mg | 6 |
Abbreviation: PDD, prescribed daily dose.
a No FDCs were included for the analysis.
The average cost per day of olmesartan was ₹. 11 compared to ₹. 2 for enalapril. Similarly, the average cost per day of metoprolol, amlodipine, chlorthalidone, azilsartan, and cilnidipine was ₹. 3, ₹. 5, ₹. 6, ₹. 8, and ₹. 9, respectively.
5. Discussion
Both as monotherapy and in FDCs, metformin was the most commonly prescribed drug. The high usage trend of metformin aligns with the recommendations of current treatment guidelines proposed by various professional organizations, such as the American Diabetes Association (ADA), the International Diabetes Federation (IDF), the National Institute for Health and Care Excellence (NICE), the Indian Council of Medical Research (ICMR), and the Research Society for the Study of Diabetes in India (RSSDI) (10-14). The major determinants of metformin’s high utilization rates are its euglycemic effectiveness and low cost.
However, in contrast to some recent worldwide (15) and regional (16) statements, the usage of traditional sulfonylureas was lower than that of teneligliptin, a newer class of oral antidiabetic drug. This scenario was partially compensated by sulfonylureas-based FDCs, which were prescribed for nearly half of the study population.
The advantages of teneligliptin over other gliptins include once-daily dosing and no necessity for dosage adjustment in patients with impaired renal function (17, 18). Above all, teneligliptin, being the most cost-effective gliptin available, was prescribed more commonly (19).
Among the antihypertensives, ACEIs and ARBs were commonly prescribed, understandably so, as all the patients had coexistent diabetes. This pattern aligns with the latest Joint National Committee (JNC 8) guidelines (20), which recommend the inclusion of an ACEI or ARB as an initial choice of antihypertensive therapy to improve kidney outcomes, particularly in patients with diabetes. A recent cross-sectional study by Paradkar and Sinha (21) in a tertiary care hospital situated in Western India reflected a similar trend, with 60% of the study participants receiving enalapril. Other studies (22, 23) also revealed a higher percentage of use of ACEIs and ARBs, while a few contrasting studies (24-26) reported a higher percentage of use of Ca2+ channel blockers.
Around half of each of the antidiabetic and antihypertensive drugs prescribed were not from the NLEM, which does not appear to be favorable. As drugs categorized in the NLEM exhibit optimal efficacy, safety, and cost-effectiveness, they ought to be prescribed more. However, the data resembles some other studies conducted in the same region, such as the study by Datta (24) in a South Indian tertiary care teaching hospital, which reported 65% adherence to the NLEM.
Metformin was overtly underutilized, with only 60% of the requisite dose prescribed. Similarly, the most commonly prescribed antihypertensive, enalapril, was underutilized, with only 40% of the requisite dose used. Glimepiride and empagliflozin were overutilized, with additional dosing of 30% and 20%, respectively. All antihypertensive drugs were underutilized except for olmesartan.
As the demographic and baseline characteristics of the patients with controlled and uncontrolled T2DM were similar, the glycemic responses between the groups were compared. There was a paradoxical effect in that patients with previously controlled DM had a poor glycemic response, with a 19% increase in FBG values compared to patients with uncontrolled DM, who showcased a comparatively favorable glycemic response with a 2.6% decrease in FBG values.
This differential response between the controlled and uncontrolled groups could be explained by many factors, including drug, patient, and physician-related factors. The class (type), dose, and frequency of the drug used may influence the response (27, 28). The most important patient factor is the baseline FBG, as it is evident that patients with a higher FBG tend to show a comparatively drastic decrease in FBG post-treatment than those with a lower FBG (29). In this study, patients with uncontrolled T2DM had a baseline FBG of 189 mg/dL compared to 95 mg/dL for patients with controlled T2DM.
Glibenclamide was the most cost-effective oral antidiabetic drug prescribed, whereas empagliflozin was the least cost-effective antidiabetic drug. Similarly, among antihypertensive drugs, the most cost-effective was enalapril, and the least cost-effective was olmesartan. The rapid-acting recombinant insulin analog lispro was the costliest antidiabetic medicine for obvious reasons. These findings align with current Indian data (6, 25, 30).
Some of the strengths of the current study include, first, measuring drug use by DDDs was ideal, as DDDs provide a fixed unit of measurement independent of price, package size, and strength, enabling the researcher to assess trends in drug consumption and perform comparisons between population groups (9). Second, most previous studies (31, 32) utilized an absolute change in FBG as a parameter to measure glycemic response, whereas, in the present study, the glycemic response was quantified based on the relative change in FBG. Relative change in FBG is a superior measure of glycemic response compared to the actual change in FBG, as it accounts for variations in baseline FBG across subjects. The glycemic responses thus quantified are truly reflective of the real glycemic status of patients.
5.1. Conclusions
The study found that metformin and enalapril were the most commonly prescribed antidiabetic and antihypertensive drugs, respectively, which aligns with general recommendations. However, the second most commonly prescribed antidiabetic was teneligliptin rather than sulfonylureas. The utilization of antidiabetic and antihypertensive drugs from the NLEM was around 52% for each. Though commonly prescribed, both metformin and enalapril were found to be underutilized (under-dosed). The controlled and uncontrolled subgroups of T2DM patients demonstrated variable glycemic responses, with controlled T2DM patients having a poor glycemic response after three months and vice versa. Glibenclamide and enalapril were found to be the most cost-effective antidiabetic and antihypertensive drugs, respectively.
5.2. Limitations
The limitations of the study include the smaller sample size and the unavailability of HbA1c data for efficacy analysis, as measuring glycemic response with HbA1c is considered the gold standard. Furthermore, adherence to prescriptions and adverse effects of the consumed drugs were not assessed, and indirect costs were not considered. Given the retrospective observational design of the study, inherent confounding factors — including selection bias of the study participants, misclassification bias in the assessment of exposure and outcome, and observer bias — could have compromised the study findings.
