1. Background
Since December 2019, the coronavirus disease 2019 (COVID-19) has been spreading aggressively worldwide, and the health systems have encountered an increasing shortage of critical care resources, such as personal protective equipment, intensive care unit (ICU) beds, and ventilators (1). So far, this virus has affected almost all countries, with more than two million deaths worldwide (2). Approximately 20% of COVID-19 patients need hospitalization, and 20%-30% of COVID-19 in-hospital patients are admitted to ICU (3). In Iran, the ICU admission rate is estimated to be 32% of hospitalized patients, and the ICU death rate is about 39% (4). The ICU resources are currently restricted, and more than 50% of ICU beds are occupied under normal conditions (5).
The unexpected outbreak, rapid transmission, ambiguous disease course, and prognosis, as well as emerging new mutations of COVID-19, along with health systems being not prepared for large-scale epidemic responses, created a situation in which the management of intensive care resources is crucial (6). Under this condition, it is urgent to construct and test effective clinical risk prediction tools for appropriately triaging critical patients (7, 8). Accordingly, predicting the individual disease courses and outcomes is essential for triaging patients, customized care service provision, utilizing life-saving resources in the best possible way, and directing them toward vulnerable and at-risk sub-groups deteriorating to critical COVID-19. Furthermore, many problems resulting from the shortage of hospital resources can be overcome by predicting the risk of patient deterioration, determining the length of stay, using hospital resources efficiently, and managing bed turnover (9, 10).
Innovative approaches for the early identification and triaging of patients at the time of admission will be greatly beneficial and effective in estimating which patients are at the high risk of clinical deterioration and have poor outcomes requiring ICU admission (8, 9). In such conditions, the design and implementation of clinical decision support systems equipped with machine learning (ML)-based prediction models will be critical for the optimal use of limited hospital resources and supporting clinical decisions. The ML, as a sub-form of artificial intelligence technologies, provides new insight or knowledge through extracting functional patterns and applicable rules from the large raw datasets (7, 10).
In the previous researches, a large number of ML algorithms were trained for the prediction of COVID-19 disease progression, patient condition deterioration (9, 10), ICU hospitalization (8, 9, 11-13), and death (8, 11, 14-19).
2. Objectives
The present study aimed to develop and validate a data-driven framework using five ML techniques to predict the patients who need transfer to ICU and find out the contributing clinical predictors by analyzing the available data at the time of admission.
3. Methods
This retrospective single-center cross-sectional study was conducted in 2021 to predict admission to ICU based on selected data-driven ML techniques.
3.1. Dataset and Participants
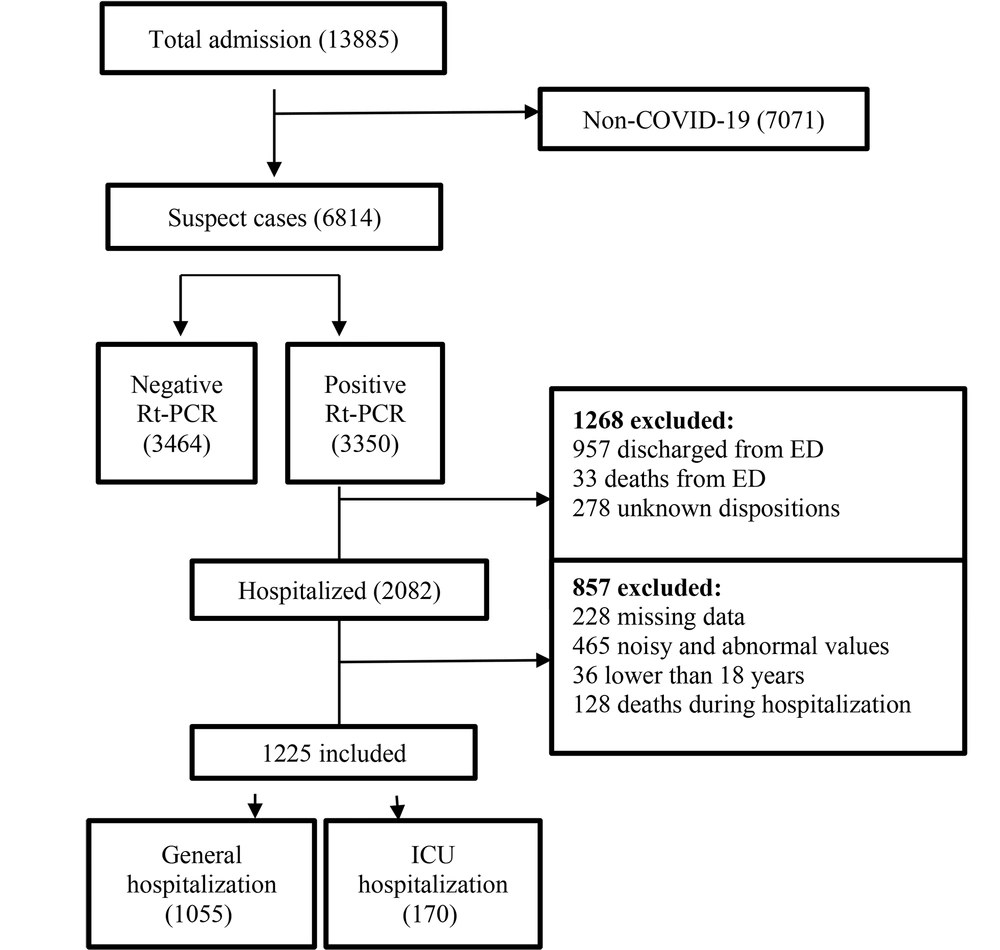
In this study, a COVID-19 hospital-based registry database from Taleghani Hospital, Abadan, Iran, was reviewed retrospectively. Only hospitalized confirmed COVID-19 patients aged ≥18 years and admitted during January 9, 2020 - January 20, 2021, met our inclusion criteria. During this period, a total of 13885 suspected cases with COVID-19 were referred to Taleghani Hospital, 3350 of which were confirmed as COVID-19 by RT-PCR test. The exclusion criteria entailed non-COVID-19 cases, non-hospitalized COVID-19 patients, cases with unknown disposition, patients under 18 years old, incomplete case records (missing more than 70%), and admission time before January 9, 2020, or after January 20, 2021. Following applying the exclusion criteria, finally, 1225 records were entered in the study (Figure 1).
3.2. Feature Selection
Feature selection is an effective technique for determining the most significant variables, reducing the dimensions of the dataset, and improving the efficiency of ML algorithms (20). The included cases are defined based on 53 primary risk factors. In the current study, the variables with a correlation coefficient value less than 0.05 (P-value < 0.05) were identified as influential risk factors in predicting ICU admission.
3.3. Model Development
To predict ICU admission for COVID-19 patients, several ML classification algorithms, including Artificial Neural Network (ANN), K-Nearest Neighbor (KNN), Support Vector Machine (SVM), Decision Tree (DT), and Random Forest (RF), were used. We applied a set of parameters as shown in Table 1.
| Model | Parameters |
|---|---|
| KNN | K = 1, 3, 5 |
| SVM | Kernel function = Gaussian |
| RF | - |
| DT | - |
| ANN | 57-10-5-2 |
Parameters for ML Algorithms
3.4. Study Roadmap and Experiment Environment
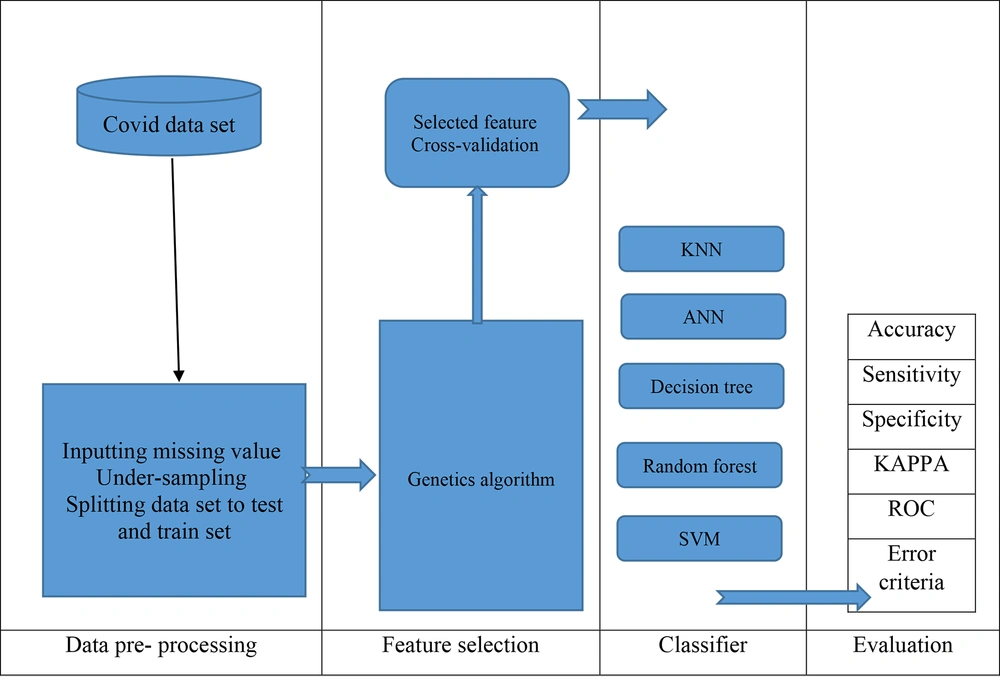
All experiments on the classification algorithms described in this study were implemented using Python version 3.7.7. The Python experiment environment offers a well-defined framework for researchers and developers to run and assess their ML models. The roadmap of the proposed prediction model in this work is depicted in Figure 2.
3.5. Preprocessing
In the preprocessing stage, in order to use the data effectively in classifiers, raw data input was performed utilizing several preprocessing techniques, such as deleting missing values (missing more than 70%), minimum and maximum scalar values, and standard scalar.
3.6. Experiment Evaluation
In this study, the performance of ML algorithms was calculated based on the 10-fold cross-validation method. To better compare the performance of algorithms, we assessed the effectiveness of five ML algorithms in terms of accuracy, specificity, sensitivity, error rate (Equations 1-4), receiver operating characteristic (ROC) curve, time to build the model, correctly classified instances, incorrectly classified instances, Kappa statistic, mean absolute error (MAE), root mean squared error (RMSE), relative absolute error, and root relative squared error (RRSE).
3.7. Ethical Considerations
The present study was approved by the Ethics Committee of Abadan University of Medical Sciences (Ethics code: IR.ABADANUMS.REC.1400.054). In order to protect the privacy and confidentiality of patients, we concealed the unique identification information of all patients in the process of data collection and presentation.
4. Results
4.1. Demographic and Clinical Characteristics
After applying the exclusion criteria, a total of 1225 patients were eligible (Figure 1). Of 1225 hospitalized COVID-19 cases, 664 (54.2%) were male, and 561 (45.8%) were women. Moreover, the median age of participants was 57.25 years (interquartile 18 - 100 years). We observed that 170 (13.87%) individuals were hospitalized in the ICU, and 1055 (86.13%) cases were hospitalized in general wards. Among the eligible patients, 1136 (92.75%) recovered, and 89 (7.25%) were deceased. Descriptive statistics for the 1225 records in this dataset are summarized in Table 2.
| Variables | Values |
|---|---|
| Qualitative | |
| Blood type | |
| A-, A+ | 17, 552 |
| B-, B+ | 13, 126 |
| O-, O+ | 29, 421 |
| AB-, AB+ | 6, 61 |
| Gender | |
| Male | 664 |
| Female | 561 |
| Cough | |
| Yes | 958 |
| No | 267 |
| Contusion | |
| Yes | 409 |
| No | 816 |
| Nausea | |
| Yes | 401 |
| No | 824 |
| Vomit | |
| Yes | 346 |
| No | 879 |
| Headache | |
| Yes | 312 |
| No | 913 |
| Gastrointestinal symptoms | |
| Yes | 252 |
| No | 973 |
| Muscular pain | |
| Yes | 623 |
| No | 602 |
| Chill | |
| Yes | 591 |
| No | 634 |
| Fever | |
| Yes | 628 |
| No | 597 |
| Pneumonia | |
| Yes | 1044 |
| No | 181 |
| Oxygen therapy | |
| Yes | 1053 |
| No | 172 |
| Dyspnea | |
| Yes | 1078 |
| No | 147 |
| Loss of taste | |
| Yes | 272 |
| No | 953 |
| Loss of smell | |
| Yes | 305 |
| No | 920 |
| Runny noise | |
| Yes | 437 |
| No | 788 |
| Sore throat | |
| Yes | 444 |
| No | 781 |
| Other underlying diseases | |
| Yes | 735 |
| No | 490 |
| Cardiac disease | |
| Yes | 306 |
| No | 919 |
| Hypertension | |
| Yes | 395 |
| No | 830 |
| Diabetes | |
| Yes | 268 |
| No | 957 |
| Smoking | |
| Yes | 41 |
| No | 1184 |
| Alcohol addiction | |
| Yes | 11 |
| No | 1214 |
| C-Reactive protein | |
| Positive | 1063 |
| Negative | 162 |
| Hypersensitive troponin | |
| Positive | 58 |
| Negative | 1167 |
| ICU admission (outcome) | |
| Yes | 1055 |
| No | 170 |
| Quantitative | |
| Age (y) | 57.25 ± 17.8 (18 – 100) |
| Height | 168.53 ± 8.5 (92 - 195) |
| Weight | 75.20 ± 13 (6.5 - 163) |
| Creatinine | 1.39 ± 1.4 (0.1 - 17.9) |
| Red cell count | 4.56 ± 0.9 (1.38 - 13.1) |
| White cell count | 8182.34 ± 4897.4 (1300 - 63000) |
| Hematocrit | 39.20 ± 6.7 (3.6 - 73.9) |
| Hemoglobin | 13.21 ± 2.4 (3.7 - 46) |
| Platelet count | 215493.66 ± 88380.1 (108000 - 691000) |
| Absolute lymphocyte count | 23.74 ± 11.8 (2 - 95) |
| Absolute neutrophil count | 74.52 ± 12.3 (8 - 98) |
| Calcium | 9.68 ± 0.8 (0.9 - 14.1) |
| Phosphorus | 3.5 ± 0.5 (2 - 12.4) |
| Magnesium | 2.16 ± 0.6 (1.14 - 19.1) |
| Sodium | 137.94 ± 5.3 (37 - 157) |
| Potassium | 3.98 ± 0.7 (2.5 - 14.2) |
| Blood urea nitrogen | 42.52 ± 31.7 (0.5 - 251) |
| Total bilirubin | 0.72 ± 0.7 (0.01 - 10) |
| Aspartate aminotransferase | 44.45 ± 53.5 (3.8 - 924) |
| Alanine aminotransferase | 38.29 ± 41.6 (2 - 672) |
| Albumin | 4.02 ± 0.5 (0.2 - 8.9) |
| Glucose | 136.09 ± 74.2 (18 - 994) |
| Lactate dehydrogenase | 555.68 ± 339 (4.6 - 6973) |
| Activated partial thromboplastin time | 28.56 ± 11.4 (1 - 120) |
| Prothrombin time | 12.82 ± 1.9 (0.9 - 46.8) |
| Alkaline phosphatase | 213.12 ± 139.2 (9.6 - 2846) |
| Erythrocyte sedimentation rate | 40.65 ± 28.8 (2 - 258) |
Descriptive Statistics of the Study Variables After Preprocessing a
4.2. Top Predictors of ICU Admission
The most important predictors affecting ICU admission and disease progression were determined using the correlation coefficient at P-value < 0.05. As shown in Table 3, the top 11 ICU admission predictors were age, white cell count, neutrophil count, and lymphocyte count, blood urea nitrogen (BUN), aspartate transaminase (AST)/alanine transaminase (ALT), lactate dehydrogenase (LDH), cough, dyspnea, and oxygen therapy.
| Variables | Pearson’s Correlation | P-Value | Variables | Pearson’s Correlation | P-Value |
|---|---|---|---|---|---|
| Age | -0.045 | *0.019 | Blood type | -0.025128 | 0.274 |
| Height | -0.24 | 0.409 | Gender | -0.107 | 0.38 |
| Weight | -0.25 | 0.388 | Cough | 0.299 | *0.041417 |
| Temperature | -0.32 | 0.268 | Contusion | -0.122 | 0.342 |
| Creatinine | -0.066 | 0.119 | Hypertension | -0.1744378 | 0.0541 |
| Red cell count | 0.029 | 0.315 | Cardiovascular | 0.2746594 | 0.125 |
| White cell count | -0.054 | *0.047 | Alcohol consumption | 0.7923469 | 0.218 |
| Hematocrit | -0.017 | 0.562 | Smoking | 0.3123146 | 0.354 |
| Hemoglobin | -0.1 | 0.724 | Diabetes | 0.0980716 | 0.104 |
| Platelet count | 0.018 | 0.532 | Other underline disorders | 0.0904762 | 0.465 |
| Absolute lymphocyte count | -0.057 | *0.044 | Sore throat | 0.0591151 | 0.64 |
| Absolute neutrophil count | 0.061 | *0.033 | Runny noise | -0.1446846 | 0.253 |
| Calcium | -0.055 | 0.055 | Loss of smell | 0.0335175 | 0.811 |
| Phosphorus | -0.02 | 0.476 | Loss of taste | -0.1192558 | 0.414 |
| Magnesium | -0.033 | 0.243 | Dyspnea | 0.4443414 | *0.017 |
| Sodium | -0.015 | 0.59 | Oxygen therapy | 0.460136 | *0.008 |
| Potassium | 0.015 | 0.607 | Pneumonia | 0.2690936 | 0.115 |
| Bun | -0.059 | *0.038 | Fever | 0.0241734 | 0.842 |
| Total bilirubin | -0.003 | 0.915 | Chill | 0.0269847 | 0.824 |
| Asp | 0.054 | *0.033 | Muscular pain | 0.0885438 | 0.466 |
| Alt | 0.047 | *0.027 | GI complications | -0.20181 | 0.179 |
| Albumin | 0.024 | 0.394 | Headache | -0.0297449 | 0.831 |
| Glucose | 0.017 | 0.552 | Vomit | 0.0525788 | 0.696 |
| Ldh | 0.056 | *0.049 | Nausea | 0.0083105 | 0.949 |
| Activated partial thromboplastin time | -0.036 | 0.213 | ESR | 0.04 | 0.157 |
| Prothrombin time | 0.01 | 0.714 | Hyper sensitive troponin | -0.2146846 | 0.439 |
| Alkaline phosphatase | -0.003 | 0.929 | C-reactive protein | 0.0258788 | 0.196 |
Key Diagnostic Criteria at P-Value < 0.05
4.3. Model Development
In this study, to construct the ICU admission prediction model, we used five classification algorithms, namely ANN, KNN, SVM, DT, and RF, with k-fold (k = 10) cross-validation methods. The mean metrics of 10-fold cross-validation methods were measured. Table 4 shows the 10-fold cross-validation results of five classifiers.
| Evaluation Criteria | Classifier | ||||
|---|---|---|---|---|---|
| ANN | DT | KNN | SVM | RF | |
| Best time to build a model (s) | 38 | 22 | 27 | 14 | 31 |
| Correctly classified instances | 1,747 | 1,654 | 1,783 | 1,637 | 1,885 |
| Incorrectly classified instances | 148 | 241 | 112 | 258 | 10 |
| Mean accuracy (%) | 92.2 | 87.3 | 94.1 | 86.4 | 99.5 |
| Mean specificity (%) | 96.8 | 85.4 | 88.7 | 87.5 | 99.7 |
| Mean sensitivity (%) | 87.6 | 89.3 | 99.5 | 85.3 | 99.4 |
Average Performance of Ten Independent Runs of Classifiers Based on 10-Fold Cross-validation
4.4. ANN Configuration
In this structure, according to Table 5, the input data consisted of 57 variables, two hidden layers with ten and five neurons, and two outputs (configuration: 57-10-5-2).
| Model | Parameters | Values |
|---|---|---|
| ANN | Grid weights | Random (between 1 and -1) |
| Network error | According to MSE | |
| Training ratio | 0.7 | |
| Validation ratio | 0.15 | |
| Test ratio | 0.15 | |
| Optimization | Using Trainlm, which is a network training function that updates weight and bias values according to Levenberg-Marquardt optimization | |
| Maximum epochs | 1000 | |
| Maximum training time | Inf | |
| Performance goal | 0 | |
| Minimum gradient | min_grad: 1e-07 | |
| Maximum validation checks | max_fail: 6 | |
| Mu | 0.001 | |
| Mu decrease ratio | mu_dec: 0.1 | |
| Mu increase ratio | mu_inc: 10 | |
| Maximum mu | mu_max: 10000000000 |
ANN Configuration
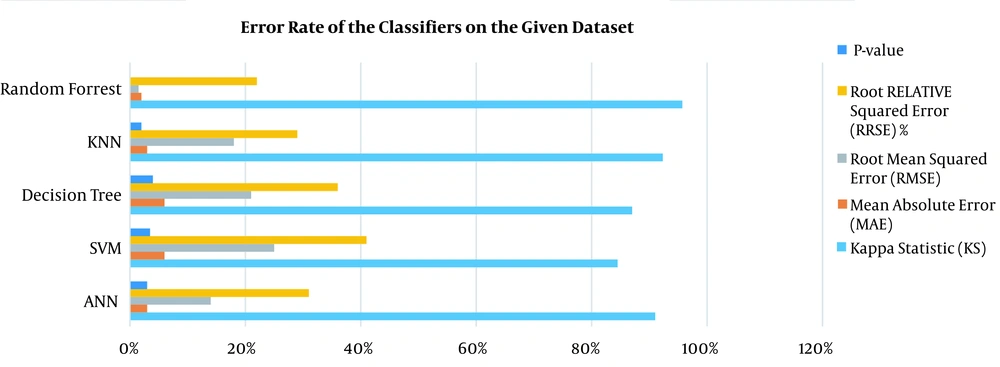
According to the experimental results of evaluating selected ML models in 10-iterations, the KNN algorithm (with K = 5) had 94.1% accuracy, 88.7% specificity, and 99.5% sensitivity. After running ANN, the algorithm achieved an accuracy of 92.2%, a specificity of 96.8%, and a sensitivity of 87.6%. The RF algorithm showed high performance with 99.5% accuracy, 99.7% specificity, and 99.4% sensitivity. The SVM algorithm had 87.5%, 85.3%, and 86.4% specificity, sensitivity, and accuracy, respectively. Furthermore, the DT algorithm demonstrated 87.3% accuracy, 85.4% specificity, and 89.3% sensitivity. Based on the analysis of variance, the five selected algorithms were significantly different (P < 0.05). The error rate of classifiers and computation time of implemented models on the given dataset are shown in Figure 3.
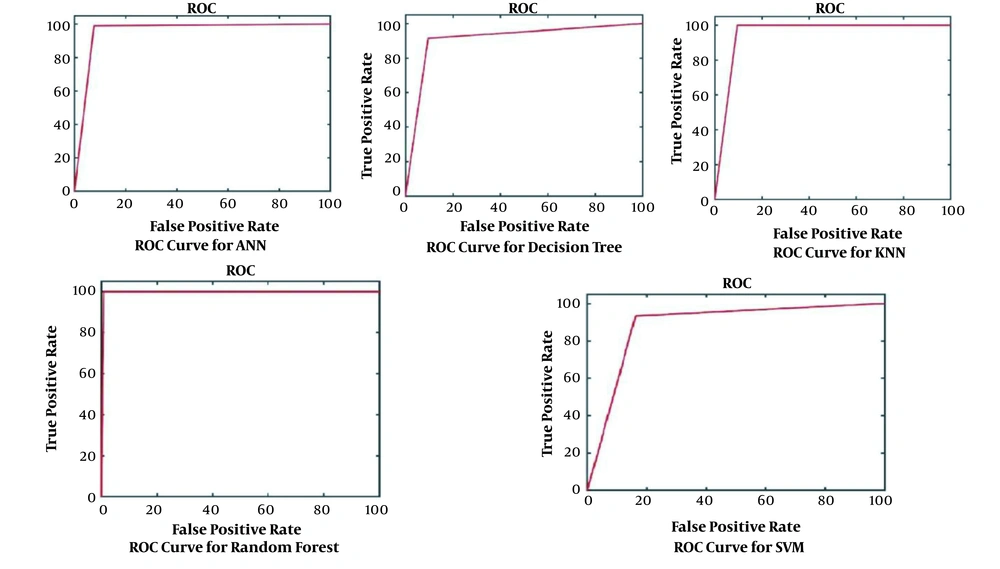
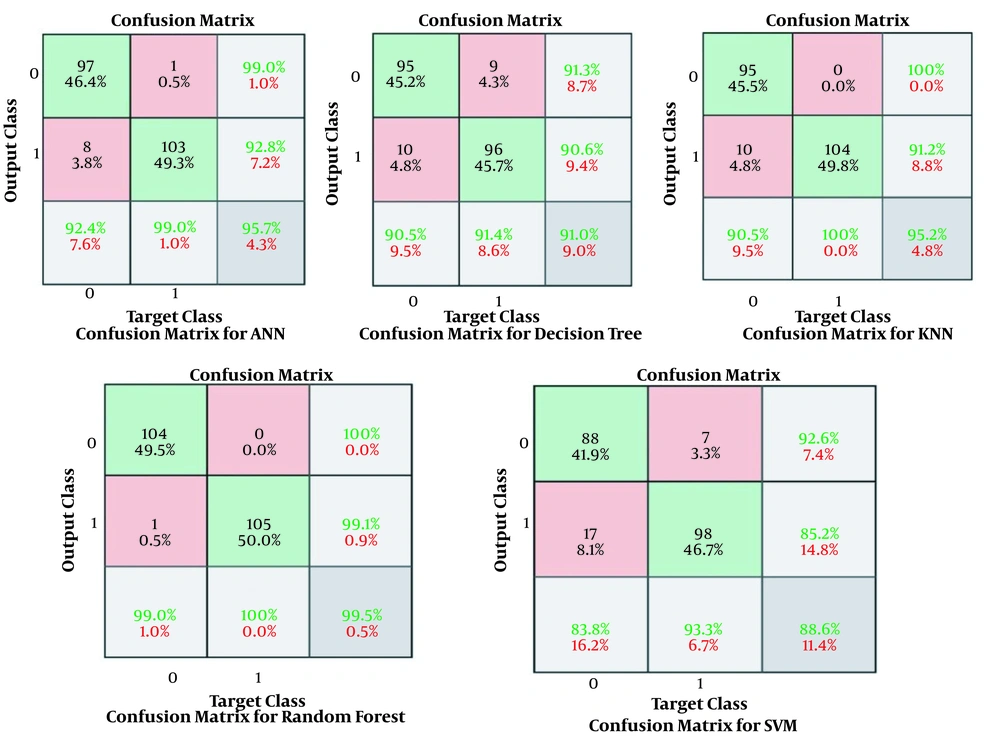
The results obtained for the error rate of selected classifiers revealed that the RF algorithm had the highest Kappa metric of 95.7%. In addition, it has the lowest MAE (0.02), RMSE (0.015), and RRSE (22%). The results of comparing confusion matrix metrics and area under the curve (AUC)-ROC of different classifiers are shown in Figures 4 and 5.
According to Figures 4 and 5, the RF algorithm was the best classifier for predicting ICU admission based on evaluation criteria. The SVM algorithm has the best computation time of processing with 14 s. The results for ten independent runs of RF are summarized in Table 6.
| Run | Accuracy | Specificity | Sensitivity |
|---|---|---|---|
| 1 | 99.1425 | 99.5817 | 99.77514 |
| 2 | 99.2141 | 99.458 | 99.8541 |
| 3 | 99.3236 | 99.6745 | 99.75114 |
| 4 | 99.2451 | 99.8542 | 99.347 |
| 5 | 99.6173 | 99.5841 | 99.471 |
| 6 | 99.657 | 99.37414 | 99.3445 |
| 7 | 99.4235 | 99.335 | 99.5457 |
| 8 | 99.741 | 99.421 | 99.247 |
| 9 | 99.2351 | 99.9524 | 99.741 |
| 10 | 99.541 | 99.3541 | 99.8242 |
| Std | 99.41402 | 99.55891 | 99.59008 |
| Min | 0.212369 | 0.21395 | 0.226258 |
| Max | 99.1425 | 99.335 | 99.247 |
| Mean | 99.741 | 99.9524 | 99.8541 |
Performance of RF in Ten Independent Runs
5. Discussion
Given the heterogeneity of the clinical manifestations of COVID-19, it is critical to develop models for predicting the likelihood of ICU admission by ML techniques. This study created five ML-based models using the most relevant variables in determining the risk of ICU admission derived from a correlation coefficient analysis. The techniques used herein included ANN, DT, KNN, SVM, and RF, which were trained through the most significant predictors from 1225 laboratory-confirmed COVID-19 patients at the time of admission. Finally, based on our analysis of selected algorithms, we found that RF with a mean accuracy of 99.5%, a mean specificity of 99.7%, and a mean sensitivity of 99.4% have better performance than other ML algorithms in predicting the probability of ICU transfer after hospital admission.
In the ICU, the need for informed decision-making is critical, especially in crisis circumstances, such as the current COVID-19 pandemic, where the healthcare systems encountered an increasing surge of patients and severe shortage in hospital resources (21, 22). The models developed in this study could be simply computerized as an alternative to manual and subjective clinical assessment methods. To correctly extract clinical predictors for estimating the potential need for ICU services, we evaluated clinical features at the time of admission and not at the progressive/severe course of the disease. In addition, the critical patients at admission time were discarded from the analysis. Thus, if validated, these features could be applied for predicting the likelihood to enter in ICU at the first hospitalization. For this purpose, Feature selection is a significant step to prepare the data before entering into the model (23). Hence, we identified the most important variables (n = 11) through correlation coefficient at P-value < 0.05. The most significant predictors of ICU admission were older age, high creatinine, leukocytosis, increased BUN, elevated ASP/ALT, augmented LDH, dry cough, hypertension, cardiovascular disorders, diabetes, dyspnea, decreased SPO2, pneumonia, and high C-reactive protein.
Many studies have focused on determining the key risk factors for ICU admission (8, 9, 11, 13, 24, 25). The ten top clinical variables predicting ICU risk in reviewed studies encompassed age (older age), body temperature (high), oxygen saturation (decreased), neutrophil count and lymphocyte count (raised), C-reactive protein (elevated), D-dimer (increased), ALT and/or AST (augmented), LDH (elevated), loss of consciousness, and hypertension/cardiovascular diseases. In general, high compliance was observed between the results of reviewed studies and the most common variables in the current study.
In general, the developed ML algorithms in this study, similar to those reported in the previous studies (26), have achieved optimum results with an accuracy range of 86.4% - 90.37%. In particular, the experimental findings showed that RF had the best performance compared to the other four ML techniques with the mean accuracy of 99.5%, mean specificity of 99.7%, mean sensitivity of 99.4%, Kappa metric of 95.7%, and RMSE of 0.015. According to the results of the previous studies, the ANN and RF techniques have the most remarkable performance in predicting COVID-19 outcomes, which is consistent with the present study.
As a screening instrument for the development of severe disease, model developed in our study has several opportunities for clinical use. These models decrease the existing uncertainty and ambiguity in COVID-19 clinical practice by presenting measurable, non-subjective, and evidence-based approaches (12, 18). Accurate ICU admission prediction can support the sharing of limited hospital resources and improve the quality of care along with patient survival chance (12). The timely identification of at-risk patients could diminish the need for imminent ICU beds and invasive mechanical ventilators. Moreover, using proposed model in present study can surge the tolls of timely ICU transfers, resulting in reduced mortality and shorter lengths of ICU stay. Designing a scientific and valid ML-based prediction model would assist in early detection and effective supportive intervention to improve patient outcomes, the quality of care, and ultimately a reduction in the mortality rate of COVID-19 patients. Ambiguity declines due to offering quantitative, objective, and evidence-based models for risk stratification, prediction, and care planning (9, 10).
This study had several limitations. First, we retrospectively analyzed a dataset without control over data fields or incomplete data. Second, the dataset was extracted from a single hospital with a low sample size of 1225, making the results ungeneralizable. Third, this study only included 11 clinical features at admission to the hospital. It does not mean that these should be the only criteria for determining ICU admission. Longitudinal changes in these clinical features need to be investigated. Moreover, we only used five ML algorithms for prediction analyses. Finally, the selected dataset lacked some critical clinical variables, such as radiological indicators. In the future, the performance accuracy of our model and its generalizability will be enhanced if we test more ML techniques for larger, multicenter, and prospective datasets equipped with more qualitative and validated data.
5.1. Conclusions
We trained and validated different ML algorithms to predict the need for ICU transfer in COVID-19 hospitalized patients based on the data collected easily and routinely at the time of hospital admission. This study first identified the highly ranked clinical predictors that can predict the likelihood of ICU admission more precisely. Second, we developed and compared five ML-driven prediction models based on these selected predictors. It was observed that the RF model performed best on classification accuracy compared to the other ML algorithms. This method has the potential to provide frontline clinicians with an objective instrument to manage COVID-19 patients more efficiently in such time-sensitive, resource-demanding, stressful, and potentially resource-constrained situations. Finally, the results of comparing the performance of prediction models in this study were satisfactory to some extent, and we believe that further investigations are needed to validate our model for a larger, multi-central, and more qualitative dataset.
