1. Background
Magnesium sulfate has a wide variety of impact on the physiological processes in the human body. Neuro-protective effect of magnesium sulfate has been one of the most challenging aspects of this drug. In animal studies, magnesium showed reduction in glutamate release and prevented ischemic injury that led to protection of neuronal cells (1, 2). Magnesium also inhibits calcium entry into the cell via a noncompetitive blockade of the N-Methyl-D-aspartic acid (NMDA) receptor. Magnesium and the NMDA receptor are thought to be involved in the modulation of pain (3). Magnesium is also a physiological calcium antagonist at different voltage-gated channels, which may be important in the mechanisms of anti-nociception (4). The CNS depressant effect of anesthetic agents may be potentiated when they are used concurrently with magnesium sulfate (5, 6).Therefore, intravenous and intrathecal injection of magnesium sulfate has been used as an adjuvant in anesthesia (7-11). Magnesium sulfate also has been used in clinical practice as an anti-inflammatory and neuro-protective treatment following traumatic brain injury, seizure, subarachnoid hemorrhage, and cerebral ischemia (12). In addition, anti-inflammatory effects of magnesium sulfate administration were evaluated in coronary artery bypass patients (13).
2. Objectives
As far as our knowledge, no study dealt with anti-inflammatory effect of magnesium sulfate administration in normo-magnesemic neurosurgical patients. Therefore, we have designed this study based on this hypothesis that high doses of magnesium sulfate infusion may be effective for the reduction of inflammation in elective brain tumor surgeries.
3. Patients and Methods
This double-blind randomized controlled study was conducted in Sina hospital between September 2012 and February 2014. After approval of the Ethics committee of the Tehran University of Medical Sciences, the written informed consents were obtained from all patients prior to entry into the study. The study was registered in Iranian registry web-site for clinical trials by IRCT201204159475N1 code. The study included sixty adult patients of both genders with American Society of Anesthesiologists (ASA) physical status I and II undergoing elective craniotomy for microsurgery of supratentoral tumors for the first time. Patients with significant organ dysfunctions (e.g. cardiac, respiratory, neurologic, renal, or liver disorders), morbid obesity or those who were on calcium channel blocker treatment were excluded from the study. In a randomized fashion using computer software, the patients were divided into the magnesium (intervention) versus normal saline (control) groups. The age, sex, and weight of all patients were recorded. In the intervention group, two days before surgery, five grams MgSO4 (10 mL of 50% solution in 1 liter of normal saline) was infused during six hours and the day before surgery five grams of MgSO4 again was infused during six hours. In the third day at operating room and during surgery, the same amount was infused within six hours from the start of surgery. All the patients in the control group have received the same amount of saline solution as a placebo. All bottles of fluids were the same shape and in hospital’s pharmacy the same label has been stuck on all bottles to keep the blinding process. The anesthesia team that was responsible for intra-operative management was blinded to the type of fluids infused to the patients. It should be mentioned that an infusion pump was used for infusion of magnesium and placebo for all patients at the rate of 2.7 mL per minute. At the operating room, all the standard monitoring including heart rate (HR), invasive blood pressure (IBP), electrocardiographic study (ECG), oxygen saturation (SpO2), end-tidal CO2 (EtCO2) and core temperature measurements were applied for all patients. For Bi-spectral index (BIS), two electrodes were attached to forehead of all patients and connected to the monitoring system. Induction of anesthesia was carried out with IV injection of fentanyl (2 μg/kg) and midazolam (0.05 mg/kg), followed by propofol (1.5-2 mg/kg) and atracurium (0.5mg/kg). Maintenance of anesthesia was performed using continuous infusion of propofol (6-8 mg/kg/h) and fentanyl (1-2 μg/kg/h) and adjusted to maintain the BIS value within the pre-defined range (40-60) and the hemodynamic parameters were kept within (30%) of the preoperative base line values. Muscle relaxation was kept by intermittent bolus injection of atracurium. After induction of anesthesia, frequent sampling for blood gas analysis was performed according to clinical indications. Measuring serum CRP levels in three time points was our primary objective; therefore, three blood samples were collected: the first sample was obtained just before starting of magnesium or placebo infusion, the second sample was taken the day after surgery and the third sample was prepared two days after the surgery in all patients. Serum CRP levels were measured by enzyme linked immunoassay kit (Labor Diagnostica Nord). As the secondary outcome hemodynamic parameters including mean arterial blood pressure (MAP) and HR, total propofol requirements, blood loss, and duration of anesthesia (from the time of induction to the withdrawal of anesthetics) were all recorded.
3.1. Statistical Analysis
All statistical analysis was done using SSPS (version 17, Chicago, IL) and statistical significance was defined as P < 0.05. Thirty patients were included in each group based on setting alpha to 0.05 and beta to 0.20. Chi Square and t-Test were used to compare the categorical variables between both groups. Pearson's correlation analysis was performed to determine interrelations among CRP measurements. Sphericity assumption was checked by Mauchly test before comparisons. Because of multiple measurements of serum CRP levels along the study time we used repeated-measures analysis of variance (ANOVA).
4. Results
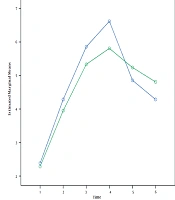
Sixty patients were enrolled in this study with rather similar demographic characteristics in both groups (Table 1). Table 2 and Figure 1 show that the serum CRP levels increased slightly from the first sample (obtained before commencement of the study) to the second sample (one day after surgery) in both groups; then the values of CRP levels decreased a little from second to the third sample; although none of those changes were statistically significant (P = 0.435). The mean intra-operative HR and MAP was significantly lower in magnesium group as compared with the control group. The mean intra-operative blood loss was also significantly lower in the magnesium group in comparison to the control group. The mean anesthetic requirement (propofol) that was used during surgery in magnesium group was significantly lower in comparison with the control group (Table 3).

Figure 1.
Comparison of C - reactive protein Levels between the Two Groups
Table 1. Patient Characteristics in Two Groups a
| Variable | Mg Group (30) | Control Group (30) | P Value |
|---|---|---|---|
| Age, y | 51.5±5.7 | 53.2 ± 6.2 | ≥ 0.05 |
| Sex | ≥ 0.05 | ||
| Male | 13 | 14 | |
| Female | 17 | 16 | |
| Weight, kg | 80 ± 6 | 78 ± 5.7 | ≥ 0.05 |
| Duration of Anesthesia, min | 220 ± 7.2 | 242 ± 9.3 | ≥ 0.05 |
aAbbreviation: Mg, magnesium.
aAbbreviations: CRP, C-reactive protein; SE , standard error.
bP Value for time and group interaction.
c Dimension is n g/mL.
Table 3. Comparison of Intraoperative Variables in Two Groups a
| Variable | Mg Group (30) | Control Group (30) | P Value |
|---|---|---|---|
| MAP, mmHg | 71.3 ± 4.3 | 84.5 ± 5.6 | 0.03 |
| HR, per minute | 68 ± 4.6 | 78 ± 5.7 | 0.04 |
| Bleeding, mL | 470 ± 34 | 685 ± 69 | 0.002 |
| Propofol 1%, mL/hr | 46.9 ± 5.6 | 58.7 ± 6.8 | 0.001 |
aAbbreviations: MAP, mean arterial pressure; Mg, magnesium; HR, heart rate.
5. Discussion
The present study indicates that magnesium sulfate reduced both the heart rate and mean arterial blood pressure throughout the operative time. We were going to keep the hemodynamic parameters very near to the base line values and also BIS values within a predefined range (40-60). Thus, the propofol infusion rate was adjusted according to the parameters observed in monitoring devices. This can explain why we have needed less amount of propofol infusion rate in the intervention group. It has been suggested that, when MgSO4 is co-administered with propofol, it potentiates its anesthetic effect (14). A probable mechanism by which we can explain such adjunctive effect of magnesium infusion may be the reduction of catecholamine release through reduced sympathetic outflow. It has also been shown that administration of magnesium led to significant reduction in the requirements for anesthetic drugs during total intravenous anesthesia (TIVA) with propofol, remifentanil and vecuronium (10, 14). The result of the current study supported this concept that magnesium administration may be a useful adjunct to propofol anesthesia. The significant reduction of blood loss might be due to the more stable hemodynamic profile and lower mean arterial blood pressure that occurred in the magnesium group and so less blood transfusion was required in this group. C-reactive protein (CRP) has been used as an indicator of inflammatory processes. However, its expression is not specific and it will increase after routine neurosurgical procedures despite absence of any clinical or laboratory signs of infection. It also has been found that CRP level reaches to a peak level during the first 48 h after surgery and then it decline (15). However, there is some conflicting evidence about anti-inflammatory effects of magnesium. Magnesium infusion reduced cytokine production in intra-partum women except term and preterm neonates. It has also been demonstrated that magnesium may have beneficial effects in those at risk for inflammation-associated adverse perinatal outcomes (16). The result of the current study contradicts to the above-mentioned studies. In agreement with our results, Mirrahimi et al. have shown that in traumatic patients with systemic inflammatory response syndrome (SIRS) , no evidence of anti-oxidative and anti-inflammatory effects of magnesium was seen (17).
5.1. Limitation
This fact should not be ignored that we use CRP as a marker for tracing inflammation in the patients, because it is more accessible and is less expensive. It is probable that we would have obtained an entirely different result, if we had used new and more sensitive markers of inflammation such as interleukins. Thus, we may suggest use of more sophisticated laboratory biomarkers in future studies. In conclusion, this study could not show conclusive evidence for anti-inflammatory effects of magnesium sulfate in craniotomy for microsurgery of intracranial tumors using CRP level changes. However, use of magnesium sulfate during anesthesia might be suggested as a safe anesthetic adjuvant in neurosurgical anesthesia.