
1. Background
Suicidal thoughts among adolescent girls are associated with multiple psychosocial problems, including depression, anxiety, attention, and behavioral issues (1). The risk of suicide among adolescent girls has created a mental health crisis, with suicidal thoughts being more common among adolescent girls than among boys (2). A 2021 study found that 30 percent of female high school students had suicidal thoughts in the past year, compared to 14.3 percent of male students (3). Suicidal thoughts is a broad term used to describe a range of thoughts, wishes, and preoccupations with death (4). Suicide is a global phenomenon and ranks as the second most common cause of premature death in people aged 14 to 29 (5). A study reported the prevalence of suicidal ideation among adolescents to be 12.6% (6). The increase in suicidal thoughts in adolescents highlights the need to explore recent contributing factors.
Conflict between parents and adolescents is one of the most important predictors of mental disorders and emotional and psychological conditions linked to suicidal thoughts. Adolescent conflict with parents refers to disagreements and arguments that arise within the parent-child relationship, including verbal aggression (7). Types of adolescent conflict with parents include intensity, frequency, and harm level (8, 9). Issues of conflict arise when adolescents seek independence in decision-making, which parents often suppress through control (8). In attachment theory, secure attachment formed by parents acts as a protective factor against suicidal thoughts in adolescence (10). Conflict with parents undermines attachment. A study of 2,000 adolescents showed that parents and adolescents experience emotional rejection; this rejection factors into depression and conditional affection, both linked to suicidal thoughts. This study has shown that adolescent conflict with parents and poor peer relationships are effective factors in suicidal thoughts (11).
Recent studies have shown that using machine learning to predict suicidal thoughts can identify related causes. A 2021 study at the University of Cambridge found that interpersonal conflict predicted next-day suicidal thoughts, with the algorithm achieving strong predictive accuracy (12). Another study, using a large-scale machine learning analysis of high school students, found that family conflict predicted suicidal behavior, with frequent arguments, yelling, insults, and unresolved disputes as key predictive variables (13). Adolescents exposed to family arguments had a 90.6% sensitivity for predicting suicide attempts (14).
2. Objectives
Given the importance of the topic and the gap in Iranian studies, the aim of the present study is to use machine learning algorithms to predict suicidal thoughts in adolescent girls, focusing on parent-adolescent conflict as the main variable. This study, by combining psychological data, attempts to provide an accurate and reliable model for identifying adolescents at risk. This study seeks to fill the gap in the study literature, which has so far rarely addressed the use of machine learning in analyzing family conflicts and its consequences.
3. Methods
3.1. Participants
The descriptive-analytical cross-sectional study included 442 adolescent girls from Tehran, selected via convenience sampling. Participants were aged 11 - 19, literate, and provided informed consent. Data were collected through questionnaires. Those unwilling to participate or with incomplete questionnaires were excluded. Confidentiality and anonymity were ensured.
3.2. Measures
3.2.1. The Beck Scale for Suicidal Ideation
3.2.2. The Conflict Behavior Questionnaire
Conflict-Behavior Questionnaire (CBQ), designed by Prinz et al., has a full 75-item and a 20-item short form assessing adolescents’ perceptions of conflict with parents. Separate forms for mother and father. Reliability is 0.57 (adolescents) and 0.82 (parents) (17). standardized in Iran by Asadi Younesi et al. with Cronbach's alpha 0.82 (18).
3.3. Procedure
Ethical approval was obtained from Shahid Beheshti University of Medical Sciences (IR.SBMU.RETECH.REC.1403.273). Using convenience sampling, 442 adolescent girls from Tehran were selected. Participants were informed about confidentiality, and consent was obtained from both them and their parents. They completed paper questionnaires on suicidal thoughts BSSI and parent-child CBQ. Data were analyzed using descriptive statistics and machine learning models. Python, Pandas, and Scikit-learn were used for data processing and modeling.
4. Results
To examine the relationship between parent-adolescent CBQ and suicidal thought severity BSSI, Pearson correlation coefficients were calculated. Results showed correlations ranged from 0.01 to 0.259. The highest correlation was between CBQ item 12 (parent perceived) and BSSI item 5 (no suicidal thoughts), r = 0.259. Relatively high correlations were also found between CBQ items 19, 20, and 16 with BSSI items 2, 1, and 14, respectively. About 25 correlations exceeded 0.15, indicating moderate and significant relationships, though most coefficients were weak (below 0.15).
To examine the relationship between parent-adolescent conflict and suicidal thought severity, Pearson’s correlation coefficients were calculated between CBQ and BSSI items. Table 1 shows significant positive correlations above 0.15, ranging from 0.152 to 0.259, indicating weak to moderate links. The highest correlation was between CBQ item 12 and BSSI item 15 (no suicidal thoughts) with r = 0.259, indicating a stronger association. CBQ items 16 (inconsistency), 17 (yelling), 15 (complaining), and 19 (support in crisis) also showed notable correlations with BSSI items. These results suggest certain parent-child interaction elements, especially support or conflict, significantly relate to suicidal thought severity or planning (Table 1).
Table 1.
Selected Conflict Behavior Questionnaire-Beck Suicidal Ideation Scale Correlations (r > 0.15)
| BSSI Item | CBQ Item | Correlation (r) |
|---|---|---|
| BSSI5 | CBQ12 | 0.259 |
| BSSI2 | CBQ16 | 0.254 |
| BSSI5 | CBQ17 | 0.231 |
| BSSI1 | CBQ16 | 0.205 |
| BSSI14 | CBQ19 | 0.195 |
| BSSI14 | CBQ20 | 0.178 |
| BSSI2 | CBQ15 | 0.174 |
| BSSI15 | CBQ19 | 0.172 |
| BSSI1 | CBQ15 | 0.168 |
| BSSI18 | CBQ19 | 0.166 |
| BSSI5 | CBQ6 - We get angry with each other (≥ 3/week) | 0.165 |
| BSSI13 | CBQ17 | 0.163 |
| BSSI5 | CBQ20 | 0.161 |
| BSSI16 | CBQ20 | 0.157 |
| BSSI17 | CBQ19 | 0.152 |
Abbreviations: CBQ, Conflict Behavior Questionnaire; BSSI, Beck Suicidal Ideation Scale.
To assess the predictive performance of machine learning models in identifying suicide risk based on parent-child conflict (CBQ items), four classification algorithms were evaluated: Logistic regression, support vector machine (SVM), random forest, and XGBoost. Participants were divided into two classes according to their total BSSI scores: Class 0 for low suicide risk (BSSI ≤ 8), and class 1 for high suicide risk (BSSI > 8).
Performance metrics included accuracy, precision, recall, and F1-score, reported separately for each class. The definitions are as follows:
- Precision: The proportion of predicted positives that are truly correct.
- Recall (sensitivity): The proportion of actual positives correctly identified by the model.
- F1-score: The harmonic means of precision and recall, especially useful for imbalanced datasets.
- Support: The number of true instances in each class in the test set.
- Accuracy: The overall percentage of correctly classified instances.
- Macro average: The unweighted mean of precision, recall, and F1 across both classes.
- Weighted average: The mean of each metric weighted by the number of instances in each class (support) (Table 2).
Table 2.
Performance of Classification Models on Suicide Risk Prediction
| Model | Accuracy (%) | Precision (Class 0) | Recall (Class 0) | F1 (Class 0) | Precision (Class 1) | Recall (Class 1) | F1 (Class 1) |
|---|---|---|---|---|---|---|---|
| Logistic regression | 78.79 | 0.72 | 0.87 | 0.79 | 0.87 | 0.72 | 0.79 |
| SVM | 78.79 | 0.70 | 0.93 | 0.80 | 0.92 | 0.67 | 0.77 |
| Random forest | 78.79 | 0.72 | 0.87 | 0.79 | 0.87 | 0.72 | 0.79 |
| XGBoost | 69.70 | 0.62 | 0.87 | 0.72 | 0.83 | 0.56 | 0.67 |
All models except XGBoost achieved an overall accuracy of 78.79%. The SVM model had the highest recall for class 0 (0.93), while logistic regression and random forest showed similar performance across all metrics. Table 3 summarizes the macro-averaged precision, recall, and F1-scores across both classes for each model.
Table 3.
Macro-averaged Performance Metrics
| Model | Macro Precision | Macro Recall | Macro F1-Score |
|---|---|---|---|
| SVM | 0.81 | 0.80 | 0.79 |
| Logistic regression | 0.79 | 0.79 | 0.79 |
| Random forest | 0.79 | 0.79 | 0.79 |
| XGBoost | 0.73 | 0.71 | 0.69 |
Figure 1 illustrates the overall accuracy comparison of the four models. As shown, logistic regression, SVM, and random forest achieved the same level of accuracy at 78.79%, while XGBoost performed with lower accuracy at 69.70%.
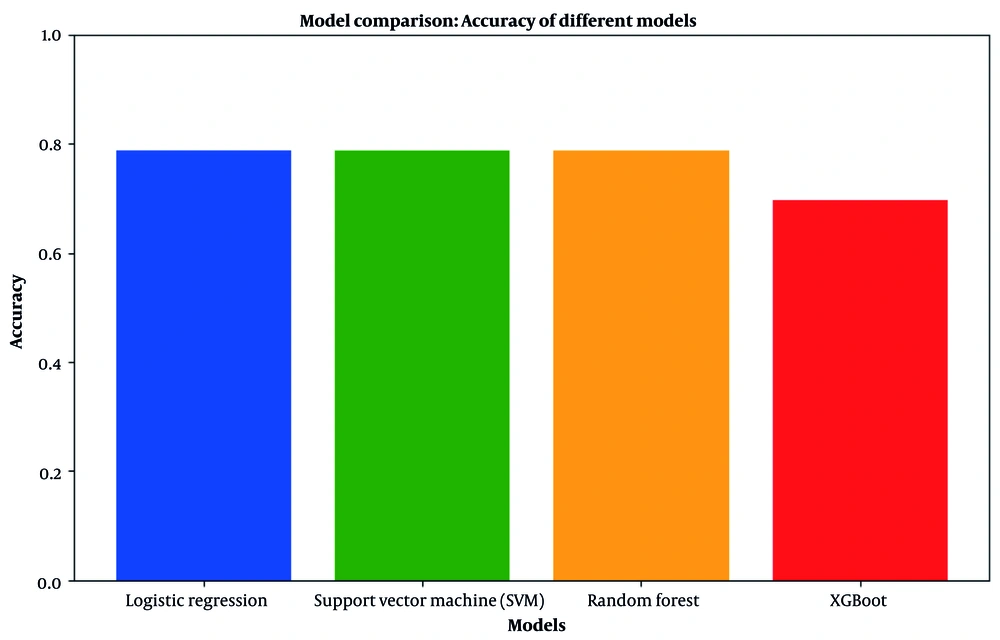
Figure 1.
Comparison of classification accuracy among models
5. Discussion
The results of this study highlight a significant association between parent-child conflict and suicidal thoughts among adolescents. Specifically, certain CBQ items demonstrated moderate correlations with CBQ item 16 (inconsistency) and BSSI item 2 (desire to live) (r = 0.254). Moreover, items reflecting perceived parental support — such as CBQ12 and CBQ19 — also showed meaningful associations. These findings suggest that both emotional disconnection and unresolved conflict may serve as significant predictors of suicidal thoughts in adolescents.
The correlation analysis between CBQ and BSSI items revealed a set of consistent associations, suggesting that the conflictual parent-child relationship is moderately (0.254) related to the presence of suicidal thoughts. Certain CBQ items, such as “my parent understands me” (CBQ12), showed the strongest relationships with suicidal indicators. Perceived parental support and unresolved conflicts may function as significant predictors of suicidal thoughts. For example, a 2024 study found that adolescents experiencing high levels of unresolved conflict with their parents exhibited a greater risk of suicidal thoughts, whereas those with strong parent-child attachment, reflecting perceived parental understanding and support, showed lower risk (19). Conversely, a longitudinal study with a three-month follow-up found no significant association between parent-child conflict and suicidal ideation (11). The discrepancy between this finding and the present study may be attributed to differences in study design, sample characteristics, and the duration of follow-up, highlighting the complexity of familial influences on adolescent suicidality. According to the interpersonal theory of suicide, negative interpersonal experiences, such as unresolved conflicts with parents, increase feelings of non-belonging and ineffectiveness and provide the basis for suicidal thoughts (20). To further interpret the findings, the correlation results have been organized into seven analytical themes.
In this section, based on the correlation coefficients between the items of the CBQ (parent-child conflict) and the items of the BSSI Questionnaire (severity of suicidal thoughts), meaningful patterns have been identified that can be used to psychologically explain the risk of suicide. The analyses have been categorized into seven categories:
Consistent correlation patterns between CBQ and BSSI items: Some family indicators exhibit consistent associations with multiple BSSI items in a wide range of suicidal thoughts and tendencies. The most important indicator is item 19 of the CBQ (support in crisis situations), which has a relatively high correlation (up to 0.211) with several suicidal thought items. Also, CBQ item 20 (enjoyment of being with parents) has a strong presence in several items, such as BSSI item 15, BSSI item 14, and BSSI item 17. On the other hand, CBQ item 16 is also seen as a negative recurrent indicator in most analyses. These recurrences indicate that some parent-child interactional components play a decisive role in the formation or inhibition of suicidal thoughts.
5.1. Beck Suicidal Ideation Scale Sensitivity to Parent-Child Conflict
Different BSSI items vary in sensitivity to parent-child conflict. Items like BSSI 5 (I have no suicidal urges) and BSSI 2 (I want to be alive) show the strongest correlations with family variables, especially CBQ 12 and CBQ 16. This indicates that basic thoughts about life are more influenced by parent-child conflict than cognitive or temporal aspects.
5.2. Positive vs. Negative Parent-Child Effects
A comparison of positive and negative CBQ items showed that destructive parent-child relationships have a stronger effect on increasing suicidal thoughts. For instance, CBQ item 16 had a 0.254 correlation with BSSI item 2, and CBQ item 17 had 0.231 with BSSI item 5. Supportive indicators showed weaker associations, suggesting that chronic conflict is a stronger predictor of suicidal risk than lack of support (21).
5.3. Contradictions in Supportive Indicators
In some cases, positive indicators like CBQ items 12 and 19 showed unexpected positive correlations with BSSI items related to suicidal intent and planning. This suggests the presence of conflicted or dysfunctional relationships, where support exists but emotional distress remains. Thus, perceived emotional quality matters more than the presence of support alone (17).
5.4. Core Family Indicators for Action
CBQ items 16, 17 (arguing), and 15 (complaining) showed the strongest correlations with BSSI risk indicators, making them key targets for family intervention. In contrast, CBQ item 12 played a notable role in reducing suicidal tendencies, particularly in relation to BSSI item 5.
5.5. Dual Nature of Parent-Child Ties
Some analyses found that supportive indicators like CBQ items 19 and 20 were positively correlated with suicidal tendencies alongside negative items like CBQ 1 (not being understood) and 17 (screaming). This suggests that ambivalent relationships — where affection coexists with pressure — can create emotional conflict and increase suicide risk.
5.6. Predictive Variation Across Beck Suicidal Ideation Scale
Sequential analysis of BSSI items showed that parent-child relationships have stronger influence in early suicidal ideation (items 1 - 5), while mid-range items (6 - 11) reflect more individual factors. In later stages (items 12 - 19), supportive indicators regain some influence. Thus, family-based interventions are most effective early and should be combined with specialized care in advanced stages.
This study confirms that machine learning models can accurately predict adolescent suicidal ideation based on parent-child conflict indicators. This aligns with Lim et al., who used national survey data from South Korea to develop models predicting suicide attempts in adolescents with high accuracy (22). In another study, Kim et al. achieved an accuracy of 0.97 in predicting suicidal thoughts using the XGBoost algorithm (23). Machine learning models can uncover emotional and cognitive patterns in adolescents by analyzing recurring CBQ responses. As per maladaptive schema theory, negative parent-child interactions may internalize beliefs like “I am worthless” or “No one loves me”, which form the basis for suicidal thoughts (24).
In this study, SVM and Random Forest outperformed XGBoost in predicting suicidal thoughts from CBQ data. This aligns with prior studies suggesting better performance of SVM and RF with small-scale psychological datasets. A systematic review found Random Forest more accurate than SVM for adolescent suicidal ideation prediction (25). Another meta-analysis study showed that Random Forest and SVM outperform XGBoost depending on the dataset and features used (26). Machine learning performance varies by algorithm structure. Random Forest and SVM are better suited for psychological data due to their ability to define decision boundaries and handle low-volume datasets (27).
Despite valuable findings, this study had limitations: Cross-sectional design prevented causal inference, reliance on self-reports introduced response bias, and limited sample size and input features may have reduced model accuracy.
Future studies should enhance prediction models by integrating family data with emotional and cognitive variables. Using multi-source data, such as parent or teacher reports, can improve external validity. Additionally, comparing machine learning models with deep neural networks is recommended.
This study’s findings have important clinical psychology and suicide prevention implications. Identifying high-risk parent-child relationship factors (e.g., incompatibility, feeling misunderstood, chronic conflict) can guide early interventions. Machine learning models can aid intelligent screening in schools and mental health centers. Family interventions improving interaction quality and empathy may reduce suicide risk.
5.7. Conclusions
Overall, the study found that unresolved parent-child conflicts and low perceived support significantly increase adolescent suicidal thoughts. Machine learning models can accurately predict this risk based on family relationship patterns. These results highlight the importance of family-focused prevention and integrated technological and therapeutic approaches in adolescent mental health.