


1. Background
Visceral leishmaniasis (VL), a systemic parasitic disease, is endemic in the Middle East and Mediterranean regions, and the northwestern and southern regions of Iran are known as the primary foci for VL (1, 2).
Leishmania is an obligatory intracellular parasite infecting macrophages of the reticuloendothelial tissues (3). Defense response and consequently resistance against Leishmania depends mainly upon Th1 cells and the secretion of cytokines activating T cells and macrophages (4). Th17 cells are independently regulated CD4 T cells, which are initially characterized as producing Interlukin-17 (IL-17) family cytokines (5). Th17 and Th1 cells may play complementary roles in the protection against Leishmania donovani (5).
A newly described IL-17 cytokine plays as a common factor between adaptive and innate immune system (6, 7). Furthermore, IL-17A plays an important role in the pathophysiology of autoimmune diseases (8, 9). Although the involvement of the IL-17 in the defensive response against certain pathogens has been shown, basic information about its production in human parasitic diseases has yet to be clarified (10).
Increased serum level of IL-17 was seen in VL patients (11). Interleukin-17 is expressed in leishmaniasis patients’ peripheral blood and tissues and an association exists between cells expressing IL-17 and the intensity of inflammatory infiltration (10).
The polymorphisms of IL-17A in different populations introduce IL-17 as a candidate gene conferring genetic susceptibility to diseases such as pediatric asthma (12), ulcerative colitis (13), rheumatoid arthritis (14), childhood asthma (15), and gastric cancer (16). However, there is no report on the association of IL-17A gene polymorphisms with visceral leishmaniasis.
2. Objectives
This study aimed at investigating whether there is any relationship between IL-17A genetic variants and the susceptibility to human VL in the Iranian population.
3. Methods
3.1. Study Population
The study group consisted of 77 Iranian pediatric patients with VL from Fars province, southern Iran. The diagnosis was made considering clinical signs and symptoms, the serological test (IFA ≥ 1/128), and the direct observation of the Leishman body in their bone marrow aspirate stained smears.
The control group consisted of 125 randomly selected healthy individuals from the same area. Blood samples were collected after obtaining informed written consents from the children’s parents. The study design was approved by the Ethics Committee of Shiraz University of Medical Sciences, Shiraz, Iran.
3.2. SNPs Selection and Genotyping
Genomic DNA was extracted using the salting out method. The tagging SNPs of IL-17A genomic region and upstream 1500 base pair bands were selected according to the Seattle SNPs website (http://pga.mbt.washington.edu/education.html). The Seattle SNPs database showed 12 polymorphisms [minor allele frequency (MAF) ≥ 10] in the target region. Finally, the researchers selected eight IL-17A SNPs [rs1974226 (A/G), rs2275913 (A/G), rs3748067 (A/G), rs3804513 (A/T), rs3819024 (A/G), rs3819025 (A/G), rs4711998 (A/G), and rs8193038 (A/G)] (12).
Except for rs4711998, rs2275913, and rs3819025, the researchers had to design mismatch PCR-RFLP for all other polymorphisms (17). The sequences of the primers and their related annealing temperatures are presented in Table 1.
Table 1.Polymerase Chain Reaction (PCR) Primers and Conditions for IL-17A Gene Amplifications
| SNPs/Primer Sequences | Annealing Tm (°C) | RE | Products (bp) |
|---|---|---|---|
| rs4711998 (A/G) | 53.5 | TaqI | |
| F: AGAAGGGTGACATATAGCCA | A: 322 | ||
| R: GTTAAAGGCATGTTCCAACC | G: 236 + 86 | ||
| rs3819024 (A/G) | 58 | EarI | |
| F: AAATCTCGTGTCTCTTGAACC | A: 190 + 29 | ||
| R: GATTTTCCATTTGATCTTTCTCT | G: 219 | ||
| rs2275913 (A/G) | 58 | EarI | |
| F: GCTCAGCTTCTAACAAGTAAG | A: 259 + 79 | ||
| R: AAGAGCATCGCACGTTAGTG | G: 338 | ||
| rs3819025 (A/G) | 58 | MaeII | |
| F: ACAAACTCATCCATCCCCAG | A: 296 | ||
| R: GCCCCAATATAGCTATCTTTC | G: 214 + 82 | ||
| rs8193038 (A/G) | 50 | BsrDI | |
| F: TACTGTATATGTAGGATAGGCA | A: 192 + 272 | ||
| R: TAAAGAAAAATGCCGTGGGAG | G: 219 | ||
| rs3804513 (A/T) | 55 | NlaIII | |
| F: TAACCAGAGCTGCCATTGAG | A: 258 + 21 | ||
| R: ACAGAACAGAGACTTATTTGCA | T: 279 | ||
| rs1974226 (A/G) | 58 | RsaI | |
| F: AAAGGAGCTGATGGGGCAGTA | A: 211 | ||
| R: GGTCTTTCAAGAAGCAGGGAG | G: 191 + 20 | ||
| rs3748067 (A/G) | 59 | EcoRI | |
| F: GGGCTGAACTTTTCTCATACTTAGA | G: 212 | ||
| R: GAGACATTGTCTTCAGACTACAATG | A: 198 + 24 |
3.3. Statistical Analysis
Haplotype frequency and hardy-weinberg equilibrium (HWE) were determined by the Arlequin software package, version 3.1 (University of Berne, Berne, Switzerland). The frequencies of the alleles and genotypes were manually accounted and compared between groups using chi-square test and SPSS software version 16 (IBM Corporation, Armonk, New York, USA). The frequencies of the constructed haplotypes were evaluated using the SHEsis software (http://analysis.bio-x.cn). Linkage disequilibrium parameters, such as D’, were measured using LD2SNPing v2.0 software (http://bio.kuas.edu.tw/LD2SNPing). To investigate the Hardy-Weinberg equilibrium, observed genotype frequencies were compared with the expected ones using FINETTI (http://ihg.gsf.de/cgi-bin/hw/hwa1.pl), and the Armitage trend test was used to calculate the genotype distribution for the SNPs that did not meet HWE. P values less than 0.05 were considered significant.
4. Results
The results of the allele and genotype frequencies of IL-17A gene polymorphisms in the patient and control groups are listed in Tables 2 and 3.
Table 2.The Frequencies of IL-17A Genotypes and Alleles in Patients with Visceral Leishmaniasis and Controls
| SNPs/Genotypes | Patients, No (%) | Controls, No. (%) | χ2 | P Valuea | OR (95% CI) | Study Power (%) |
|---|---|---|---|---|---|---|
| rs4711998-832 | ||||||
| AA | 5 (6.50) | 17 (13.60) | 2.48 | 0.115 | 0.44 (0.14 - 1.35) | 40 |
| AG | 35 (45.50) | 50 (40.00) | 0.58 | 0.445 | 1.25 (0.68 - 2.31) | 12 |
| GG | 37 (48.10) | 58 (46.40) | 0.05 | 0.819 | 1.07 (0.58 - 1.96) | 4 |
| A | 45 (29.20) | 84 (33.60) | 0.84 | 0.359 | 0.82 (0.52 - 1.29) | 15 |
| G | 109 (70.80) | 166 (66.40) | ||||
| rs3819024-399 | ||||||
| AA | 11 (14.30) | 40 (32.00) | 7.92 | 0.0048 | 0.35 (0.16 - 0.78) | 87 |
| AG | 13 (16.90) | 18 (14.40) | 0.23 | 0.634 | 1.21 (0.52 - 2.80) | 7 |
| GG | 53 (68.80) | 67 (53.60) | 4.58 | 0.032 | 1.91 (1.02 - 3.63) | 59 |
| A | 35 (22.70) | 98 (39.20) | 11.71 | 0.0006 | 0.46 (0.28 - 0.74) | 100 |
| G | 119 (77.30) | 152 (60.80) | ||||
| rs2275913-152 | ||||||
| AA | 4 (5.20) | 5 (4.00) | 0.16 | 0.689 | 1.32 (0.29 - 5.88) | 6 |
| AG | 24 (31.20) | 41 (32.80) | 0.06 | 0.809 | 0.93 (0.48 - 1.78) | 4 |
| GG | 49 (63.60) | 79 (63.20) | 0.00 | 0.950 | 1.02 (0.54 - 1.92) | 3 |
| A | 32 (20.80) | 51 (20.40) | 0.01 | 0.926 | 1.02 (0.60 - 1.73) | 3 |
| G | 122 (79.20) | 199 (79.60) | ||||
| rs3819025 Intron 1 | ||||||
| AG | 0 (0.00) | 9 (7.20) | 4.23b | 0.014c | 0.00 (0.00 - 0.92) | 88 |
| AG | 13 (16.90) | 24 (19.20) | 0.17 | 0.679 | 0.85 (0.38 - 1.91) | 6 |
| GG | 64 (83.10) | 92 (73.60) | 2.45 | 0.117 | 1.77 (0.82 - 3.85) | 37 |
| A | 13 (8.40) | 42 (16.80) | 5.66 | 0.017 | 0.46 (0.22 - 0.92) | 73 |
| G | 141 (91.60) | 208 (83.20) |
aEach P value is the result of the comparison of the corresponding row with the sum of other related rows.
bYates corrected.
c Fisher exact test.
Table 3.The Frequencies of IL-17A Genotypes and Alleles in Patients with Visceral Leishmaniasis and Controls
| SNPs/Genotypes | Patients, No. (%) | Controls, No. (%) | χ2 | P Valuea | OR (95% CI) | Study Power (%) |
|---|---|---|---|---|---|---|
| rs8193038 Intron 1 | ||||||
| AA | 67 (87.00) | 120 (96.00) | 5.60 | 0.018 | 0.28 (0.08 - 0.94) | 57 |
| AG | 2 (2.60) | 3 (2.40) | 0.14b | 1.00c | 1.08 (0.12 - 8.21) | 3 |
| GG | 8 (10.40) | 2 (1.60) | 6.07b | 0.007c | 7.13 (1.35 - 50.11) | 67 |
| A | 136 (88.30) | 243 (97.20) | 12.97 | 0.0003 | 0.22 (0.08 - 0.57) | 23 |
| G | 18 (11.70) | 7 (2.80) | ||||
| rs3804513 Intron 2 | ||||||
| AA | 72 (93.50) | 115 (92.00) | 0.16 | 0.691 | 1.25 (0.37 - 4.41) | 6 |
| AT | 0 (00) | 1 (0.80) | 0.06b | 1.00c | 0.00 (0.00 - 28.40) | 17 |
| TT | 5 (6.50) | 9 (7.20) | 0.04 | 0.847 | 0.90 (0.25 - 3.08) | 4 |
| A | 144 (93.50) | 231 (92.40) | 0.18 | 0.675 | 1.18 (0.51 - 2.82) | 6 |
| T | 10 (6.50) | 19 (7.60) | ||||
| rs19742263´ UTR | ||||||
| AA | 7 (9.10) | 6 (4.80) | 1.46 | 0.227 | 1.98 (0.57 - 6.99) | 20 |
| AG | 13 (16.90) | 15 (12.00) | 0.95 | 0.329 | 1.49 (0.62 - 3.57) | 16 |
| GG | 57 (74.00) | 104 (83.20) | 2.48 | 0.115 | 0.58 (0.27 - 1.22) | 33 |
| A | 27 (17.50) | 27 (10.80) | 3.73 | 0.053 | 1.76 (0.95 - 3.5) | 46 |
| G | 127 (82.50) | 223 (89.20) | ||||
| rs37480673´ UTR | ||||||
| AA | 16 (20.80) | 4 (3.20) | 14.59b | 0.000048 | 7.93 (2.35 - 29.48) | 95 |
| AG | 14 (18.20) | 25 (20.0) | 0.10 | 0.750 | 0.89 (0.40 - 1.94) | 5 |
| GG | 47 (61.00) | 96 (76.80) | 5.72 | 0.016 | 0.47 (0.24 - 0.92) | 65 |
| A | 46 (29.90) | 33 (13.20) | 16.83 | 0.00004 | 2.80 (1.64 - 4.78) | 97 |
| G | 108 (70.10) | 217 (86.80) |
aEach P value is the result of the comparison of the corresponding row with the sum of other related rows.
bYates corrected.
c Fisher exact test.
The genotype distributions met the HWE, except for rs3819024 in the patients, rs3819025 and rs8193038 in the controls, and rs1974226 in both groups. The Armitage trend test was used to validate the statistical analysis of the cases that could not meet HWE.
The genotypic and allelic frequencies, the P values, and strengths of the associations of all SNPs with visceral leishmaniasis are summarized in Tables 2 and 3. Accordingly, the distributions of A allele in rs3819024 (P = 0.0006), rs3819025 (P = 0.017), and rs8193038 (P = 0.0003) were significantly higher in the controls than those of the patients, while the frequency of rs3748067A allele was greater in patients than that of the controls (P = 0.00004).
The frequencies of AA genotype in rs3819024 (P = 0.0048) and in rs3819025 (P = 0.014) were higher in the controls than those of the patients while rs3748067 AA genotype was more frequent in the patients than that of the controls (P = 0.000048). Although rs8193038 AA genotype frequency was higher in the controls than the patients (P = 0.018), the P value could not tolerate the Bonferroni correction.
To construct haplotypes, only four SNPs with significant differences between the two study groups, e.g. rs3819024, rs3819025, rs8193038, and rs3748067, were used. The comparison of the haplotypes revealed that the distribution of AGAG haplotype is higher in the controls, compared with that of the patients with VL (P = 0.001). The GGAA haplotype was more frequent in the patients compared with the controls (P = 0.011), yet the respective P value did not tolerate Bonferroni correction (Table 4).
Table 4.The Most Common IL-17A Haplotypes Distribution in Patients with Visceral Leishmaniasis and Controls
| Haplotypesa | Patients, No. (%) | Controls, No. (%) | χ2 | P Valueb | OR (95% CI) | Study Power (%) |
|---|---|---|---|---|---|---|
| Single haplotype | ||||||
| A A A A | 4 (2.6) | 6 (2.4) | 0.04c | 1.00d | 1.08 (0.25 - 4.42) | 3 |
| A A A G | 3 (1.9) | 13 (5.2) | 2.65 | 0.10 | 0.36 (0.08 - 1.39) | 46 |
| A G A G | 18 (11.7) | 63 (25.2) | 10.85 | 0.001 | 0.39 (0.21 - 0.72) | 95 |
| G G A G | 80 (51.9) | 117 (46.8) | 1.01 | 0.31 | 1.23 (0.81 - 1.87) | 17 |
| A G A A | 8 (5.2) | 11 (4.4) | 0.13 | 0.71 | 1.19 (0.43 - 3.29) | 10 |
| G A A G | 6 (3.9) | 21 (8.4) | 3.10 | 0.08 | 0.44 (0.16 - 1.19) | 82 |
| G G A A | 17 (11.0) | 11 (4.4) | 6.51 | 0.011 | 2.70 (1.16 - 6.36) | 20 |
ars3819024, rs3819025, rs8193038, rs3748067.
bEach P value is the result of the comparison of the corresponding row with the sum of other related rows.
c Yates corrected.
d Fisher exact test.
To perform a comprehensive genetic association analysis of IL-17A, the researchers characterized the Linkage Disequilibrium (LD) pattern within the IL-17A gene. D′ value for the mentioned SNPs in IL-17A gene was calculated and the results are presented in Figure 1.
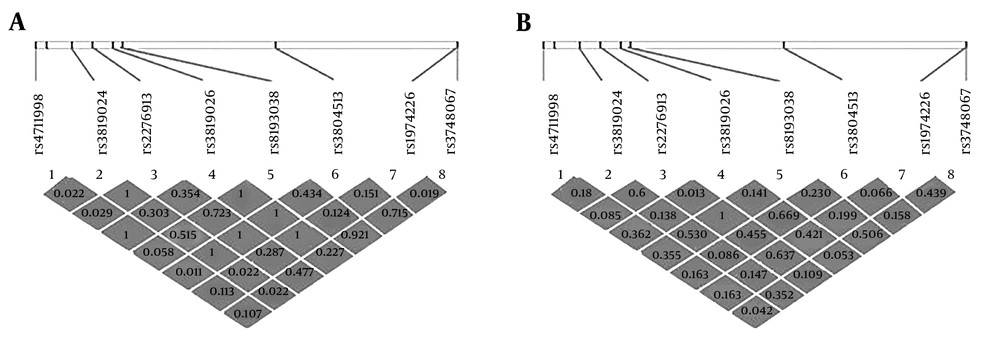
Figure 1.
LD map within the IL-17A gene in patients (A) and the controls (B) created using LD2SNping software. LD between pairs of markers was determined using Hendrick’s definition of Lewontin’s D' statistics. Numbers in boxes indicate LD (D') and strong LDs (P).
5. Discussion
The current research found a strong association between single nucleotide polymorphisms of IL-17A gene and the susceptibility and/or the resistance to VL.
Interleukin-17 has emerged as a member of a newly identified cytokine family, produced dominantly by Th17 cells (18), the cells that may bridge the gap between innate and adaptive immunity, and has conferred a host defensive role in many infectious diseases (19, 20). Recent studies have also indicated the role of IL-23 and IL-17 in the immunity against extracellular pathogens like bacteria, Toxoplasma gondii parasites, and fungi, and as important modulators in addition to their role in the pathogenesis of autoimmune diseases (21, 22).
Leishmaniasis spreads from a self-limited cutaneous lesion to mucocutaneous and visceral infections (23). Furthermore, L. infantum, as a dominant cause of leishmaniasis in endemic areas, can lead to an asymptomatic infection or fatal disease, i.e., VL (24). It has been discussed that Th1/17 may represent an intermediate stage of differentiation between Th17 and Th1 cells driven by IL-12 (25). Pitta showed that Leishmania strongly induced IL-17 and IL-22 peripheral blood mononuclear cells (PBMCs) in both healthy individuals and those exposed to L. donovani (5). Also, Kostka demonstrated the important facilitating role of IL-17 in Th1/Th2 development in L. major-infected BALB/c mice, and suggested that IL-23 production by L. major infected dendritic cells can maintain IL-17+ cells that influence the disease progression, persistence, and Leishmania lesions infiltration via the regulation of neutrophil recruitment, while Th1/Th2 development was not altered in L. major infected IL17-/- BALB/c mice (26). Bacellar has shown increased secretion of IL-17 by PBMCs during cutaneous and mucosal leishmaniasis, and IL-17 is present within the lesions caused by L. braziliensis (10). Regarding human VL, it has been shown that IL-17 plays a complementary role in human protection against the disease (5). They also hypothesized that a defect in TH17 induction may increase the risk of VL.
In the present study, the researchers showed that rs3819024A allele and AA genotype are more frequent in the controls compared with patients (P = 0.0006 and 0.0048, respectively). Given that there is a correlation between the inheritance of rs3819024A allele and IL-17A higher production (16), it can be suggested that the individuals carrying this allele may resist VL by producing more cytokines after exposure to L. infantum. Also, data showed higher frequencies of rs3819025A and rs8193038A alleles in the controls than that of the patients. These two alleles and their related genotypes may be considered as genetic factors conferring resistance against VL, while rs3748067A allele could act as a susceptibility factor for the disease.
There are several studies on IL-17A gene variants and different infectious and non-infectious diseases. Rasouli et al. studied IL-17A polymorphisms in the patients with brucellosis and reported associations between rs4711998A, rs3819024A, rs3819025A, rs8193038A, and rs3748067A and susceptibility or resistance to the disease (17). Arisawa and colleagues studied the influence of interleukin-17A polymorphisms and the susceptibility to ulcerative colitis (13). Chen et al. found that children with rs2275913AA genotype were 2.29 times more likely to develop asthma compared to others (15). Also, the influence of the IL-17A promoter polymorphism (rs8193036) on pediatric asthma in a Taiwanese population among nine IL-17A SNPs was confirmed by Wang (12). Furthermore, it has been shown that the inheritance of IL-17A rs3819024A allele is associated with higher binding affinities with the transcription factor complex and higher expression levels of IL-17A transcript, and the appearance of inflammation in inflammatory bowel diseases (IBD) (16).
Inherited combination of SNPs and polymorphic haplotypes can also impress susceptibility to different infection outcomes. The haplotypes were constructed using only the four SNPs showing statistically significant differences between the study groups. The distribution of the AGAG haplotype showed higher frequency in the control group compared to patients, and it can be predicted as a protective molecular construct against VL. In the present study, the distributions of genotypic variants met the HWE, except for rs3819024 in the patients and rs3819025 and rs8193038 in the controls and rs1974226 in both. Low sample size and the heterogeneous nature of the Iranian population might describe these deviations. Although in the allele-based test, deviation from HWE increases the chance of false positive results (27), it has been shown that the Armitage trend test results are valid even if the genotypes do not meet HWE. Thus, the current study used the Armitage trend test to validate the statistical analysis of genotype distributions that did not meet HWE.
In conclusion, regarding the results of the present study, IL-17A rs3819024, rs3819025, and rs8193038 AA genotypes and alleles might be considered as resistance molecular markers for
VL, while IL-17A rs3748067 AA genotype and A allele could be suggested as a susceptibility factor for the disease. Moreover, AGAG haplotype may be an influential factor for the resistance against VL.



