


1. Background
2. Objectives
3. Methods
3.1. Subjects and Study Design
3.2. Ethics Approval and Consent to Participate
3.3. Clinical Measurements
3.4. Method for Calculating Insulin Resistance and Beta Cell Function
3.5. Anthropometric Parameters
3.6. Data Collection
3.7. Statistical Analysis
4. Results
| Male (N = 1103) | Female (N = 1057) | P-Value | Total | |
|---|---|---|---|---|
| Age, y | 39 ± 10 | 41 ± 11 | < 0.001 | 40 ± 11 |
| Weight, kg | 84.34 ± 13.30 | 88.03 ± 14.53 | < 0.001 | 86.15 ± 14.04 |
| BMI, kg/m² | 26.70 ± 4.50 | 27.99 ± 4.81 | < 0.001 | 27.33 ± 4.70 |
| Waist circumference, cm | 100.66 ± 15.73 | 107.38 ± 19.85 | < 0.001 | 103.95 ± 18.17 |
| Physical activity, MET/24 h | 23.9 ± 5.9 | 21.3 ± 5.3 | < 0.001 | 22.6 ± 5.8 |
| Energy, kcal | 2469.81 ± 443.79 | 2521.26 ± 450.10 | < 0.001 | 2494.99 ± 447.53 |
| FPG, mg/dL | 104.75 ± 15.44 | 107.12 ± 16.74 | < 0.001 | 105.91 ± 16.13 |
| Fast insulin, µU/mL | 9.82 ± 4.56 | 10.66 ± 4.67 | < 0.001 | 10.23 ± 4.63 |
| Two-hour glucose, mg/dL | 117.35 ± 20.14 | 123.77 ± 20.90 | < 0.001 | 120.49 ± 20.76 |
| Two-hour insulin, µU/mL | 46.28 ± 14.45 | 44.16 ± 13.83 | < 0.001 | 45.24 ± 14.18 |
| HOMA-IR | 1.03 ± 0.28 | 0.99 ± 0.25 | < 0.001 | 1.01 ± 0.27 |
| HOMA-B | 71.75 ± 16.83 | 72.28 ± 18.12 | 0.480 | 72.01 ± 17.47 |
| Systolic blood pressure, mmHg | 12.48 ± 1.65 | 12.90 ± 1.66 | < 0.001 | 12.68 ± 1.66 |
| Diastolic blood pressure, mmHg | 8.25 ± 1.08 | 8.38 ± 1.06 | < 0.001 | 8.31 ± 1.07 |
| LDL, mg/dL | 100.20 ± 18.54 | 101.05 ± 18.55 | 0.284 | 100.61 ± 18.55 |
| HDL, mg/dL | 44.10 ± 8.56 | 45.88 ± 9.05 | < 0.001 | 44.97 ± 8.84 |
| TG, mg/dL | 190.49 ± 28.53 | 202.01 ± 28.20 | < 0.001 | 196.13 ± 28.94 |
| Total cholesterol, mg/dL | 182.23 ± 19.96 | 183.19 ± 18.28 | 0.246 | 182.70 ± 19.16 |
| ALT, IU/L | 44.33 ± 16.48 | 48.84 ± 16.19 | < 0.001 | 46.53 ± 16.49 |
| AST, IU/L | 36.07 ± 14.88 | 40.63 ± 16.23 | < 0.001 | 38.30 ± 15.72 |
| GGT, IU/L | 28.72 ± 13.24 | 27.65 ± 12.40 | 0.052 | 28.20 ± 12.84 |
| Smoking | ||||
| Yes | 193 (17.5) | 172 (16.3) | 0.914 | 365 ± 16.9 |
Abbreviations: ALT, alanine aminotransferase; AST, aspartate aminotransferase; BMI, body mass index; FPG, fasting plasma glucose; GGT, gamma-glutamyl transferase; HOMA-IR, Homeostasis model of insulin resistance; HOMA-β, Homeostatic model assessment of β cell function; HDL, high-density lipoprotein; LDL, low-density lipoprotein; TG, triglyceride.
aValues are expressed as mean ± SD or No. (%).

Flow chart of inclusion and exclusion criteria for non-alcoholic fatty liver disease
| Model 1a OR (95%CI) | Model 2b OR (95%CI) | |
|---|---|---|
| FPG | 1.092 (1.083 - 1.100) | 1.016 (1.004 - 1.027) |
| 2-h glucose | 1.035 (1.030 - 1.040) | 1.000 (0.994 - 1.006) |
| Fasting insulin | 1.381 (1.342 - 1.421) | 1.052 (1.004 - 1.103) |
| 2-h Insulin | 1.078 (1.069 - 1.087) | 1.011 (1.001 - 1.022) |
| HOMA-IR | 5.737 (4.692 - 7.015) | 1.292 (1.008 - 1.695) |
| Sex | 1.316 (1.101 - 1.572) | 0.033 (0.023 - 0.047) |
| BMI | 1.160 (1.135 - 185) | 1.009 (0.964 - 1.056) |
| Waist circumference | 1.048 (1.042 - 1.054) | 0.999 (0.985 - 1.014) |
| Waist to hip ratio | 5.059 (2.607 - 11.837) | 1.481 (0.432 - 5.084) |
| Waist to height ratio | 3.400 (1.491 - 7.652) | 0.998 (0.493 - 2.019) |
| Physical activity | 0.865 (0.853 - 0.865) | 0.969 (0.935 - 1.003) |
| Menopause | 12.031 (9.198 - 15.738) | 1.257 (0.842 - 1.875) |
| LDL | 1.023 (1.018 - 1.028) | 0.998 (0.989 - 1.007) |
| HDL | 0.964 (0.954 - 0.974) | 0.989 (0.968 - 1.010) |
| Total cholesterol | 1.022 (1.017 - 1.027) | 1.002 (0.993 - 1.011) |
| Systolic blood pressure | 1.199 (1.135 - 1.266) | 0.985 (0.912 - 1.063) |
| Diastolic blood pressure | 1.396 (1.281 - 1.521) | 0.899 (0.780 - 1.035) |
| ALT | 1.045 (1.039 - 1.051) | 1.018 (1.005 - 1.031) |
| AST | 1.048 (1.041 - 1.054) | 1.013 (1.000 - 1.026) |
| GGT | 1.024 (1.017 - 1.021) | 1.001 (0.989 - 1.014) |
| Total energy intake | 1.316 (1.101 - 1.572) | 1.120 (1.011 - 1.650) |
aLogistic regression in univariate analysis.
bMultivariate logistic regression adjusted for sex, menopause, BMI, waist circumference, waist to hip ratio, waist to height ratio, physical activity, LDL, HDL, Total cholesterol, systolic blood pressure, diastolic blood pressure, ALT, AST, GGT, and total energy intake.
| Cutoff Point | Sensitivity | Specificity | AUC | PPV | NPV | PLR | NLR | |
|---|---|---|---|---|---|---|---|---|
| FPG, mg/dL | ||||||||
| Female | 96.50 | 93.95 | 88.57 | 0.952 | 97.9 | 72.1 | 8.22 | 0.06 |
| Male | 100.72 | 88.44 | 90.00 | 0.950 | 95.9 | 74.5 | 8.84 | 0.13 |
| Total | 101.72 | 88.69 | 90.50 | .951 | 97.20 | 68.30 | 9.34 | 0.12 |
| Fasting insulin, µU/mL | ||||||||
| Female | 6.72 | 96.73 | 90.00 | 0.975 | 98.2 | 82.9 | 9.67 | 0.03 |
| Male | 9.31 | 86.99 | 95.38 | 0.969 | 98.0 | 73.4 | 18.85 | 0.14 |
| Total | 9.31 | 87.48 | 95.00 | 0.971 | 98.50 | 67.10 | 17.50 | 0.13 |
| 2-h glucose, mg/dL | ||||||||
| Female | 121.55 | 72.54 | 90.00 | 0.861 | 97.6 | 36.6 | 7.25 | 0.31 |
| Male | 117.58 | 65.90 | 90.77 | 0.830 | 95.0 | 50.0 | 7.14 | 0.38 |
| Total | 121.04 | 67.43 | 92.50 | 0.850 | 97.10 | 43.30 | 8.99 | 0.35 |
| 2-h insulin, µU/mL | ||||||||
| Female | 39.46 | 82.12 | 84.29 | 0.893 | 96.7 | 45.4 | 5.23 | 0.21 |
| Male | 43.07 | 83.24 | 83.85 | 0.906 | 93.2 | 65.3 | 5.15 | 0.20 |
| Total | 43.72 | 78.06 | 86.50 | 0.890 | 95.60 | 51.50 | 5.78 | 0.25 |
| HOMA-IR | ||||||||
| Female | 0.963 | 75.06 | 87.14 | 0.860 | 97.1 | 38.1 | 5.84 | 0.29 |
| Male | 1.00 | 79.19 | 86.15 | 0.881 | 93.8 | 60.9 | 5.72 | 0.24 |
| Total | 1.00 | 74.29 | 87.50 | 0.862 | 95.70 | 47.80 | 5.94 | 0.29 |
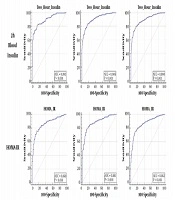
 curve to identify the cutoff values for fasting blood glucose, fasting insulin, 2-h glucose, 2-h insulin, and HOMA-IR to predict the existence of fatty liver")
Receiver operating characteristic (ROC) curve to identify the cutoff values for fasting blood glucose, fasting insulin, 2-h glucose, 2-h insulin, and HOMA-IR to predict the existence of fatty liver