
1. Background
As the most common type of liver cancer, Hepatocellular carcinoma (HCC) comes 6th as the most widespread malignant tumor. Globally, HCC is the 3rd leading reason for cancer-associated mortality (1). Despite considerable improvements in surgical and drug remedies, the overall 5 year survival rate of HCC patients remains low, given the high rate of recurrence and metastasis after curative resection and liver transplantation. However, there is no effective chemotherapeutic agent available for patients with HCC (2).
Additional research shows that purified protein from venom was selectively cytotoxic to cancer cells. Particularly, proteinous venom from several animals such as a snake, scorpion, spider, and more is reported to have an excellent cytotoxic effect in some cancer cell lines and can also reduce tumor growth in rodents (3, 4). In comparison to research on the venomous terrestrial animals (snake, scorpion, etc.), which has already led to the development of pharmaceutical compound, venomous fishes remain a largely ignored source of potential pharmaceuticals. Less toxic species like fish represent a valuable source of pharmacological compounds that may be a potential candidate for cancer treatment. Fish venom potentially include important source of pharmacological and physiological compounds that target integral processes within the human body more than many drugs (5, 6). Stonefish belongs to the genus Synanceia and resides in the shallow waters of the Pacific and Indian Oceans. Stonefish are perceived as one of the most venomous fish in the world. In recent years, several researches have described the immunological, pharmacological, and chemical studies of the stonefish venom (7-9). One type of stonefish Pseudosynanceia melanostigma, has venomous spines and is found in the muddy bottoms of the shallow waters of the Persian Gulf. A paucity of information exists on the cytotoxic effect of stonefish venom. Most previous studies have focused primarily on the cardiovascular and neuromuscular pharmacological effects of the venom (10).
2. Objectives
The aim of the present investigation is to explore the selective cytotoxic activity of stonefish venom fractions on isolated hepatocytes from an animal model of hepatocellular carcinoma (HCC) and monitor underlying mechanisms. In this study, upstream events in ROS mediated apoptosis through mitochondrial pathway were investigated. Such events included mitochondrial functionality, mitochondrial swelling, ROS formation, collapse of mitochondrial membrane potential, cytochrome C release, caspase 3 activity, and flow cytometry analysis of apoptosis.
3. Methods
3.1. Crude Venom Preparation
After collection of Pseudosynanceia melanostigma stonefish (200 specimens) from coastal shallow waters of the Persian Gulf beaches, from Bushehr, Iran. For venom extraction, venom apparatus of P. melanostigma, including dorsal spines and the attached venom glands, were removed and extracted with 20 - 30 mL of 0.15 M NACL at 4°C for 24 hours. The solution thus obtained was centrifuged at 12000g for 20 minutes and the supernatant was used as crude venom extract (11). The obtained venom was immediately freez-deried and kept at -20°C until further use. The protein concentration of the P. melanostigma venom was determined by the method of Bradford. (1976), using bovine serum albumin as standard (12).
3.2. Gel Filtration Chromatography
P. melanostigma crude venom was fractionated by gel filtration on Sephadex G-200 (Pharmacia, USA). Sephadex G-200 was washed with 0.15 M NACL and soaked for 48 hours before application to the column. Crude venom was applied to the column (60 × 2.5 cm) equilibrated and eluted with the 0.15 M NACL. The elution was carried out at 4°C at a flow rate adjusted to 25 mL/h. Fractions were collected with fraction collector apparatus and then protein absorbance was measured at 280 nm by UV spectrophotometer. Finally, the freeze-deried fractions were stored at -20°C before further application.
3.3. Animals and Grouping
For this study, male Sprague Dawley rats (120 - 160 g) were purchased from Institute Pasteur Tehran, Iran. All animals were kept in a controlled room temperature of 20 - 25°C, a humidity of 50% - 60%, and were exposed to 12-hr light/dark cycles. Animals were maintained according to the ethical standards and the committee of animal experimentation of Shahid Beheshti University of Medical Sciences, Tehran, Iran. The rats were divided equally into 2 groups (5 rats in each): group A: normal rat group, group B: HCC (hepatocellular carcinoma) group, induced by diethyl-nitroseamine (DEN) and CCl4 (i.p.).
3.4. Induction of Animal HCC Model
Hepatocellular carcinoma was induced chemically in rats by intraperitoneally (i.p.) injection of a single dose of diethylnitrosamine (DEN) at a dose of 200 mg/kg body-weight. Following DEN administration, cancer development was promoted with subcutaneous injections of CCl4 at a dose of 3 mL/kg body-weight for 6 weeks (13).
At the end of the HCC induction period (week 15), the body-weight of each rat was recorded and blood samples were assessed for α- fetoprotein (AFP) by ELISA (ADVIA Centaur AFP bioassay), alanine amino transferase (ALT), aspartate amino trasferase (AST), and alkaline phosphatase (ALP) using the standard diagnostic kits.
3.5. Isolation of Mitochondria from Rat Hepatocytes
After -HCC induction, at week 15, the animals were anaesthetized with ketamine and xylazine (80 and 5 mg/kg, ip Respectively). Then, rat liver hepatocytes were isolated using the two-step collagenase liver perfusion technique (14). For mitochondria isolation from cancerous and noncancerous hepatocyte, the cells (1 × 10⁶ cells/mL) were centrifuged at 300g for 3 minutes and re-suspended in 10 mL of Solution buffer A containing 0.25 M of sucrose, 0.01 M of tricine, 1 mM of EDTA, 10 mM of NaH2PO4, and 2 mM of MgCl2. Next, to break the plasma membrane, the cells were frozen at -80°C for 10 minutes and then cells were centrifuged again at 760 g for 5 minutes. The supernatants from the previous 2 steps were combined and centrifuged for 20 minutes at 8000 g (15). For determination of mitochondrial parameters, the final mitochondrial pellets were suspended in Tris buffer containing 0.05 M of Tris-HCl, 0.25 M of sucrose, 20 mM of KCl, 2.0 mM of MgCl2, and 1.0 mM of Na2HPO4;( pH = 7.4) at 4°C.
3.6. Determination of Succinate Dehydrogenase (SDH) Activity
The activity of mitochondrial complex II (succinate dehydrogenase) was assayed by measuring reduction of MTT (3- (4,5-dimethylthiazol-2-yl)-2, 5diphenyltetrazoliumbromide). Briefly, 100 µL of mitochondrial (1 mgprotein/mL) obtained from cancerous and noncancerous group was incubated with different concentrations of crude venom and its fractions (0 - 1000 µg/mL) at 37°C for 1 hour; then, 25 µL of 0.4% of MTT was added to the medium and incubated at 37°C for 30 minutes. The formed crystals were dissolved in 100 mL of DMSO and then the absorbance at 570 nm was measured with an ELISA reader (Tecan, Rainbow Thermo, Austria) (16). In our study, for determination of mitochondrial parameters following addition of fraction 3 of venom, we used 125, 250, and 500 µg/mL concentrations, which is corresponding to IC50/2, IC50, and 2 × IC50 of this fraction.
3.7. Determination of Mitochondrial ROS Formation
The mitochondrial ROS formation was performed using the DCFH-DA fluorescent probe. Briefly isolated mitochondria from HCC and normal hepatocytes were placed in respiration buffer consisting 0.32 mMsucrose, 10 mMTris, 20 mMMops, 50 μM EGTA, 0.5 mM MgCl2, 0.1 mM KH2PO4, as well as 5mM sodium succinate, then, DCFH-DA was added at final concentration of 10 µM. After, treatment with various concentration of fraction 3 of P. melanostigma venom (125, 250 and 500 µg/mL) into mitochondrial samples for 60 minutes and incubating them at 37°C, the DCF fluorescence intensity was assayed at excitation wavelength of 485 nm and emission wavelength of 520 nm using fluorescence spectrophotometer (17).
3.8. Determination of Mitochondrial Swelling
Determination of mitochondrial swelling in mitochondrial suspension (1mg protein/ML) was performed by measurement of decreased absorbance of mitochondrial particles by spectrophotometer at 540 nm (30°C), which is oppositely relevant to increased forwarded light scattering due to mitochondrial enlargement (18). Briefly, isolated hepatocytes mitochondria were suspended in swelling buffer (70 mM sucrose, 230 mM mannitol, 3 mM HEPES, 2 mM tris-phosphates, 5mM succinate, and 1 µM rotenone and incubated) at 30°C for 1 hour with different concentration of fraction 3 of P. melanostigma venom (125, 250 and 500 µg/mL). The absorbance was measured at 540 nm within 1 hour, at 15 minutes time intervals with an ELISA reader (Tecan, Rainbow Thermo, Austria). Increase of mitochondrial swelling was characterized by a decrease in mitochondrial absorbance at 540 nm (19).
3.9. Determination of Mitochondrial Membrane Potential (MMP)
MMP collapse was estimated using the fluorescent cationic dye Rhodamine 123. Different concentrations of fraction 3 of P. melanostigma venom (125, 250 and 500 µg/mL), Rhodamine 123 (final concentration 10 µM) were added to the mitochondria suspended (1 mg protein/ML) for 1 hour in MMP assay buffer including 220 mM sucrose, 68 mMD-mannitol, 10 mM Kcl, 5 mM KH2PO4, 2 mM MgCl2, 50 µM EGTA, 5mM sodium succinate, 10 mM HEPES, 2 µM Rotenone. The fluorescence activity was monitored at the excitation and emission wavelength of 490 nm and 535 nm, respectively (20).
3.10. Determination of Cytochrome C Expulsion
The release of cytochrome c by fraction 3 of P. melanostigma venom (250 μg/mL) was carried out according to instructions of the Quantikine Rat/Mouse Cytochrome c Immunoassay kit provided by R and D Systems, Inc. (Minneapolis, MN, USA).
3.11. Determination of Cytotoxicity Using Trypan Blue Exclusion
Normal and HCC hapatocytes were plated in 96 well plates at a density of 1 × 10⁶ cells/well. Cells were transferred in RPMI 1640, supplemented with 10% FBS, and antibiotics 50 U/mL of penicillin and 50 μg/mL streptomycin. They were then added to different concentrations of P. melanostigma venom fraction (0 - 1000 µg/mL), and incubated at 37°C, 5% CO2, and 95% air for 12 hour. In order to determine cytotoxicity, the trypan blue exclusion protocol was used. Briefly, about 20 μL of cell suspensions were mixed with 20 μL of trypan blue and the numbers of dead and live cells were counted using a hemocytometer.
3.12. Caspase-3 Activity Assay
The effect of P. melanostigma on the caspase-3 activity on the isolated hepatocytes from HCC and normal groups was carried out according to instructions of the Sigma-Aldrich colorimetric assay kit (CASP-3-C; Sigma-Aldrich, Saint Louis, USA).
3.13. Flow Cytometry Analysis of Apoptosis by Propidium Iodide
Propidium iodide (PI), a fluorogenic compound used for nuclear staining by binding to nucleic acids and fluorescence emission induced of 488-nm laser beam, is proportional to the DNA content of a cell. Briefly, following the exposure with P. melanostigma fraction, about 1 - 2 × 10⁶ cells per 1 mL of PBS, were incubated in an incubator for 12 hours before the cells were harvested by centrifugation (200 g for 5 minutes at room temperature). After that, cell pellet was re-suspended in 1 mL of fluorochrome hypotonic solution containing 0.1% sodium citrate (wt/v), 0.1% Triton X-100 (v/v), and 50 mg/mL PI in deionized/distilled water. Prior to flowcytometric analysis, cells were maintained in the dark room at 4°C, for at least 1 hour. Finally cells were analyzed with flow cytometry using an argon-ion laser at 488-nm wavelength for excitation (21).
3.14. Statistical Analysis
The results of this study are shown as a mean ± SD GraphPad Prism software (version 5) was used for all statistical analysis. One way and two-way ANOVA tests were performed between the hepatocellular carcinoma (HCC) group and the control group. Significance was considered at P < 0.05.
4. Results
4.1. Effect of DEN/-ccl4 on Liver and Body Weight
As shown in Table 1, liver and body weight of control and DEN induced hepatocellular carcinoma (HCC) group are significantly different. According to Table 1, the average weight of the control rats (315 ± 27.5 g) were significantly (P < 0.05) higher than that of the HCC group (266.33 ± 12.6 g). Moreover, compared to the controls, the average liver weight in the HCC and control rats was significantly different (13.46 ± 0.33 g versus 9.66 ± 1.02 g, respectively; P < 0.05).
Table 1.
Effect of DEN/ccl4 On Final Body Weight and Liver Weight of the Test and Control Animalsa
| Group | Final Body Weight, g | Liver Weight, g |
|---|---|---|
| Untreated group | 315 ± 27.5 | 9.66 ± 1.02 |
| HCC group | 266.3 ± 12.6b | 13.46 ± 0.33b |
aValues are presented as mean ± SD of 5 separate rats in each group. Rats were administered with single ip injection of DEN (200 mg/kg) and CCl4 at a dose of 3 ml/kg body-weight for 6 weeks.
bIndicate significant difference (P < 0.05) between DEN-CCL4 induced HCC and untreated group.
4.2. Effect of DEN/CCL4 on AFP, AST, ALT and ALP
Compared to the control group, level of serum AST, ALT, and ALP as well as α-fitorotein (AFP), which is considered a liver tumor indicator in DEN induced hepatocellular carcinoma (HCC) group, significantly increased (P < 0.05) (Table 2).
Table 2.
Effect of DEN/ccl4 on ALP, ALT, AST and AFP in Serum of the Test and Control Animalsa
| Group | ALT, IU/L | AST, IU/L | ALP, IU/L | AFP, IU/L |
|---|---|---|---|---|
| Untreated group | 93 ± 14 | 91 ± 8.4 | 614 ± 53 | 0.34 ± 0.05 |
| HCC group | 761 ± 65b | 645 ± 57b | 784 ± 41b | 3.46 ± 0.033b |
aValues are presented as mean ± SD of 5 separate rats in each group. Rats were administered with single ip injection of DEN (200 mg/kg) and CCl4 at a dose of 3 ml/kg body-weight for 6 weeks.
bIndicate significant difference (P < 0.05) between DEN-CCL4 induced HCC and untreated group.
4.3. Gel Filtration Chromatography
Prior to obtaining cytotoxic effect of fractions of stonefish venom, we first fractionated P. melanostigma stonefish crude venom using gel filtration chromatography. As shown in Figure 1, gel filtration of crude venom on Sephadex G-200 resulted in 3 fractions with absorbance at 280 nm (f1 - f3).
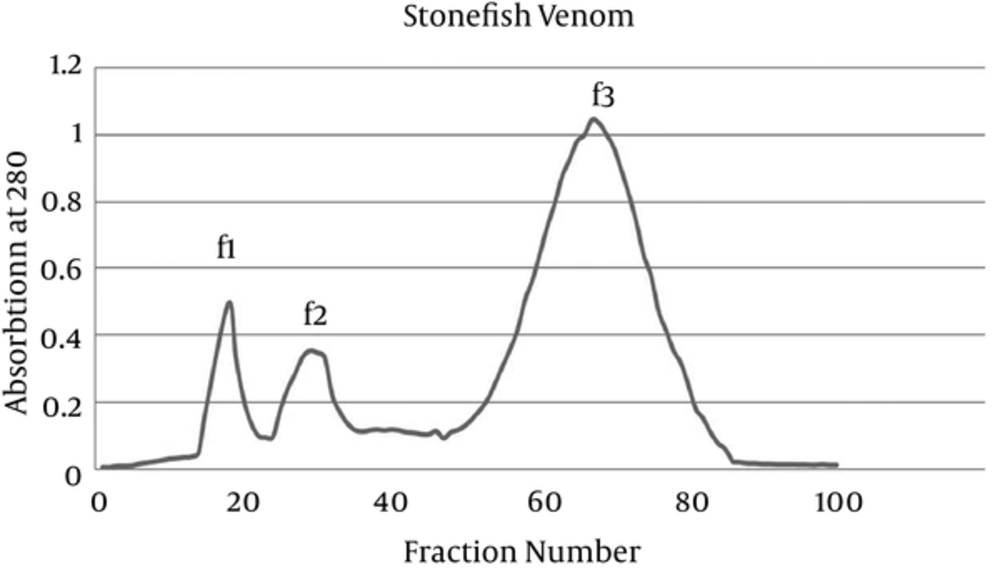
Figure 1.
200 mg of crude venom dissolved in 3 mL 0.15 M NaCl (pH 7.2), was applied and eluted with the same buffer. Flow rate was 25 mL/h and 4 mL/ tube were collected at 4.
4.4. Mitochondrial Succinate Dehydrogenase (SDH) Activity
The inhibiting effect of various P. melanostigma crude venom concentrations and its fractions (0, 50, 100, 200, 500, and 1000 μg/mL) on mitochondrial succinate dehydrogenase activity was determined after 60 minutes of exposure with the MTT assay using isolated mitochondria from hepatocytes of the normal and HCC groups. However, only fraction 3 of venom caused a significant (P < 0.05) concentration-dependent reduction of mitochondrial succinate dehydrogenase activity on tumoral but not healthy mitochondria, which was similar to what was seen by the whole crude venom (Figure 2A, D and E). In contrast to fraction 3, fraction 1, and 2 of P. melanostigma, venom did not significantly (P < 0.05) decrease succinate dehydrogenase activity on isolated tumoral mitochondria at any concentration (Figure 2B, C). The IC50 value, which is stated as, concentration that inhibits 50% of mitochondrial succinate dehydrogenase activity following 60 minutes of treatment was 250 μg/mL. To determine mitochondrial parameters, the present study used 125, 250, and 500 μg/mL concentrations, in correspondence to IC50/2, IC50, and 2 × IC50 of this fraction.
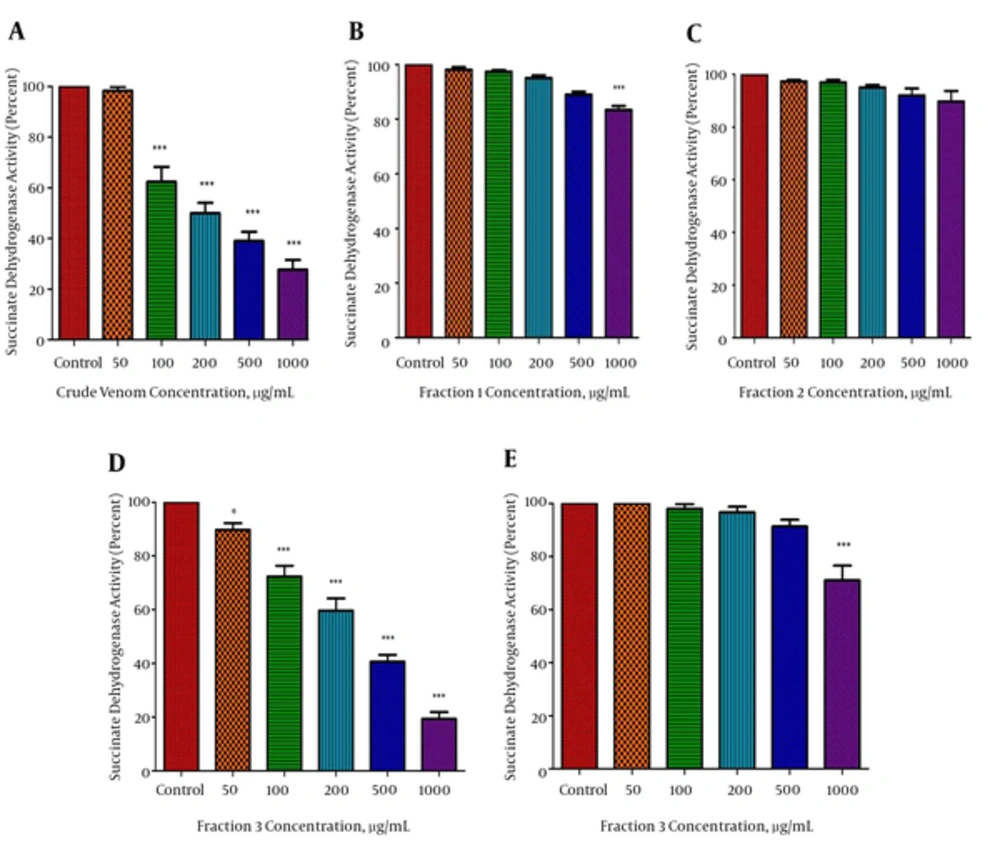
Figure 2.
The effect of P. melanostigma crude venom and its fractions (B, C, and D) on mitochondrial succinate dehydrogenase activity measured by MTT assay following 60 minutes of treatment in the mitochondria obtained from HCC (A, B, C, and D) and healthy group (E). Values are represented as mean ± SD (n = 5). *and ***significant difference in comparison with the corresponding control mitochondria (P < 0.05 and P < 0.001, respectively).
4.5. Effect of Fraction 3 of P. Melanostigma Venom on Mitochondrial ROS Formation
As shown in Figure 3A, fraction 3 of P. melanostigma venom (125, 250, and 500 µg/mL) resulted in significant elevation of ROS in the isolated mitochondria from hepatocytes of the HCC group in a concentration and time dependent manner (P < 0.05) (Figure 4A). Alternatively, various concentrations of fraction 3 of P. melanostigma could not induce ROS formation in isolated healthy mitochondria following 60 minutes of incubation.
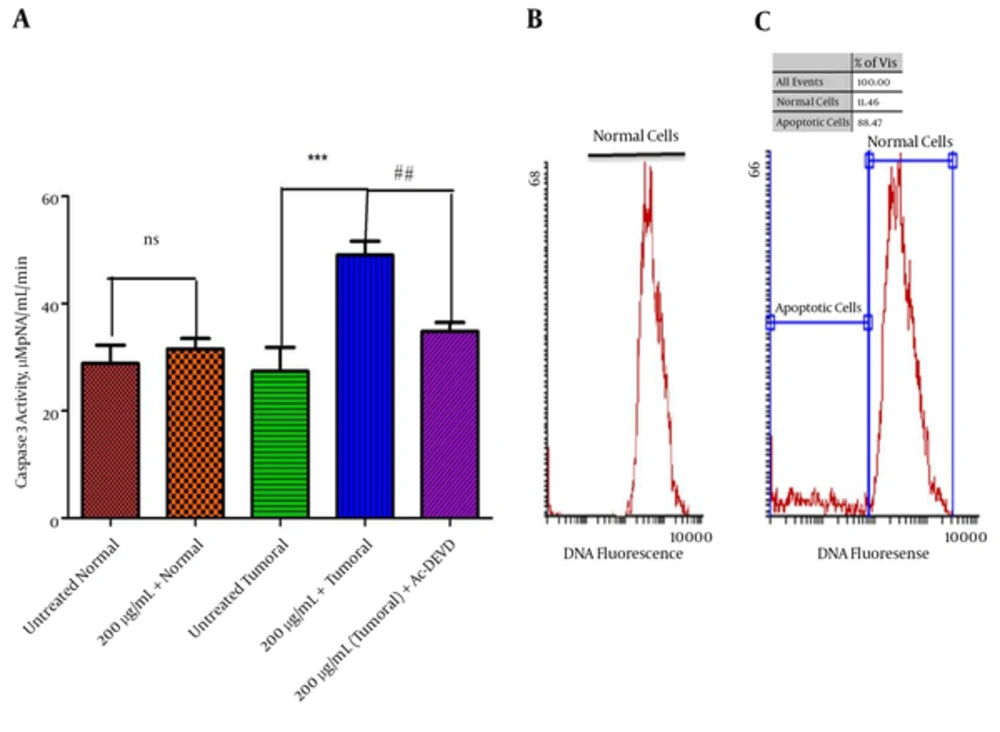
Figure 3.
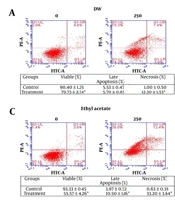
(A) Values Are Presented as Mean ± SD***Significant difference in comparison with the untreated tumoral cells (P < 0.001). ## Significant differences in comparison with fraction 3 (200 μg/mL) treated tumoral cells (P < 0.01). Flow cytometric analysis of apoptotic cells using propidium iodide. (B) DNA histogram of untreated tumoral cells (C) DNA histogram of tumoral cells treated by fraction 3 of P. melanostigma (200 μg/mL) for 12 hours. The peak of hypodiploid apoptotic cells clearly separated from the diploid DNA peak of normal cells.
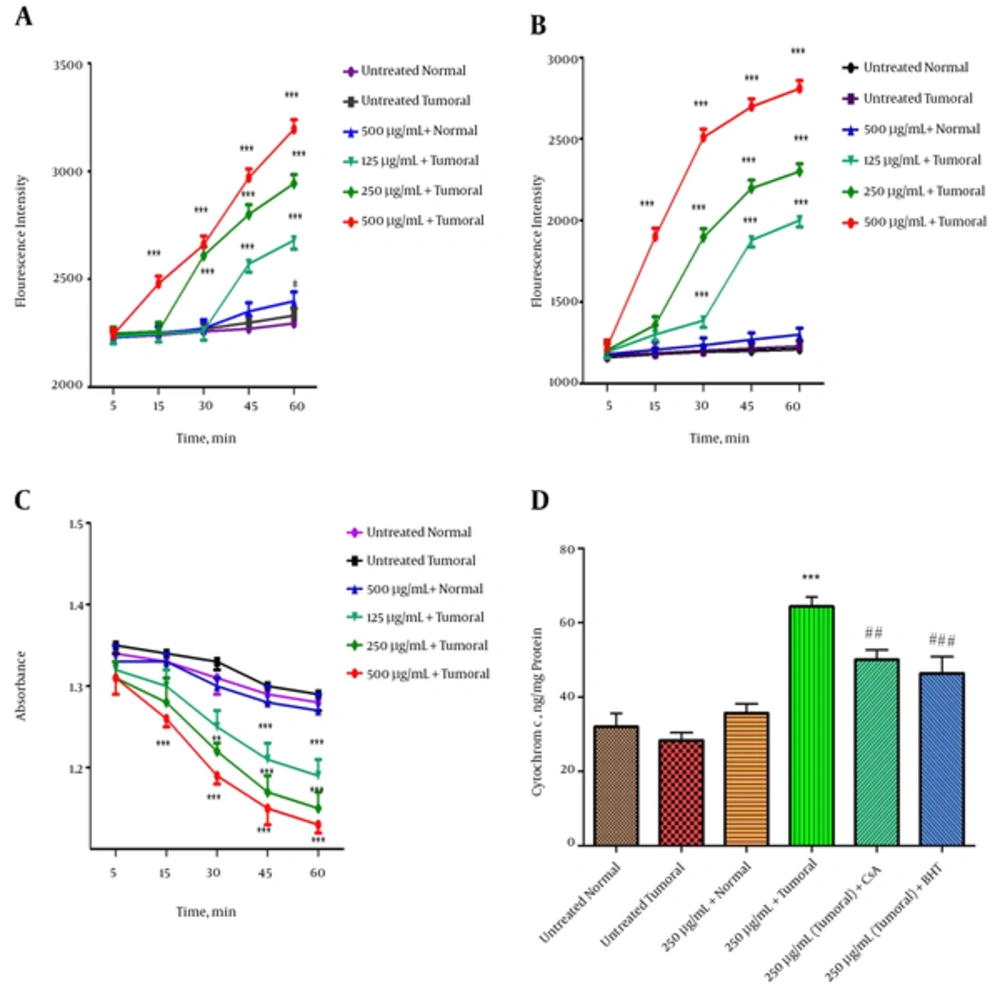
Figure 4.
Effect of various concentrations of fraction 3 of P. melanostigma venom (120, 250 and 500 μg/mL) on parameters related to mitochondrial damage including (A) ROS formation, (B) mitochondrial membrane potential (MMP), (C) mitochondrial swelling and (D) release of Cytochrome c at different time intervals within 60 minutes of incubation on isolated mitochondria. Values are represented as mean ± SD (n = 5). *, ** and *** Significant difference in comparison with untreated HCC group (P < 0.05, P < 0.01 and P < 0.001 respectively). ##, ### Significant differences in comparison with fraction 3 (250 μg/mL) treated HCC mitochondria (P < 0.01 and P < 0.001 respectively).
4.6. Effects of Fraction 3 of P. Melanostigma Venom on Mitochondrial Membrane Potential (MMP)
The effect of fraction 3 of P. melanostigma on MMP in both tumoral and healthy groups was assayed by Rh 123 staining. As displayed in Figure 3B, fraction 3 of P. melanostigma concentrations (125, 250, and 500 μg/mL) significantly (P < 0.05) decreased the MMP (demonstrated as fluorescence intensity units emitted from Rh123) only in hepatocyte mitochondria retrieved from the HCC group. In contrast with tumoral mitochondria, there is no significant collapse in healthy mitochondria following the addition of different concentrations of fraction 3 within 60 minutes of incubation.
4.7. Effects of Fraction 3 of P. Melanostigma Venom on Mitochondrial Swelling
Addition of all applied concentrations of fraction 3 of P. melanostigma venom (125, 250, and 500 μg/mL) led to significant mitochondrial swelling (monitored by decrease of absorption in mitochondrial suspension at λmax 540 nm) subsequent to 60 minutes of incubation within the isolated mitochondria from liver hepatocytes of the HCC group (P < 0.05). On the other hand, addition of the same concentrations of this fraction to the mitochondria obtained from the healthy group did not induce any mitochondrial swelling (Figure 3C).
4.8. Effects of Fraction 3 of P. Melanostigma Venom on Cytochrome c Release
Release of cytochrome c, following the exposure to different concentration of fraction 3 of P. melanostigma venom, is a subsequent event in response to collapse of mitochondrial membrane potential (MMP) and mitochondrial swelling that could lead to mitochondrial permeability transition (MPT) pore opening. As shown in Figure 3D, fraction 3 of P. melanostigma venom (250 μg/mL) significantly (P < 0.05) induced the release of cytochrome c only in isolated tumoral mitochondria. Alternatively, pretreated venom fraction 3 (250 μg/mL) mitochondria with MPT inhibitors and antioxidants, such as cyclosporine A (CsA) and butylated hydroxyl toluene (BHT), respectively, inhibit cytochrome c release significantly in comparison to the fraction 3 (250 μg/mL) treated group.
4.9. Effect of Fraction 3 of P. Melanostigma Venom on Cell Viability
To evaluate the cytotoxic activity of fraction 3 of P. melanostigma venom, the viability of HCC and healthy hepatocytes treated with this fraction were determined using trypan blue exclusion. As shown in Figure 4A and B, the viability of HCC hepatocytes significantly (P < 0.05) was inhibited by fraction 3 in a concentration-dependent (50 - 1000 μg/mL) manner. The IC50 (half-maximal inhibitory concentration) values were 200 μg/mL after 12 hours treatment. On the other hand, apart from the highest concentration (1000 μg/mL) no significant decrease at viability was observed in normal hepatocytes treated with all applied concentration venom (P > 0.05).
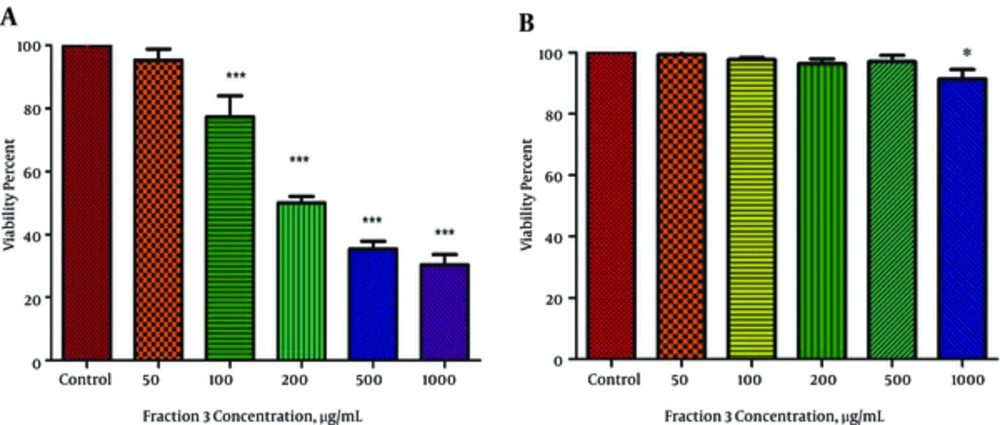
Figure 5.
Effect of various concentrations of fraction 3 of P. melanostigma venom (50 - 1000 μg/mL) on hepatocytes viability for 12 hours, (A) HCC group and (B) normal group. Cells were treated with fraction 3 of P. melanostigma venom and cell viability was measured following 12 hours of exposure. Values are represented as mean ± SD (n = 5). *, ** and *** Significant difference in comparison with corresponding control group.(P < 0.05, P < 0.01 and P < 0.001, respectively).
4.10. Effect of Fraction 3 of P. Melanostigma Venom on Caspase 3 Activity
Our results showed that fraction 3 of P. melanostigma venom (200 μg/mL) significantly (P < 0.05) induced activation of caspase 3 (a crucial executioner apoptosis) only in tumoral hepatocytes obtained from the HCC group but not in those obtained from the normal group. Pretreatment of venom fraction 3 (200 μg/mL) treated cancerous cells with a caspase 3 inhibitor (Ac-DEVD-CHO) prevented caspase 3 activation, indicating that fraction 3 of P. melanostigma venom activates caspase 3 through mitochondria-dependent pathway in HCC-hepatocytes (Figure 5A).
4.11. Effect of Fraction 3 of P. Melanostigma Venom on Cell Apoptosis
The extent of apoptosis due to fraction 3 P. melanostigma venom (200 μg/mL) was investigated with flow cytometric analysis using PI-stained cells. As shown in DNA histogram of tumoral cells treated by fraction 3 of P. melanostigma (200 μg/mL) for 12 hours, the peak of hypodiploid apoptotic cells clearly separated from the diploid DNA peak of normal cells. Indeed, 11.46% of fraction 3 treated tumoral cells were undergoing apoptosis (Figure 5B and C).
5. Discussion
Mitochondria are prominent cellular organelles that play inevitable roles in cell death. Due to their role in apoptosis and energy metabolism, recently there is growing interest to explore the potential of the mitochondria as a tool in cancer treatment. Some structural and functional alterations to the mitochondria in cancer cells render it possible to develop approaches to selectively affect cancer cells (20). For this reason, more than 20 anti-cancer compounds in recent years have been reported to induce mitochondria mediated apoptosis preferentially in cancerous cell lines (22, 23).
This study investigated the potential of fraction 3 of Persian Gulf stonefish, P. melanostigma, venom to induce ROS mediated apoptosis through mitochondrial pathway in hepatocytes obtained from an animal model of hepatocellular carcinoma. Our study shows that fraction of 3 of P. melanostigma induced the cytotoxicity in HCC hepatocytes and their mitochondria in concentration-dependent manner without cytotoxicity against normal cells. Our data is in line with the hypothesis that fraction 3 of P. melanostigma shows selective toxicity in cancerous hepatocytes while normal cells appear to be less affected. Based on existing studies that indicate animal toxins displayed highly pro-apoptotic activity though the mitochondria-mediated pathway, we hypothesized that fraction 3 of P. melanostigma induces apoptosis via ROS generation and mitochondria-mediated signaling. Our results show that fraction 3 of stonefish venom significantly inhibits the activity of mitochondrial succinate dehydrogenase in a concentration and time-dependent manner (Figure 2). Under physiological conditions, the proper maintenance of ROS is critical in keeping redox balance and cellular proliferation signaling. However, Continuous ROS generation or lack of a cellular mechanism of ROS elimination would lead to a significant increase of intracellular ROS and ultimately cellular damage. If ROS production is severe and persistent, cell death will be ultimately inevitable (24, 25).
Given that tumoral cells typically have a high metabolic activity and are under intrinsic oxidative stress, the production of high levels of ROS renders malignant cells susceptible to additional oxidative stress by exogenous ROS-generating agents. A hypothesis is that an apoptotic program is activated to kill cancer cells when ROS stress levels reach a certain threshold (26). In accordance with this hypothesis we show that fraction 3 of P. melanostigma venom significantly (P < 0.05) increased ROS generation in a time and concentration-related manner only in mitochondria obtained from cancerous hepatocytes but not healthy ones.
The loss of mitochondrial membrane potential (MMP) is another key cellular event in the mitochondrial apoptosis pathway. A reduced MMP increases the mitochondrial membrane permeability and facilitates the release of apoptotic factors. In brief, damage to mitochondrial membrane leads to MPT pore opening and then the cytochrome c releases into the cytosol. Subsequently, cytochrome c, with apoptotic protease activating factor 1 (Apaf-1) and procaspase-9, forms the apoptosome. Activation of caspase-9 in the presence of ATP, leads to activation of the downstream effector caspase-3, which eventually causes the ultimate steps of apoptosis (27, 28). In the present study we show that fraction 3 of this venom could selectively induce MMP disruption, mitochondrial swelling, and cytochrome c release in HCC mitochondria, with almost no effect on healthy mitochondria directly suggesting that mitochondrial targeting is as an important mechanism for the anti-cancer effect of venom derived peptides. A review of studies on animal venoms indicates that venomous animal play a remarkable role in development of Biomedical Sciences. These venoms contain bioactive molecules such as proteins and peptides that can exert critical pharmacological and physiological activities. The biodiversity within venoms and toxins has rendered them a source of structural templates that can potentially lead to the development of novel therapeutic agents (29). Particularly, venoms of snakes, scorpions, fishes, and their corresponding active compounds such as their proteins, none protein toxins, peptides, and enzymes have shown promising anti-cancer properties (30-32).
Our earlier work shows the cytotoxic effect of P. melanostigma crude venom on the lymphocytes derived from both acute lymphoblastic leukemia (ALL) patients and normal donors. Our results illustrate the potential effect of crude Persian Gulf Stonefish venom on cancerous lymphocytes without any significant effect on normal cells, through the mechanism of reactive oxygen species (ROS) generation and mitochondrial membrane damage (33).
In accordance to current studies, evaluation of cytotoxic activities of different fish venoms has been performed on numerous cancer cell lines in vitro or induced on animal models. Compared to our current results, it was reported that the crude venom of the scorpion fish Scorpaena plumieri and gelatinolytic protease purified from this venom (SPGP) contain potent anti-tumor properties on p53-wild-type glioblastoma and Ehrlich ascites carcinoma cells (34).
Further research also evaluated the potential anti-proliferative properties of peptide (7.6 kDa) from lionfish (Pterios volitans) venom on cultured HEp2 and HeLa cells. On the other hand, fish venom peptide was found to selectively induce apoptosis in cancer cells (35).
Additional research suggests that a relatively new cytotoxic protein, a Karatoxin (110-kDa glycoprotein), revealed cytotoxic effects on murine P388 leukemic cells and in another study, induced mitogenic stimulation on mice splenocytes. This cytotoxic protein, Karatoxin, is obtained from the dorsal spines of Hypodytes rubripinnis, also known as redfin velvetfish (36).
Caspase independent apoptosis has been reported in rat hepatocytes by plancitoxin-1 from the venom of starfish Acanthaster planci (37). Moreover, the fish venom of Pterios volitans has been shown to reduce a tumor burden and improve oxidative stress in Ehrlich’s ascites carcinoma xenografted murine (38).
5.1. Conclusion
In conclusion, our study demonstrates that fraction 3 of the Persian Gulf stonefish venom could selectively induce apoptosis in cancerous hepatocytes of HCC through a ROS-regulated mitochondrial pathway with very minute effects on healthy cells. Our current results strongly support the hypothesis that stonefish venom fraction 3 selectively induces ROS mediated apoptosis in cancerous hepatocytes by directly targeting the mitochondria.