Chemicals
Rhodamine 123, collagenase (from Clostridium histolyticum), bovine serum albumin, N-(2-hydroxyethyl)piperazine-N0-(2-ethanesulfonic acid) (HEPES), O-phthalaldehyde (OPT), reduced and oxidized glutathione (GSH and GSSG), 2,7-dichlorofluorescin diacetate (DCFH-DA), Trypan blue,GSe media, and heparin were purchased from Sigma- Aldrich Co. (Taufkrichen, Germany). All other chemicals were of the highest commercial grade available.
Animals
Male Sprague–Dawley rats (280–300 g) purchased from Pasteur Institute (Tehran, Iran), fed with a standard chow diet and water ad libitum, used for hepatocyte preparation. All experiments were conducted according to ethical standards and protocols approved by the Committee of Ethics, Shahid Beheshti University of Medical Sciences, Tehran, Iran.
Accelerated cytotoxicity mechanism screening method
This method determines the cytotoxic effectiveness of xenobiotics incubated for 6 h towards rat hepatocytes, freshly isolated from SD male rats. A functionomic approach is used to understand the cytotoxic mechanisms, e.g., the effects of inhibitors or protectants of cellular or sub-cellular damaging pathways on the loss of cell viability induced by the xenobiotic (e.g. algal lysate) are investigated. The procedures used are as follows:
(
1) The concentration of xenobiotic (
e.g.algal lysate) required for inducing a 50% loss of membrane integrity (EC
50) of freshly isolated rat hepatocytes is determined by trypan blue exclusion.
(
2) A major assumption with accelerated cytotoxicity mechanism screening (ACMS) is that high dose/short time (
in-vitro) simulates low dose/long time (
in-vivo) with relevance to human environmental exposure (
20). The hepatocyte molecular cytotoxic mechanism of the xenobiotic (
e.g. algal lysate) is determined by the changes in bioenergetics (ATP, mitochondrial membrane potential,
etc …), oxidative stress (reduced/oxidized glutathione (GSH/GSSG), reactive oxygen species formation and
etc…). If oxidative stress caused the cytotoxicity, then oxidative stress should precede cytotoxicity and antioxidants or ROS scavengers or redox therapy should prevent or delay the cytotoxicity. If not, then the oxidative stress likely occurred as a secondary result of the cytotoxicity. If mitochondrial toxicity caused the cytotoxicity, then glycolytic substrates should be protected and the membrane potential should be restored (
20).
Antioxidants (α-tocopherol succinate and BHT), radical scavengers (mannitol and DMSO), mitochondrial permeability transition (MPT) pore sealing agents (cyclosporine A, carnitine and trifluoperazine), NADPH P450 reductase inhibitor (Diphenyliodonium chloride), CYP2E1 inhibitors (Phenylimidazole and 4-Methylpyrazole) and ATP generators (L-glutamine, Fructose and Xylitol) were used as protective agents in their sub-toxic concentrations in all our experiments. The basis for concentration selection for abovementioned preventing agents was previously published literature regarding the similar (ACMS) works performed in exactly similar technical conditions.
Preparation of C. polykrikoides lysate
A cell-pellet (about 120,000 cells), including a small amount of GSe media, was obtained from 30 mL of
C. polykrikoides at late exponential growth phase (4 × 10
3 cells/mL) by centrifugation at 5000×g for 5 min at 4°C, and was ruptured by ultrasonic treatment at 20°C in a bath-type sonicator. Microscopic observation confirmed that all
C. polykrikoides cells wereruptured by this treatment. Lysate preparation of
C. polykrikoides cells was achievedin a sonication bath for 1 min, repeated three times. The three lysates were combined, decanted and centrifuged at 3200×g for 15 min. The supernatant (total algal lysate) was removed and used for the cytotoxicity assays (modified from (
16,
21).
The dinoflagellate concentration equivalent to obtained algal lysate was about 2.4 × 10⁴ cells/mL. considering that the lysate at 100% was obtained from C. polykrikoides cells.
Isolation and incubation of hepatocytes
Hepatocytes were obtained by collagenase perfusion of Sprague-Dawley rat liver (
22), and viability was assessed by plasma membrane disruption determined by trypan blue (0.2 w/v) exclusion test. Cells were suspended at a density of 10
6 cells/mL in round-bottomed flasks rotating in a water bath maintained at 37°C in Krebs–Henseleit buffer (pH = 7.4), supplemented with 12.5 mM HEPES under the atmosphere of 10% O
2, 85% N
2, and 5% CO
2.
Each flask contained 10 mL of hepatocyte suspension. Hepatocytes were pre incubated for 30 min prior to the addition of chemicals. Stock solutions of all chemicals (×100 concentrated for the water solutions or ×1000 concentrated for the methanolic solutions) were prepared fresh prior to use. To avoid either non-toxic or severe toxic conditions in this study, EC50 concentrations were used for algae lysate. The EC50 of a chemical in hepatocyte cytotoxicity assessment technique (with the total 6 h incubation period) is defined as the concentration, which decreased the hepatocyte viability to 50% following the 3 h incubation period (
23). In order to determine this value for algal lysate, concentration-response curves were plotted and then EC50 were determined based on a regression plot of three different concentrations (data and curves not shown). The EC503h concentration (
i.e., 50% membrane lysis in 3 h) found for algal lysate was equivalent to 240 cells/mL. To incubate water soluble treatments with the required concentration, 100 μL sample of concentrated stock solution (×100 concentrated) was added to the rotating flask containing 10 mL of hepatocyte suspension (
24-
26). For the chemicals, which dissolved in methanol, methanolic stock solutions (×1000 concentrated) were prepared and to achieve the required concentration in the hepatocytes, 10 μL samples of stock solution was added to the 10 mL cell suspension(
27). Ten micro liters of methanol did not affect hepatocyte viability after 6 h incubation (data not shown).
Cell viability
The trypan blue (0.2% w/v) exclusion test was used to determine the number of viable cells present in the cell suspension. It is based on the principle that live cells possess intact cell membranes that exclude trypan blue, whereas dead cells do not. In this test, a cell suspension was simply mixed with dye and then visually examined to determine whether cells take up or exclude dye. In the protocol, viable cells had clear cytoplasm whereas nonviable cells had blue cytoplasm (
28). Aliquots of the hepatocyte incubate were taken at different time points during the 6 h incubation period. At least 80–90% of the control cells were still viable after 6 h.
Determination of reactive oxygen species (ROS) formation
Hepatocyte ROS generation induced by
C. polykrikoideslysate was determined byadding dichlorofluorescin diacetate (DCFD) to the hepatocyte incubate. DCFD penetrates hepatocytes and ishydrolyzed to form non-fluorescent dichlorofluorescin. Dichlorofluorescin then reacts with ‘ROS’ to form the highly fluorescent dichlorofluorescein and effluxes the cell. ROS formation was assayed by withdrawing three-milliliter samples at different time points from
C. polykrikoideslysate treated and control hepatocytes. These samples were then centrifuged for 1 min at 50×g. The cell pellet was then resuspended in three-milliliter incubation buffer containing 1.6 μM DCFD (
29). The cells were then allowed to incubate in a thermostatic bath for 10 min with gentle shaking at 37°C. The fluorescence intensity of ROS product was measured at 500nm excitation and 520 nm emission wavelengths, using Hitachi F-2500 fluorescence spectrophotometer.
Measurement of reduced and oxidized glutathione
We measured the concentration of the reduced (GSH) and oxidized (GSSG) glutathione by a spectrofluorometric method (
30). In order to confirm the linearity of the reaction rate in the adopted method, we used commercially purified GSH and GSSG to calibrate the standard curve. For GSH measurement, the final reaction mixture volume was 200 μL, which contained 180 μL of phosphate– EDTA buffer (0.1 M sodium phosphate–0.005 M EDTA, pH = 8.0), 10 μL of o-Phthalaldehyde (OPT, 100 μg per 100 μL methanol) and 10 μL of diluted sample (1:10 in phosphate–EDTA buffer). The reaction mixture was incubated for 15 min at room temperature, and the fluorescence was measured at excitation and emission wavelength of 350 nm and 450 nm, respectively using Hitachi F-2500 fluorescence spectrophotometer.The GSH content was expressed as μM per 10
6cells/mL. GSSG was then measured using the same method outlined above, except that the sample was diluted with 10 volumes of 0.1 N NaOH containing 0.04 M of N-ethylmaleimide, instead of phosphate– EDTA buffer, in order to prevent the further oxidation of GSH to GSSG the pH of solution was adjustedto 12. The GSSG content was also expressed as μM per 106 cells/mL.
Mitochondrial membrane potential assay
The uptake and retention of the cationic fluorescent dye, rhodamine 123, has been used for the estimation of mitochondrial membrane potential. This assay is based on the fact that rhodamine 123 accumulates selectively in the mitochondria by facilitated diffusion. However, when the mitochondrial potential is decreased, the amount of rhodamine 123 that enters the mitochondria is also decreased as there is no facilitated diffusion. Thus, the amount of rhodamine 123 in the supernatant is increased and the amount in the pellet is decreased. Samples (500 μL) were taken from the cell suspension incubated at 37°C at different time points, and centrifuged at 50×g for 1 min. The cell pellet was then resuspended in 2 mL of fresh incubation medium containing 1.5 μM rhodamine 123 and incubated at 37°C in a thermostatic bath for 10 min with gentle shaking. Hepatocytes were separated by centrifugation and the amount of rhodamine 123 appearing in the incubation medium was measured fluorimetrically using Hitachi F-2500 fluorescence spectrophotometer set at 490 nm excitation and 520 nm emission wavelengths. The capacity of mitochondria to take up the rhodamine 123 was calculated as the difference in fluorescence intensity between control and treated cells (
31).
Assay of ATP and ADP
ATP was measured based on bioluminescence generated from luciferin–luciferase reaction(
32). The reaction seen below, results in the generation of measurable light at a wavelength of 562 nm:
ATP + Luciferin + O2Luciferase Oxyluciferin + AMP + PP + CO + Light (562 nm)
Both intracellular ATP and ADP measurements were performed on rat hepatocytes using the standard curve of ATP. Light emission was measured with a Sirius tube luminometer, Berthold defection system (Germany). After calibration against the ATP standard, the ATP content of the cell lysate was determined. Then, ATP/ADP ratio was calculated.
In brief, the hepatocyte cells (about 10
6 cells) were pelleted in a microcentrifuge tube by centrifugation at 3000×g for 10 min. The cellular ATP was then lysateed by adding 0.5 ml water and boiling the cell pellet for 5 min. The sample was then vortexed and centrifuged (3000×g for 5 min at 4°C), 12 μL of the supernatant was used for bioluminescence measurement. 12 μl of the supernatant was added to 25 μL cocktail (luciferin and Mg) and 10 μL of tris buffer. 5 μL luciferase enzyme was added to the mixture and luminescence was read at 562 nm. Luminescence intensity correlated to ATP level in hepatocytes. For total ATP measuring, 12 μL of the supernatant was added to 5 μL MgCl
2 and 5 μL phosphoenol pyruvate and 12 μL phosphokinase. Phosphokinase changed the ADP to ATP. The mixture was incubated for 2 min and then 25 μL cocktail (luciferin and Mg) and 5 μL luciferase were added to the mixture and consequentlyluminescence was read at 562 nm. ADP level was calculated by calculating of difference between total ATP and primary ATP (
33).
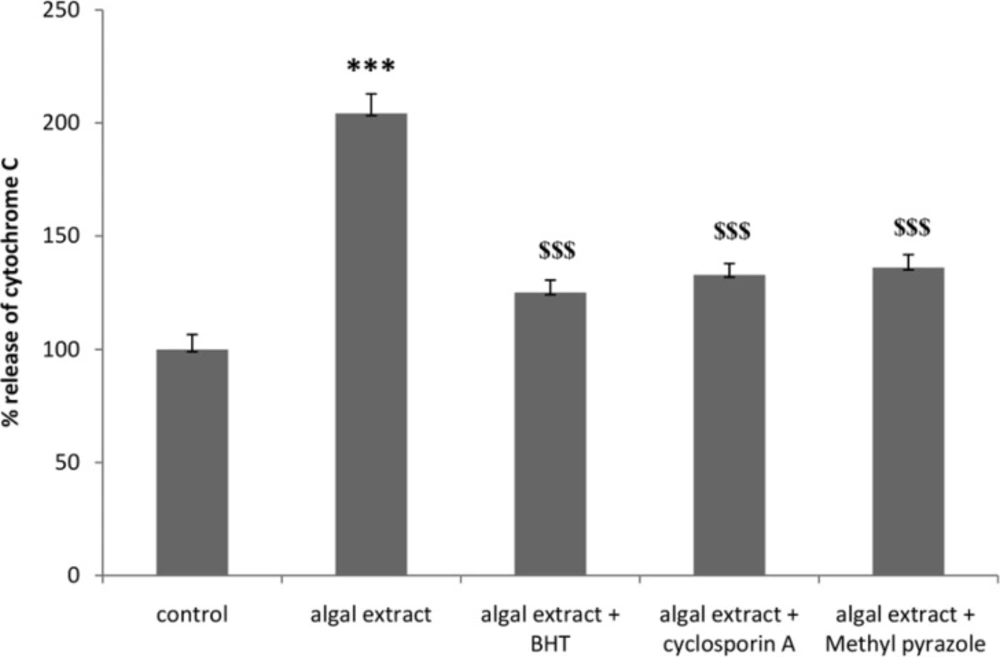
Determination of cytochrome c release
Cytochrome c release was determined by cytochrome c ELISA Kit (Quantikine M., R&D Systems, Abingdon, UK) according to the manufacturer’s instructions. In brief, cells were washed three times in PBS and then were re-suspended in Cell Lysis Buffer to a concentration of 1.5 x 10⁶ cells/mL. Cells were incubated for 1 h at room temperature with gentle mixing, and then the cells were centrifuged at 1000×g for 15 min. Supernatant was used for determination of cytochrome C.
100 μL of calibrator diluent RD5P was added to each well of a 96 well plate. Then 100 μl of standard, control and sample were added per well. After covering plate with an adhesive strip, the plate was incubated for 2 h at room temperature (20-25°C). After 2 h incubation, wells were washed four times with washing buffer. After dryness, 200 μL of cytochrome c conjugate was added to each well and the plate was incubated for 2 h at room temperature. Then the wells were washed four times with washing buffer and 200 μL of substrate solution was added to each well and again plate was incubated for 30 min at room temperature with protection from light. Next 50 μL of stop solution was added to each well. Optical density of each well was finally determined within 30 min, using a microplate reader set to λmax= 450 nm, using Tecan-spectra ELISAreader.
Determination of caspase-3 activity
Caspase-3 activity was determined in cell lysate of hepatocytes by ‘‘Sigma’s caspase-3 assay kit (CASP-3-C)’’(
34). In brief, this colorimetric assay is based on the hydrolysis of substrate peptide, Ac-DEVD-pNA, by caspase-3. The released moiety (p-nitroaniline) has a high absorbance at 405 nm. The concentration of the p-nitroaniline (μM) released from the substrate is calculated from the absorbance values obtained at λmax405 nm and then a calibration curve prepared with defined p-nitroaniline concentrations.
1X Assay Buffer was added to each of the wells. The Caspase 3 inhibitor was added to the appropriate wells. The reaction was started by adding 10 μL of caspase 3 substrate to each well and the well contents were then mixed gently by shaking to avoid bubble formation. Then the plate was covered and incubated at 37°C for 90 min. Absorbance of each well content was read at λmax405 nm. The results were calculated by a p-nitroaniline calibration curve, using Tecan-spectra ELISAreader.
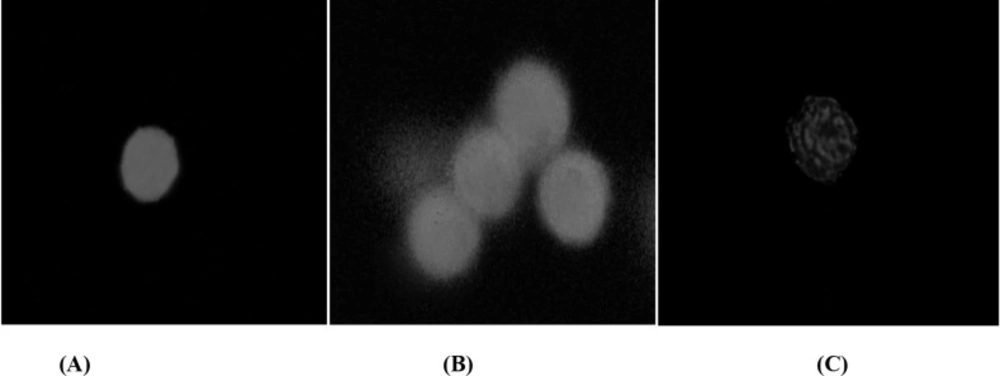
Detection of apoptosis (Annexin V-Cy3.18 binding assay)
Apoptosis phenotype was detected using Sigma–Aldrich apoptosis detection kit. Detection of apoptosis was carried out as suggested by manufacturer’s kit protocol. Briefly, the cells were washed twice with buffer IV (the buffer that isolated hepatocytes were suspended in it) and suspended at a concentration of 1×10⁶ cellsmL-1. A circle of 1 cm diameter was drawn on a polyprep poly-L-lysine coated slide for each treatment. About 50 mL of cell suspension of each treatment was added to the circle of different slides and left at room temperature for 10 min. Cells were washed twice with the binding buffer and were stained with double label staining solution containing Annexin V-Cy3.18 (AnnCy3) and 6-carboxyfluorescein diacetate (6-CFDA). After washing with five aliquots of binding buffer, each circle was covered with a cover slip and visualized under a fluorescent microscope (Motic-AE31). In hepatocytes incubated with AnnCy3 and 6-CFDA simultaneously, live cells were labeled with 6-carboxyfluororescein (6-CF) (green), while necrotic cells only with AnnCy3 (red). However, the hepatocytes in the early stage of apoptosis were dyed with both AnnCy3 (red) spots within 6-CF (green) background. A total of 250 cells were counted, and were categorized as non-apoptotic, apoptotic, and necrotic cells based on the staining pattern and were expressed as percentage of cells.
Statistical analysis
Levene’s test was used to check the homogeneity of variances. Data were analyzed using one-way analysis of variance followed by Tukey’s HSD as the post-hoc test. Results were presented as mean ± SD of triplicate samples. The minimal level of significance chosen was p < 0.05.