
1. Background
Fatty liver disease is a reversible condition that denotes the accumulation of fat vacuoles in liver cells, characterized by liver inflammation (1). Fatty liver disease can be either alcoholic or non-alcoholic (2). Non-alcoholic fatty liver disease (NAFLD) is a heterogeneous disease that sometimes transforms into steatosis or normal histology and sometimes stays relatively stable for years. However, in some cases, it causes the progressive accumulation of fibrotic scars that will lead to fibrosis (2). This disease is usually diagnosed with an increased level of alanine aminotransferase (ALT) along with other clinical and biochemical characteristics or a random finding in a suspicious abdominal sonography examination (3). In fact, measuring the levels of ALT and aspartate aminotransferase (AST) is the most useful test to diagnose this disease (2). There is no need for invasive tests to diagnose NAFLD. This disease can be diagnosed with a patient’s general description and physical examination, liver imaging (i.e., sonography is the first acceptable diagnostic test), and relevant blood tests (2).
Recent studies emphasize that fatty liver disease has significant relationships with oral/dental health and the risk of oral/dental health diseases, highlighting that injuries to internal organs, especially the digestive system, are manifested directly in the oral cavity (4). Research has shown that there are some common risk factors between fatty liver disease and oral/dental diseases, e.g., periodontitis and tooth decay, reporting that patients with untreated decay are more likely to have NAFLD (5, 6). In general, periodontitis is a chronic inflammatory disease of periodontal tissues, and the prolonged chronic oral inflammatory process is closely correlated with systemic inflammation, which is the major mechanism involved in NAFLD (7). Periodontitis is one of the main causes of tooth loss (7). Studies have also reported that tooth loss is positively correlated with liver diseases (e.g., NAFLD), increased levels of transaminase, cirrhosis, and liver cancer (8, 9). Research has also indicated that oral/dental hygiene observance, e.g., tooth-brushing, declines in patients with fatty liver disease. In other words, there is an inverse relationship between higher frequencies of tooth-brushing and NAFLD (4).
The decayed, missing, and filled teeth (DMFT) Index is one of the simplest and most common indices for epidemiologic examinations of tooth decay and oral/dental health status. This Index is calculated by summing the number of DMFT (10). After each of these three parameters is evaluated and analyzed, the number of teeth having each parameter is added to calculate the Index (11). In recent years, researchers have found a close relationship between NAFLD and oral/dental health status. As reported by Weintraub et al., patients with NAFLD experience higher risks of untreated tooth decay, periodontitis, and tooth loss (5). In addition, Kim et al. found that there was an inverse relationship between the frequency of tooth-brushing and the NAFLD risk, reporting that patients who brushed their teeth less often would be exposed to higher risks of NAFLD (4).
2. Objectives
Given the relationship between fatty liver disease and oral/dental complications (e.g., periodontitis, tooth loss, and tooth decay), this study for the first time aims to analyze and compare oral/dental health status in patients with NAFLD visiting Shahid Mofateh Clinic in Yasuj with that of a control group during 2024 - 2025.
3. Methods
In this descriptive-analytical study, a cross-sectional design was used with convenience sampling. The research sample included the eligible patients visiting Shahid Mofateh Clinic in Yasuj during 2024 - 2025. This sampling method accelerated access to the participants who met the inclusion criteria, and the cross-sectional nature of the study allowed for the simultaneous analysis of research variables in the study groups. In their study, Sven Pischke et al. (8) reported that 87.5% of patients with fatty liver disease and 47% of members in the control group had mild and extreme levels of periodontitis. Given the study power of 90%, they estimated the type I error at 1% for 86 individuals (i.e., 43 per group).
After the necessary permits were obtained from Yasuj University of Medical Sciences, the ethics code (IR.YUMS.REC.1403.042) was issued by the research ethics committee at the university. The eligible patients were identified and selected from those visiting Shahid Mofateh Clinic in Yasuj in 2024. They participated in the study after becoming completely familiar with the research goals and providing written informed consent. The statistical population included individuals aged 18 years or older with symptoms of liver steatosis detected with sonography who met the following inclusion criteria: No history of consuming alcohol or consuming less than 20 g of alcohol per day in women and less than 30 g of alcohol per day in men; no symptoms of other severe liver disorders, malignancies, cardiovascular complications, respiratory complications, and renal complications; no history of weight loss or bariatric surgery in recent years; no history of drug consumption in the past three months; and no symptoms of endocrine disorders, metabolic disorders, or diabetes. The exclusion criteria encompassed pregnancy, breastfeeding, and preference to discontinue participation. An informed consent form was obtained from every patient who participated in the study. The study protocol was initiated after it was confirmed by the research ethics committee at the university.
In this study, 43 patients whose fatty liver disease was diagnosed definitively with sonography were selected, along with their blood test results, for research purposes. The research subject and nature were then explained to these patients. The tests included measuring different parameters, such as the levels of ALT and AST. Furthermore, the control group included healthy individuals whose absence of fatty liver disease was confirmed with sonography. Dental appointments were then set and announced to examine the patients with dental probes and disposable dental mirrors under natural light. Different parameters involved in the DMFT Index, e.g., tooth discoloration and tooth structure degradation caused by decay, filling, and missing, were then analyzed. This Index was also measured in the control group, whose members resembled patients with NAFLD in terms of age and gender.
3.1. Data Analysis
All data of patients were entered into SPSS 25 for analysis. The qualitative variables were presented in percentages, whereas the quantitative ones were presented as mean ± standard deviation. The distribution pattern of the research variables was first determined through the Kolmogorov–Smirnov test. Furthermore, a t-test was employed to analyze the difference between the two groups (i.e., NAFLD and control) in the mean number of missing, filled, and decayed teeth if the research variables followed a normal distribution. Otherwise, the Mann-Whitney U test was conducted. Similarly, Pearson’s product-moment correlation coefficient was used to analyze the relationship between ALT/AST levels and the mean number of missing, filled, and decayed teeth if the data followed a normal distribution. Otherwise, Spearman’s test was employed.
4. Results
4.1. Demographic Characteristics of Participants
In total, this study included 86 participants, 43 of whom (50%) belonged to the NAFLD group, and the other 43 (50%) belonged to the control group (Table 1).
Table 1.
The Demographic Characteristics of Participants a
| Variables | NAFLD Group (n = 43) | Control Group (n = 43) | Total (n = 86) | P-Value b |
|---|---|---|---|---|
| Age | 30.2 ± 3.4 | 30.5 ± 3.8 | 30.4 ± 3.6 | 0.681 |
| Gender | 0.823 | |||
| Male | 26 (60.5) | 25 (58.1) | 51 (59.3) | |
| Female | 17 (39.5) | 18 (41.9) | 35 (40.7) | |
| Height (cm) | 170.8 ± 7.2 | 171.4 ± 7.6 | 171.1 ± 7.4 | 0.712 |
| Weight (kg) | 79.3 ± 8.9 | 67.2 ± 8.4 | 73.3 ± 10.7 | < 0.001 c |
| BMI (kg/m2) | 27.2 ± 2.1 | 22.8 ± 1.6 | 25.0 ± 2.8 | < 0.001 c |
| Education | 0.002 c | |||
| Elementary | 5 (11.6) | 0 (0) | 5 (5.8) | |
| Junior high school | 6 (14.0) | 2 (4.7) | 8 (9.3) | |
| Senior high school | 11 (25.6) | 8 (18.6) | 19 (22.1) | |
| High school diploma | 15 (34.9) | 12 (27.9) | 27 (31.4) | |
| University degrees | 6 (14.0) | 21 (48.8) | 27 (31.4) |
Abbreviations: BMI, Body Mass Index; DMFT: Decayed, Missing, and Filled Teeth index.
a Values are presented as mean ± SD or No. (%).
b Independent t-test was used for continuous variables; Chi-square test was used for categorical variable.
c P-Value < 0.05 was considered statistically significant.
As Table 1 demonstrates, there were no significant differences between the two groups in terms of age, gender, and height (P > 0.05); however, the weight and Body Mass Index (BMI) of the NAFLD group were significantly higher than those of the control group (P < 0.001). The two groups were also different in the distribution of educational attainments. In other words, the control group included a higher percentage of individuals with university degrees (P = 0.002).
4.2. Decayed, Missing, and Filled Teeth Indices
According to Table 2, the two groups had significant differences in terms of the DMFT indices. Patients with NAFLD had more decayed and missing teeth than the members of the control group, whereas they had fewer filled teeth. In other words, the mean total DMFT Index of the NAFLD group was nearly twice as much as that of the control group. As expected, the levels of liver enzymes (ALT and AST were significantly higher in the NAFLD group than in the control group (P < 0.001).
Table 2.
Comparing the Two Groups in the Decayed, Missing, and Filled Teeth Indices and Liver Tests
| Index | NAFLD Group (n = 43) | Control Group (n = 43) | P-Value a | Effect Size (Cohen’s d) |
|---|---|---|---|---|
| Decayed Teeth (D) | 7.9 ± 2.8 | 2.1 ± 1.2 | < 0.001 | 2.68 |
| Missing Teeth (M) | 6.1 ± 2.6 | 1.4 ± 0.9 | < 0.001 | 2.35 |
| Filled Teeth (F) | 3.2 ± 1.3 | 4.8 ± 1.1 | < 0.001 | -1.34 |
| Total DMFT | 17.2 ± 3.6 | 8.3 ± 1.8 | < 0.001 | 3.11 |
| ALT (U/L) | 56.4 ± 7.2 | 25.8 ± 4.1 | < 0.001 | 5.12 |
| AST (U/L) | 42.6 ± 4.8 | 23.7 ± 3.2 | < 0.001 | 4.58 |
Abbreviations: NAFLD, non-alcoholic fatty liver disease; DMFT, Decayed, Missing, and Filled Teeth Index; ALT, alanine aminotransferase; AST, aspartate aminotransferase; U/L, units per liter.
a A P-Value < 0.05 was considered statistically significant.
4.3. Part II: Oral Hygiene Habits
4.3.1. Frequency of Tooth-Brushing
The results in Table 3 indicate that the habit of tooth-brushing was significantly weaker in the NAFLD group than in the control group. In other words, 18.6% of the patients with NAFLD never brushed their teeth, whereas none of the control members exhibited such behavior. More than half of the patients with NAFLD (58.1%) never used dental floss, whereas all of the control members used dental floss in some manner (Table 3). Like other oral hygiene habits, the frequency of using mouthwash was significantly lower in the NAFLD group than in the control group (Table 3). The frequency of smoking hookah was significantly higher in the NAFLD group than in the control group (P = 0.011), and the probability of smoking hookah by NAFLD patients was 3.48 times higher than that of healthy individuals (Table 3).
Table 3.
The Frequency Distribution of Tooth-brushing, Using Dental Floss, and Using Mouthwash Between the Two Groups a
| Variables | NAFLD Group | Control Group | P-Value |
|---|---|---|---|
| Frequency of tooth-brushing | |||
| Never | 8 (18.6) | 0 (0) | 0.006 b |
| Less than once a day | 12 (27.9) | 0 (0) | < 0.001 b |
| Once a day | 18 (41.9) | 15 (34.9) | 0.518 |
| Twice a day | 5 (11.6) | 22 (51.2) | < 0.001 b |
| More than twice a day | 0 (0) | 6 (14.0) | 0.026* |
| Frequency of using dental floss | |||
| Never | 25 (58.1) | 0 (0) | < 0.001 b |
| Less than once a day | 15 (34.9) | 8 (18.6) | 0.092 |
| Once a day | 3 (7.0) | 18 (41.9) | 0.092 |
| Twice a day | 0 (0) | 14 (32.6) | < 0.001 b |
| More than twice a day | 0 (0) | 3 (7.0) | 0.241 |
| Frequency of using mouthwash | |||
| Never | 31 (72.1) | 0 (0) | < 0.001 b |
| Once a month | 9 (20.9) | 5 (11.6) | 0.257 |
| Once a week | 3 (7.0) | 32 (74.4) | < 0.001 b |
| Once a day | 0 (0) | 6 (14.0) | < 0.001 b |
| Smoking | |||
| Cigarettes | 9 (20.9) | 4 (9.3) | 0.136 |
| Hookah | 19 (44.2) | 8 (18.6) | 0.011 b |
Abbreviations: NAFLD: Non-Alcoholic Fatty Liver Disease.
a Values are presented as No. (%).
b P-values were calculated using the Chi-square test. A P-Value < 0.05 was considered.
4.4. Complementary Statistical Analyses
4.4.1. Correlation Between Liver Enzymes and Decayed, Missing, and Filled Teeth Indices
There was a positive, significant correlation between liver enzymes and DMFT indices in the NAFLD group; however, the control group lacked such a correlation (Table 4).
Table 4.
The Coefficients of Correlation between Liver Enzymes and Decayed, Missing, and Filled Teeth Indices
| Variables | ALT | AST |
|---|---|---|
| NAFLD group | ||
| Total DMFT | r = 0.542, P < 0.001 a | r = 0.498, P = 0.001 a |
| Decayed teeth | r = 0.578, P < 0.001 a | r = 0.534, P < 0.001 a |
| Missing teeth | r = 0.456, P = 0.002 a | r = 0.421, P = 0.005 a |
| Filled teeth | r = -0.298, P = 0.054 | r = -0.267, P = 0.082 |
| Control group | ||
| Total MDFT | r = 0.145, P = 0.365 | r = 0.098, P = 0.534 |
Abbreviations: NAFLD, Non-Alcoholic Fatty Liver Disease; ALT, Alanine Aminotransferase; AST, Aspartate Aminotransferase; DMFT, Decayed, Missing, and Filled Teeth.
a P-values were derived from Pearson’s correlation test. A P-Value < 0.05 was considered statistically significant.
4.5. Logistic Regression Analysis, Analysis of Variance, and Chi-squared Test
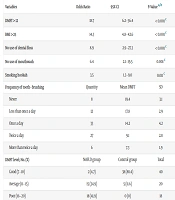
As shown in Table 5, the final model demonstrates that a DMFT Index greater than 12 is the strongest predictor of NAFLD (odds ratio = 18.7). The analysis of variance indicated that there was a significant relationship between the DMFT Index and the frequency of tooth-brushing (Table 5). As shown in Table 5, there was a strong relationship between the NAFLD status and the DMFT level.
Table 5.
The Predicting Factors of Non-alcoholic fatty liver disease (Multivariate Logistic Regression), The Comparison of Decayed, Missing, And Filled Teeth Based on the Frequency of Tooth-Brushing, and Analyzing the Relationship Between the Non-alcoholic Fatty Liver Disease Status and the Decayed, Missing, And Filled Teeth Level
| Variables | Odds Ratio | 95% CI | P–Value a, b |
|---|---|---|---|
| DMFT > 12 | 18.7 | 6.2 - 56.4 | < 0.001 c |
| BMI > 25 | 14.3 | 4.8 - 42.6 | < 0.001 c |
| No use of dental floss | 8.9 | 2.9 - 27.3 | < 0.001 c |
| No use of mouthwash | 6.4 | 2.1 - 19.5 | 0.001 c |
| Smoking hookah | 3.5 | 1.3 - 9.0 | 0.011 c |
| Frequency of tooth - brushing | Quantity | Mean DMFT | SD |
| Never | 8 | 19.4 | 3.1 |
| Less than once a day | 12 | 17.8 | 2.9 |
| Once a day | 33 | 14.2 | 4.2 |
| Twice a day | 27 | 9.1 | 2.8 |
| More than twice a day | 6 | 7.3 | 1.9 |
| DMFT level; No. (%) | NAFLD group | Control group | Total |
| Good (7 - 10) | 2 (4.7) | 38 (88.4) | 40 |
| Average (11 - 15) | 15 (34.9) | 5 (11.6) | 20 |
| Poor (16 - 20) | 18 (41.9) | 0 (0) | 18 |
| Very poor (21 - 25) | 8 (18.6) | 0 (0) | 8 |
Abbreviations: CI, confidence interval; DMFT, decayed, missing, and filled teeth; BMI, Body Mass Index; NAFLD, non-alcoholic fatty liver disease.
a Statistical analysis was performed using one-way Analysis of Variance (ANOVA). A significant overall difference was found (F = 42.18, P < 0.001).
b The association was tested using the Chi-square test: χ² = 61.45, P < 0.001, Cramér's V = 0.845.
c P-value < 0.05 was considered statistically significant.
5. Discussion
This study aimed to analyze and compare patients with NAFLD and the members of a control group in terms of oral/dental health status. The results indicated significant differences between the two groups in DMFT indices, hygiene habits, and liver enzymes. According to the results, the mean DMFT Index of patients with NAFLD was significantly higher than that of the control group. This finding is consistent with the results reported by Weintraub et al. (2019), who reported that patients with mild-to-extreme periodontitis and patients with untreated tooth decay were more likely to have NAFLD (5). Furthermore, this study confirmed that NAFLD was correlated with tooth loss, periodontitis, and untreated tooth decay (5). The number of decayed teeth in the NAFLD group was nearly four times as many as that of the control group, which indicated the critical status of oral health among these patients. This finding is consistent with the results reported by Chen et al., who indicated that periodontitis and tooth loss were positively correlated with liver diseases such as NAFLD (9). Moreover, the number of missing teeth in the NAFLD group was significantly larger than that of the control group. This result is in agreement with the findings reported by Qiao et al., who indicated that the number of missing teeth was correlated with the longer presence of NAFLD in men (7).
More interestingly, the current study demonstrated a specific pattern in the components of the DMFT Index, which shows insufficient health care among patients with NAFLD. While the control group had more filled teeth (4.8 against 3.2), patients with NAFLD had more decayed and missing teeth. This pattern might indicate ignorance of oral health among these patients. In this study, the levels of liver enzymes in the NAFLD group were significantly higher than those of the control group. More importantly, there was a positive, significant relationship between these enzymes and the DMFT Index (r = 0.542 for ALT and r = 0.498 for AST). This finding indicates that the severity of liver dysfunction was directly correlated with the deterioration of oral health status. From a mechanistic standpoint, the strong correlation between the ALT level and decayed teeth (r = 0.578, P < 0.001) supported the “mouth-liver inflammation axis” hypothesis. This finding is consistent with the results reported by Komazaki et al. (12) and Yoneda et al. (13), who indicated that oral pathogenic bacteria (e.g., Porphyromonas gingivalis) could reach the liver via blood circulation and trigger inflammatory cytokines by activating TLR4 receptors. This process could increase the production of pro-inflammatory cytokines (e.g., TNF-α and IL-6), which play a key role in the pathogenesis of steatohepatitis.
An important finding of this study was the significant difference between the two groups in terms of oral hygiene habits. In other words, 18.6% of patients with NAFLD never brushed their teeth, whereas none of the control members showed such behavior. This finding is consistent with the results reported by Kim et al., who reported that there was an inverse relationship between higher frequencies of tooth-brushing and NAFLD (4). In addition, 58.1% of NAFLD patients never used dental floss; however, all members of the control group used dental floss in some manner. Furthermore, 72.1% of NAFLD patients did not use mouthwash. This finding is consistent with the results reported by Albuquerque-Souza and Sahingur, who observed that only 33.3% of NAFLD patients brushed their teeth regularly every morning and afternoon (14). This study also indicated that the frequency of smoking hookah in the NAFLD group (44.2%) was significantly higher than that of the control group (18.6%) (P = 0.011). This finding is of special importance in Iranian society, as smoking hookah can exert pernicious effects on both oral health and the liver. Smoking hookah can dry the mouth, inflame the gums, and increase the risk of tooth decay, finally exacerbating oral complications in these patients.
The common inflammatory pathway is considered to be a possible mechanism for the relationship between NAFLD and oral health. Periodontal diseases increase the levels of systemic inflammatory cytokines, e.g., TNF-α, IL-6, and C-reactive protein (CRP), that can have an effective role in the pathogenesis of NAFLD. As reported by Pischke et al., 87.5% of non-alcoholic steatohepatitis (NASH) patients and 47% of control individuals had mild-to-extreme periodontitis (8). Periodontopathic bacteria can affect the liver via blood circulation or the mouth-intestine-liver pathway. Yoneda et al. indicated that the frequency of diagnosing P. gingivalis in patients with NAFLD was significantly higher than in patients without NAFLD (13). Both NAFLD and oral diseases are correlated with metabolic syndromes, insulin resistance, and obesity. The results of this study showed that the BMI of the NAFLD group (27.2) was significantly higher than that of the control group (22.8), a finding which can be a confounding factor in the relationship between these two diseases. The results are consistent with the findings reported by Alazawi et al., who showed that periodontitis was significantly comorbid with steatosis in 8172 adults (15). Furthermore, Shin et al. indicated that periodontitis increased the risk of NAFLD by 4% (16). Reviewing 24 cross-sectional studies in a meta-analysis, Oliveira et al. concluded that tooth decay might be a relevant problem in patients before and after liver transplant (17). This finding highlights the importance of following up and treating oral complications in patients with liver diseases.
A key innovation of this study is to introduce the clinical threshold of DMFT > 12 as a powerful predicting indicator for NAFLD (odds ratio = 18.7; 95% confidence interval: 6.2-56.4), which can be used as a low-cost tool at dental clinics to identify high-risk patients. Furthermore, the findings support the dose-response relationship between hygienic behaviors and NAFLD. In other words, increasing the number of daily tooth-brushing attempts by one decreased the risk of NAFLD by 65% (odds ratio = 0.35). This finding confirms that improving oral hygiene can be considered an effective prevention strategy. As reported by Pischke et al. (8), educational interventions reduced the prevalence of periodontitis by 40% among patients.
From a clinical perspective, these findings have three major outcomes:
(1) Integrated screening: Dentists can recommend patients with DMFT > 12 for liver evaluation.
(2) Behavioral interventions: Oral health promotion programs should be integrated into gastroenterology and liver clinics.
(3) Treatment: Oral health improvement can be used as an Index for response to NAFLD treatment.
5.1. Limitations
This study has some limitations that should be acknowledged. First, although we controlled for major confounders, residual confounding factors (such as detailed dietary habits or socioeconomic status) might have influenced the results. Second, the DMFT Index reflects cumulative lifetime dental experience and may not represent current oral hygiene practices. Future longitudinal studies are warranted to confirm our findings and explore the temporal relationship.
5.2. Conclusions
The results of this study indicated that there was a significant relationship between NAFLD and the poor status of oral/dental health. Patients with NAFLD had higher DMFT indices, weaker oral health habits, and higher hookah consumption rates. Moreover, the positive correlation between liver enzymes and oral health indices indicated a deep biological relationship between these two systems. These findings highlight the necessity of developing an integrated approach to caring for patients and establishing close cooperation between dentists and internal medicine specialists. The early prevention and treatment of oral complications can play a beneficial role in controlling NAFLD effectively. Finally, this study is regarded as a major step in clarifying and understanding the relationship between oral health and liver in an Iranian population and can be used as a base for future research and development of integrated treatment solutions.