
1. Background
The International Agency for Research on Cancer reported 19.3 million new cases of cancer around the world in 2020, including 2.3 million new breast cancer cases (11.7%), making it the most prevalent diagnosed cancer type. It remained the world's 5th leading cause of cancer death, with an estimated 6.9% of deaths of all cancer (1). In Iran, the annual incidence rate of breast cancer was 23.1 new cases per 100 000, making it the most common cancer type in Iranian women (2). It is reported that newly diagnosed breast cancer cases are mainly in the advanced stages, which is incurable in most cases (3). Therefore, the identification of novel biomarkers for early detection, prediction of therapeutic response, and prognosis has attracted attention from scientists around the world.
Triggering receptor expressed on myeloid cell 2 (TREM2) appears as one member of the transmembrane receptor’s family, expressed on various myeloid cells, such as monocytes, macrophages, and dendritic cells. TREM2 is implicated in regulating inflammatory responses and immune responses by binding to the DNAX-activation protein 12 (DAP12), which is a transmembrane adaptor protein (4). TREM2 signaling occurs through tyrosine residue phosphorylation of the DAP12 cytoplasmic domain, leading to the activation of downstream target genes. In the last decade, most studies on TREM2 have extensively focused on its role in preventing inflammation through suppressing Toll-like receptor (TLR) signaling (4, 5). Recently, extensive data have exhibited the role of TREM2 in a large number of human malignancies, especially in lung cancer, colon cancer, and hepatocellular carcinoma (HCC) (6). TREM2 can regulate the cellular processes associated with tumorigenesis by controlling the phosphatidylinositol 3‑kinase (PI3K)/protein kinase B (Akt) signaling cascade (6).
Moreover, tandem C2 domains nuclear protein (TC2N) is a putative C2 domain-containing protein belonging to the carboxyl-terminal type (C-type) tandem C2 protein family (7). Emerging evidence has shown that TC2N has a role in cell signaling transmission and protein-protein interactions. Based on the findings of preliminary studies, TC2N can control cell proliferation and tumor growth. However, limited studies have determined the role of TC2N in human cancers (7, 8). Recently, TC2N was introduced as a novel oncogene that represses the p53 signaling cascade in human lung cancer (9). Another study has revealed the tumor-suppressive action of this gene in breast cancer. The mechanism, by which TC2N acts as a tumor suppressor, appears to be the suppression of tumor growth by blocking the PI3K-AKT signaling pathway (10).
2. Objectives
In this study, we sought to determine the mRNA level of TC2N and TREM2 in breast cancer tissues in comparison with adjacent non-cancerous tissues. Also, the possible roles of TC2N and TREAM2 in breast cancer were evaluated by showing the linkage between the level of TC2N and TREM2 gene expression and the degree or stage of cancer.
3. Methods
3.1. Patient and Tissue Sample Collection
In this case-control study, 50 breast cancer tissue samples were obtained from Tumor Bank, Imam Khomeini Hospital, Tehran, Iran. Signed informed consent was taken from all participants by tumor bank staff. The adjacent non-cancerous tissues were obtained as control samples, and subsequently, both the malignant and normal tissues were confirmed by a specialist pathologist. The clinicopathologic features such as tumor size, grade, and tumor stage were provided by Tumor Bank. Women aged 25 to 65 years, who had carcinoma breast cancer and had received no radiation or chemical therapies, were included in this study. In addition, the patients, who had any other malignancy, were excluded. All samples were freshly frozen in liquid nitrogen and kept at -70°C until the time of molecular evaluations. For this study, we obtained ethical approval from the Medical Ethics Committee of the Ahvaz Jundishapur University of Medical Science.
3.2. RNA Extraction and Quantitative Real-time PCR Analysis
Total RNA was extracted from 25 collected malignant breast samples and 25 adjusted normal breast tissue samples using Trizol Reagent (GeneAll Biotechnology, Seoul, Korea) according to the manufacturer’s instructions. The quality of extracted mRNA was assessed by agarose gel electrophoresis. Visualization of 28S and 18S rRNAs related bands with a 28S:18S rRNA ratio of 2:1 confirmed intact RNA.
Then, the cDNA was synthesized from about 1 µg of total RNA, using Add Script cDNA Synthesis Kit (ADDBIO, Korea) according to the manufacturer’s instructions. Finally, the quantitative real-time polymerase chain reaction (q-RT-PCR) assay was performed on the qTOWER 3 Real-Time PCR instrument (Analytik Jena, Germany), using a Real Q Plus 2x Master Mix Green (Ampliqon, Denmark). The process of qRT-PCR consists of incubation at 95°C for 15 min as the initial step and 40 cycles of 15 sec at 95°C followed by 60 sec at 59°C as the amplification step. Then, melting curve analysis was carried out with linear heating from 60 - 90°C.
Hypoxanthine phosphoribosyl transferase 1 (HPRT) was amplified as an internal control for data normalization. This test was carried out in duplicate. The sequences of primers used in the present study were presented in Table 1. PCR efficiency for each primer was assessed by LinRegPCR software. Since the PCR efficiency for all primers was > 90%, the fold change of TREM2 and TC2N genes in breast cancerous tissues in comparison with non-cancerous adjacent tissues was calculated according to 2-∆∆Ct.
Table 1.
Primers Sequences
| Genes | Forward Primer (5'->3') | Reverse Primer (5'->3') | Product Length |
|---|---|---|---|
| TREM2 | CCCATGATGCGGGTCTCTAC | CTCGAAGCTCTCAGACTCCC | 149 |
| TC2N | AGAGTTGCTGTGGAGGATGT | AGCCAAGCTGAGGCTTTACA | 150 |
| HPRT | CCTGGCGTCGTGATTAGTG | TCAGTCCTGTCCATAATTAGTCC |
3.3. Statistical Analysis
Statistical analyses of data were carried out, using SPSS 24.0 software (SPSS Inc., Chicago, USA). The Kolmogorov-Smirnov (K-S) test was applied to estimate the normal distribution of data. To compare the average gene expression between the two groups, an independent one-sample t-test or Mann- Whitney test was used. Also, a one-way ANOVA test (or Kruskal-Wallis test) was used for the comparison of the average gene expression between more than two groups. The sensitivity and specificity of TREM2 and TC2N biomarkers were calculated by receiver operating characteristic (ROC) curves. The correlation between the expression levels of TC2N and TREM2 genes was determined by the Pearson test. A P-value below 0.05 (P < 0.05) was considered significant.
4. Results
4.1. Clinicopathological Characteristics of Patients with Breast Cancer
The breast cancer patients' demographic and clinicopathologic features are presented in Table 2. The average age of participants in the present study was 48.4 ± 1.5 years with 56.3% under 50 years and 43.7% older than 50 years. In addition, the race of 40% of patients was Azari. Also, 80% of patients were classified as having Stage I-II, and 52% of those had a tumor grade of II. Around 56% of patients had tumor diameters less than or equal to 5 cm and 44% of those had tumor diameters larger than 5 cm (Table 2).
Table 2.
Patients’ Demographic Information
| Parameters | Patients Group (%) |
|---|---|
| Age, y | |
| < 50 | 56.3 |
| ≥ 50 | 43.7 |
| Race | |
| Persian | 24.0 |
| Azari | 40.0 |
| Gilaki and Mazani | 26.0 |
| Kurd | 4.0 |
| Lur | 6.0 |
| Stage | |
| I-II | 80.0 |
| III | 20.0 |
| Histology grade | |
| Grade I (low-well differentiated) | 14.0 |
| Grade II (intermediate-moderately differentiated) | 52.0 |
| Grade III (high-poor differentiated) | 34.0 |
| HER2 | |
| Positive | 38.0 |
| Negative | 62.0 |
| Tumor size (cm) | |
| < 5 | 56.0 |
| ≥ 5 | 44.0 |
4.2. Expression of TREM2 and TC2N Genes in Breast Cancer Clinical Specimens
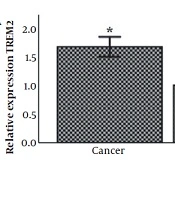
The mRNA level of TREM2 and TC2N genes in 50 breast cancer tissue samples and 50 matched normal tissues were evaluated, using the Q-RT-PCR technique. As shown in Figure 1A, TREM2 gene expression in breast cancer tissue was increased (1.77 ± 0.08-fold, P < 0.05) compared to the respective control. It was also shown a significant overexpression of TC2N by 1.57 ± 0.1-fold (P < 0.05) in breast cancer samples in comparison with normal tissues (Figure 1B).
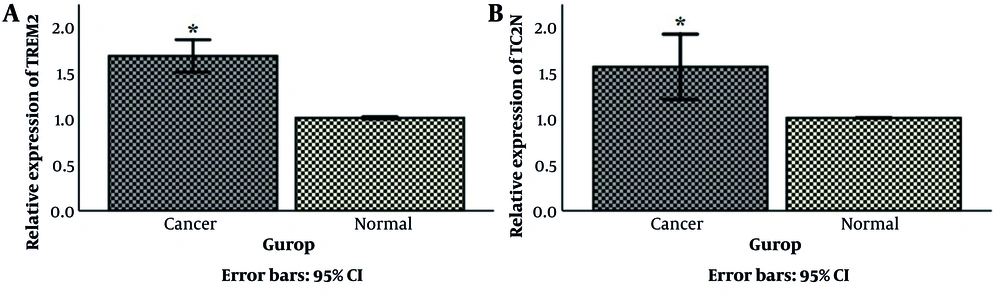
Figure 1.
Comparison of (A) TREM2 and (B) TC2N mRNA expression between breast cancer tumors and normal adjacent breast cancer tissues. Data were reported as mean ± standard deviation (SD). HPRT1 was used as an internal control. *P < 0.05. TC2N, tandem C2 domains nuclear protein; TREM2, triggering receptor expressed on myeloid cell 2; HPRT1, hypoxanthine phosphoribosyl transferase 1.
4.3. Association Between TREM2 and TC2N Gene Expression and Clinicopathological Parameters in the Breast Cancer Patients
The relation between the level of TREM2 mRNA and several clinicopathological features of breast cancer is shown in Table 3. The results indicated that the increased level of TREM2 mRNA was significantly correlated to tumor size (P = 0.001), necrosis (P < 0.004), lymphatic (P = 0.023), and vascular invasion (P = 0.023). However, a significant correlation between the mRNA level of TREM2 and other clinicopathological features, including tumor stage, grade, and histopathological markers including (Her2, p53, estrogen receptor (ER), and progesterone receptor (PR) was not confirmed (P > 0.05, Table 3).
Table 3.
Association of TREM Expression with Breast Cancer Clinicopathological Characteristics a
| Variables | Mean Fold Change ± SD | High (n = 38), No. (%) | Low (n = 12) | P-Value |
|---|---|---|---|---|
| Tumor size (cm) | 0.001 | |||
| < 5 | 1.535 ± 0.501 | 16 (57.1) | 12 (42.9) | |
| ≥ 5 | 2.069 ± 0.520 | 22 (100.0) | 0 (00.0) | |
| Grade | 0.148 | |||
| I | 1.379 ± 0.566 | 3 (42.9) | 4 (57.1) | |
| II | 1.823 ± 0.362 | 24 (92.3) | 2 (7.7) | |
| III | 1.849 ± 0.771 | 11 (64.7) | 6 (35.3) | |
| Stage | 0.151 | |||
| I-II | 1.712 ± 0.579 | 29 (72.5) | 11 (27.5) | |
| III | 2.003 ± 0.496 | 9 (90.0) | 1 (10.0) | |
| Her2 | 0.244 | |||
| Positive | 1.891 ± 0.653 | 15 (78.9) | 4 (21.1) | |
| Negative | 1.696 ± 0.511 | 23 (74.2) | 8 (25.8) | |
| ER | 0.297 | |||
| Positive | 1.838 ± 0.494 | 29 (85.3) | 5 (14.7) | |
| Negative | 1.626 ± 0.718 | 9 (56.3) | 7 (43.8) | |
| PR | 0.069 | |||
| Positive | 1.885 ± 0.527 | 26 (83.9) | 5 (16.1) | |
| Negative | 1.582 ± 0.603 | 12 (63.2) | 7 (36.8) | |
| P53 | 0.469 | |||
| Positive | 1.719 ± 0.582 | 18 (85.7) | 3 (14.3) | |
| Negative | 1.839 ± 0.561 | 20 (69.0) | 9 (31.0) | |
| Necrosis | 0.004 | |||
| Positive | 1.949 ± 0.603 | 19 (76.0) | 6 (24.0) | |
| Negative | 1.477 ± 0.368 | 11 (44.0) | 14 (56.0) | |
| Lymphatic invasion | 16 (84.2) | |||
| Positive | 2.027 ± 0.667 | 3 (15.8) | 0.023 | |
| Negative | 1.612 ± 0.444 | 22 (71.0) | 9 (29.0) | |
| Vascular invasion | 0.023 | |||
| Positive | 2.027 ± 0.667 | 16 (84.2) | 3 (15.8) | |
| Negative | 1.612 ± 0.444 | 22 (71.0) | 9 (29.0) |
Abbreviations: ER, estrogen receptor; PR, progesterone receptor; TREM2, triggering receptor expressed on myeloid cell.
a High means over the cut-off value; Low means under the cut-off value.
Evaluation of the association between TC2N gene expression and clinicopathological features of breast tumors showed that tumors that were smaller than 5 cm in size had a lower expression of TC2N (P < 0.001) (Table 4). Also, the TC2N gene expression had a significant difference in various tumor grades as the higher-grade cluster of the tumors had the higher level of TC2N mRNA (P = 0.036). In addition, the relative expression of TC2N in the higher-stage group was increased (P = 0.001). Moreover, evaluating the association between the TC2N gene expression and the presence of p53 evaluated that a higher expression level of TC2N was associated with the p53 negative condition (P = 00.2). However, an association between TC2N gene expression and other clinicopathological characteristics was not confirmed (Table 4).
Table 4.
Association of TC2N Expression with Breast Cancer Clinicopathological Characteristics a
| Variables | Mean Fold Change ±SD | High (n = 30), No. (%) | Low (n = 20), No. (%) | P-Value |
|---|---|---|---|---|
| Tumor size (cm) | < 0.001 | |||
| < 5 | 1.196 ± 0.504 | 10 (35.7) | 18 (64.3) | |
| ≥ 5 | 2.061 ± 0.761 | 20 (90.9) | 2 (9.1) | |
| Grade | 0.036 | |||
| I | 0.961 ± 0.625 | 1 (14.3) | 6 (85.7) | |
| II | 1.579 ± 0.749 | 15 (57.7) | 11 (42.3) | |
| III | 1.827 ± 0.714 | 14 (82.4) | 3 (17.6) | |
| Stage | 0.001 | |||
| I - II | 1.400 ± 0.653 | 20 (50.0) | 20 (50.0) | |
| III | 2.284 ± 0.772 | 10 (100.0) | 0 (00.0) | |
| Her2 | 0.329 | |||
| Positive | 1.712 ± 0.622 | 23 (69.7) | 10 (30.3) | |
| Negative | 1.494 ± 0.831 | 9 (52.9) | 8 (47.1) | |
| ER | 0.091 | |||
| Positive | 1.701 ± 0.684 | 24 (70.6) | 10 (32.3) | |
| Negative | 1.312 ± 0.863 | 6 (37.5) | 10 (56.6) | |
| PR | 0.109 | |||
| Positive | 1.357 ± 0.772 | 9 (47.4) | 11 (44.0) | |
| Negative | 1.712 ± 0.731 | 21 (67.7) | 7 (28.0) | |
| P53 | 0.002 | |||
| Positive | 1.302 ± 0.660 | 8 (38.1) | 13 (61.9) | |
| Negative | 1.956 ± 0.736 | 11 (37.9) | 18 (63.1) | |
| Necrosis | 0.989 | |||
| Yes | 1.578 ± 0.844 | 21 (70.0) | 9 (30.0) | |
| No | 1.575 ± 0.618 | 11 (55.0) | 9 (45.5) | |
| Lymphatic invasion | 0.929 | |||
| Yes | 1.585 ± 0.633 | 12 (38.7) | 19 (61.3) | |
| No | 1.563 ± 0.949 | 7 (36.8) | 12 (63.2) | |
| Vascular invasion | 0.929 | |||
| Yes | 1.563 ± 0.949 | 7 (36.8) | 12 (63.2) | |
| No | 1.585 ± 0.633 | 12 (38.7) | 19 (61.3) |
Abbreviations: ER, estrogen receptor; PR, progesterone receptor; TC2N, Tandem C2 domains nuclear protein.
a High means over the cut-off value; Low means under the cut-off value.
4.4. Sensitivity and Specificity of the Studied Genes
Rock curve analysis was used to evaluate the specificity and sensitivity of these genes (Figure 2). The area under the curve (AUC) shows the diagnostic accuracy of these genes, which was 0.88 (P = 0.000) for the TREM2 and 0.81 (P = 0.000) for the TC2N. According to the results, considering the cut-point value of 1.2, the sensitivity of TREM2 was 84%, and its specificity was 94%. For the TC2N gene, with a cut-point value of 1.04, a sensitivity of 72% and a specificity of 100% were calculated (Table 5).
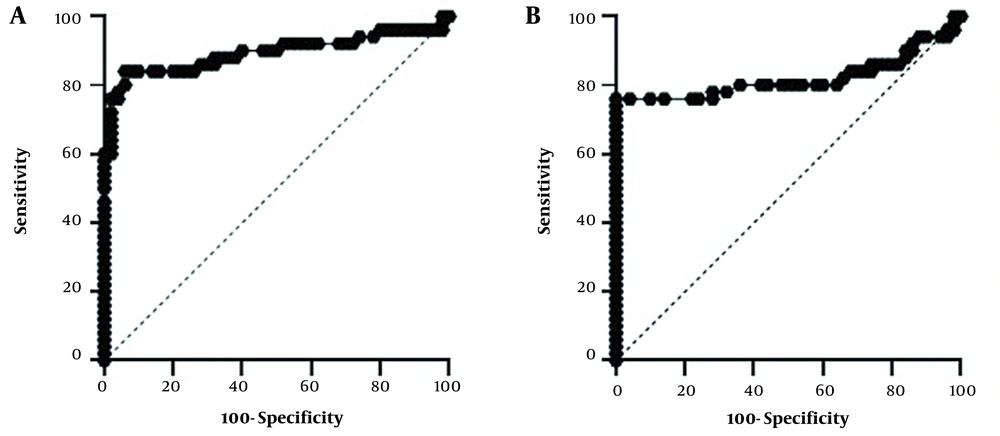
Figure 2.
The ROC curve analysis for estimating the diagnostic power of (A) the level of TREM2 gene expression for discrimination of breast tumor tissues and normal tissues, (B) the level of TC2N gene expression for discrimination of breast tumor tissues and normal tissues.
Table 5.
ROC Curve Analyses for Evaluation of the Diagnose
| Gol | AUC (95% CI) | Cut Off | Sensitivity | Specificity | P-Value |
|---|---|---|---|---|---|
| TREM2 | 0.888(0.836 to 0.940) | 1.275 | 84 | 94 | < 0.0001 |
| TC2N | 0.817 (0.750to 0.886) | 1.045 | 72 | 100 | < 0.0001 |
Abbreviations: GOI, gene of interest; AUC, area under the curve.
4.5. Correlation Between the Expressions of TREM2 and TC2N Genes
To evaluate the association between the expression levels of TREM2 and TC2N, the analysis of correlation was performed. The results of statistical analysis indicated a poor positive significant correlation between TREM2 and TC2N genes (r = 0.26, P = 0.06) (Table 6).
Table 6.
Impact of Relative TREM and TC2N Expression
| TREM2 | TC2N | P-Value | |
|---|---|---|---|
| TREM2 | 0.059 | ||
| Pearson correlation | 1 | 0.269 | |
| N | 50 | 50 | |
| TC2N | 0.059 | ||
| Pearson correlation | 0.269 | 1 | |
| N | 50 | 50 |
5. Discussion
Cancer is a complicated and heterogeneous disorder, and the characteristics of a particular type of cancer vary from person to person (11). This leads to constant efforts to discover new biomarkers for the diagnosis, prognosis, or therapeutic monitoring used alone or in combination with other markers (12). TC2N is a gene that has been proposed to play an important role in tumor formation and development recently (8-10). According to the findings, TC2N gene expression was upregulated in breast cancerous tissue compared to adjacent non-cancerous tissues. Furthermore, a high TC2N mRNA level was significantly associated with higher tumor grade. This finding was in the line with some previous studies. Hao et al. found that TC2N protein levels are higher in patients with lung cancer than in normal subjects. One of the roles of the TC2N protein as an oncogene in lung cancer is through P53 regulation (9). P53 regulates the expression of downstream target genes, including BAX, P21, and BCL2. Evidence has shown that post-translational modifications such as phosphorylation can affect the stability and activity of P53. cyclin-dependent kinase 5 (CDK5) acts as an important upstream activator in p53 phosphorylation (13, 14). Hao et al. concluded that TC2N suppresses the p53 signaling cascade in human lung malignant tumors through phosphorylating CDK5 (9). The role of TC2N in lung tumor metastasis has also been demonstrated by triggering the nuclear factor kappa B (NF–κB) signaling pathway. TC2N degrades NF–κB by phosphorylating an NF–κB inhibitor called IκB (15).
On the other hand, the findings are consistent with Hao et al.'s research that introduced TC2N as a new suppressor tumor in breast cancer. They evaluated the level of TC2N expression in breast cancer samples and showed a higher expression of TC2N in breast cancer tissues compared to non-cancerous samples. However, patients with a low level of TC2N expression had higher stages showing the tumor suppressor role of TC2N in breast cancer. Also, their study showed a significant correlation between TC2N mRNA level and HER-2 protein expression; however, the correlation between TC2N gene expression and ER or PR protein expression was not verified (10). In our study, there was no significant difference between TC2N expression and expression of ER, PR, and Her2 (see Table 4). Yet, the effect of TC2N as a tumor suppressor gene on the molecular mechanism within the tumor cell is unclear. Activation of the PI3K-AKT signaling pathway is an important feature in a wide range of human cancers (16). A large number of studies have shown involving of PI3K-AKT signaling in regulating metabolism, tumor growth, tumor cell viability, tumor angiogenesis, and tumor cell metastasis. Based on Hao et al.’s study, it seems that the TC2N tumor suppressor role is due to its inhibitory effect on the PI3K-AKT signaling pathway (10, 16, 17).
The findings indicated that the level of TREM2 mRNA in breast cancerous tumors was significantly increased in comparison with adjacent non-cancerous tissues. Recent research has shown that the TREM2 gene is overexpressed in 16 types of cancer, and immunohistochemical analysis confirmed these results at the protein level (18). The results for gastric and glioma tumors were similar to the results of our research. In this regard, Zhang et al. examined the expression of TREM2 in 317 samples of gastric cancer tissues and 317 adjacent tissues. They highlighted that TREM2 mRNA and protein levels in the tissues of gastric cancer patients were significantly increased compared to adjacent tissues. The increased level of this oncogene is significantly associated with tumor grade and tumor stage (19). Contrary to these findings, we found no significant relationship between increased TREM2 mRNA expression with tumor stage and grade. However, High TREM2 mRNA level was significantly associated with larger tumor size, necrosis, and lower lymphatic and vascular invasion.
According to the reports published by Wang et al., the expression of TREM2 in glioma tissues was significantly enhanced compared to non-tumor tissues, and also a direct correlation was observed between TREM2 expression and tumor grade. They suggested that the silencing of TREM2 expression suppressed the cell proliferation and invasion of glioma cell lines that can be considered a novel therapeutic target in human glioma (20).
Conversely, other studies have indicated the tumor-suppressive role of TREM2 in HCC and colorectal carcinoma. Tang et al. identified TREM2 as a new tumor suppressor gene in HCC. Also, a direct relationship between decreased TREM2 expression in tissue samples of patients and more invasive pathological features of HCC was reported (6). Using HepG2 cells and an animal model of hepatocarcinoma, PI3K/AKT was shown as the main signaling pathway induced by TREM2 to control the biological behavior of malignant cells. They revealed that TREM2 phosphorylated and inactivated β-catenin by inhibiting the GSK3β and PI3K/AKT pathways, thereby reducing the growth and metastasis of HCC (21). In another study, Kim et al. identified TREM2 as a tumor suppressor in colorectal carcinoma as TREM2 reduces the proliferation of HT29 colorectal cancer cells by reducing cyclin D1 expression (22).
In the present study, ROC analysis showed a sensitivity of 84% and a specificity of 94% for the TC2N gene to verify cancer tissue against normal tissue. Also, it showed 72% sensitivity and 100% specificity for the TREM2 gene to confirm breast cancer. Despite the excellent specificity, TC2N sensitivity was not suitable in our samples. The present study has several limitations. One of the limitations was the small number of samples studied and the lack of presence of normal tissue from healthy people. Also, due to financial constraints, the protein expression of the studied genes was not measured.
5.1. Conclusions
In conclusion, the results demonstrated an important advance in our understanding of the possible oncogenic roles of TREM2 and TC2N in breast cancer. But, these results will need to be verified in further studies with a larger sample size. Furthermore, it is suggested that to understand better the role of these genes in breast tumorigenesis, TC2N- and TREM2-related signaling pathways should be investigated in vitro, in vivo, and human studies.