
1. Background
Abundant genetic data on the use of conventional methods have failed to find the relationship between genes and cancer (or any other type of disease). Artificial intelligence and machine learning are critical tools in discovering such relationships (1). Diagnosing individuals prone to cancer is one of the machine learning applications that this study pursued.
Numerous studies have focused on the diagnosis and treatment of various cancers, including oral, pediatric, melanoma, lung, and gastric cancers, using patients’ genetic data (2-4). Breast cancer and colorectal cancer (CRC) have also been a hotbed of research. In this regard, about 19.3 million new cancer cases (18.1 million excluding non-melanoma skin cancer) and almost 10.0 million cancer deaths (9.9 million excluding non-melanoma skin cancer) were reported worldwide in 2020. Female breast cancer surpassed lung cancer as the most commonly diagnosed cancer, with about 2.3 million new cases (11.7%), followed by lung (11.4%), colorectal (10.0%), prostate (7.3%), and stomach (5.6%) cancers. Lung cancer remained the leading cause of cancer death, accounting for about 1.8 million deaths (18%), followed by colorectal (9.4%), liver (8.3%), stomach (7.7%), and female breast (6.9%) cancers (5). In addition to the prevalence of cancer, any patient diagnosed with cancer burdens a high cost to the family and society to get proper treatment. Such a treatment varies largely by tumor type and stage (6) or even the care provider facilities regarding the number of costs to be covered (7). According to the Financial Burden of Cancer calculated for the US, on average for all cancer sites, this country approximately spent $208.9 billion to treat patients in 2020. This is $29.8 billion for female breast cancer with the highest costs followed by colorectal cancer with $24.3 billion (8). Such an economic burden forces a financial toxicity that may lead to lower quality of life, general loss of productivity, financial debt, etc. Cancers may rise due to many causes including tobacco, pharmaceuticals, hormones, human immunodeficiency virus, etc. (9). At the genetic level, these factors may lead to a change in the expression level of some genes.
So far, some genes, including MDM2, CD82, MED1, miR-34a, miR-520h, HDAC1, CYP1A1, NTN4, EIF4EBP1, ATG4A, BAG1, MAP1LC3A, SERPINA1, MMP1, and MMP9 are identified as the risk factors of breast cancer. Relevant studies on these genes concluded that they could develop breast cancer (10-17). Similarly, some genes, including PTEN, P62, NOD2, TP53, MSH3, POFUT1, RPRD1B, EIF6, MGP, FGF2, OGDHL, CYP24A1, WNT1, KLF5, WNT16, CLDN1, and TET3 have been effective in CRC development (18-25).
Analyzing any change in the expression of the genes can help in understanding the main causes of the disease and reveals at which state the disease is and how to handle it and plan proper and efficient treatments in numerous fields of application, such as drug designs (26) and personalized medicines (27).
The gene expressions have been studied, using different methods, including heat maps, clustering, gene set enrichment, and pathway analysis using gene ontology, network analysis, and machine learning (28-30). Machine learning is used to predict information, including survival rates, outcomes, and disease diagnosis (30) that lies in supervised and unsupervised categories. As a supervised learning approach, SVM with a wide variety of kernels has been adopted in the biomedical domain including breast cancer, CRC, etc. (31-34).
The studies were conducted from different viewpoints with different datasets from structured to unstructured data. For instance, de Ronde et al. (33) used SVM to predict breast cancer chemotherapy resistance. Although their results did not show a huge variance of accuracy on the algorithm; however, the results for SVM might improve by adopting some other kernels or feature selection methods. In another study, Smolander et al. (34) compared deep belief networks to SVMs to classify gene expression data in deep learning and traditional machine learning approaches. They realized that combining deep belief networks and SVM outperforms traditional approaches.
In general, SVM demonstrates some advantages in many ways, specifically in high classification accuracy and small computation (35). In addition, one critical issue while using SVM is feature selection. Selecting the optimum number of features has a critical role especially when working with large datasets. This can speed up training, avoid overfitting and result in better classification. An improper set of features leads to inaccuracy of the classification result (35).
An issue with microarray data is that they are unbalanced; the number of available samples in each class is not equal, which makes the classification biased toward the class having the majority of samples; also, ranking of features is considered a challenge (36).
Feature selection is primarily focused on removing non-informative or redundant predictors from the model (37) that are either a wrapper or filter methods. Filter-type methods select variables regardless of the model relying on statistical methods. Wrapper methods evaluate subsets of variables, which allows for the detection of the possible interactions amongst variables (38). Thus, adopting a proper filter selection method can boost the output and performance of the classifier.
This study presents an SVM-based algorithm to diagnose individuals prone to breast cancer and CRC. This study has chosen an SMO solver as the kernel and followed a filter type of feature extraction. To achieve better and more accurate results, the k-fold method was used, which is a validation technique splitting the data into k subsets. Then, the average error from all these k trials forms the overall error. This is more reliable than the standard handout method.
2. Objectives
This study aimed at proposing a method to classify cancer-prone and healthy individuals under breast cancer and CRC, using machine learning methods efficiently, increasing the accuracy of the classification process. Such a classifier can, then, be used as an assistive tool for healthcare providers specifically pathologists and genetics scientists to diagnose patients with more accuracy and move toward better therapeutic solutions based on the set of selected features.
3. Methods
3.1. Data Sources
Different studies have used different datasets to evaluate their algorithms and obtain results. This study used gene expression data. Gene expression datasets obtained from the National Center for Biotechnology Information (NCBI) database for breast cancer and CRC were GSE15852 and CRC GSE44076, respectively (39). The breast cancer dataset included gene expressions from 43 healthy and 43 tumor samples. The CRC dataset also included gene expressions from 148 healthy and 98 tumor samples. There were 22 283 and 49 386 genes in the datasets of breast cancer and CRC, respectively. The datasets were downloaded on March 2021. Their implementation and data analysis was performed, using Matlab 2017. The source code of the implemented algorithm is available on GitHub.
3.2. Feature Extraction
The large volume of information and the large dimensions of the problem make the machine learning algorithms first look for reducing problem dimensions. In machine learning algorithms, this section, known as feature selection or feature extraction, is one of the main steps in classification algorithms, upon which the computational/memory complexity and accuracy of the algorithms depend. The selection of numerous features increases the complexity of the algorithm and the accuracy of the algorithm and vice versa. Accordingly, the number of selected features is a trade-off between the computational/memory complexity and the algorithm’s accuracy. In this study, the selected features were genes. The primary objective of this study was to select genes, whose changes in gene expression indicate the presence of cancer.
First, there should be a calculation of the average gene expression for all healthy and tumor samples to select the best features. It is necessary to remove the outlier data for the average calculation; however, due to the low variance, there was no need to remove any data. The formula for calculating these average numbers for each gene g are shown in Equations 1 - 4 where
After calculating the mean values, the best features were selected from the genes for data clustering. To this end, the average ratio of each gene in the healthy state to the tumor state was calculated according to Equations 5 and 6.
Now each gene should have a score to select the best genes based on this score. The scores were assigned in a way that any decrease or increase in gene expression would have the same effect. With this limitation, Equations 7 and 8 are the best to score the genes. The absolute value of the logarithm causes the ratios
3.3. Support Vector Machine
As previously mentioned, this study clustered the samples into two categories of normal and cancer-prone. Accordingly, SVM was useful in this classification. This study used the SVM with the SMO solver approach for the quadratic kernel (40). The SVM relies on a classifier depending on the dataset to be linear for two-dimensional ones or any hyperplane for multidimensional. The SMO solver boosts the training process more efficiently.
The present study also used a neural network to investigate the performance of SVM. Figure 1 depicts the general structure of the machine learning method and the prediction based on supervised learning. The output model after training is a trained SVM or a trained neural network.
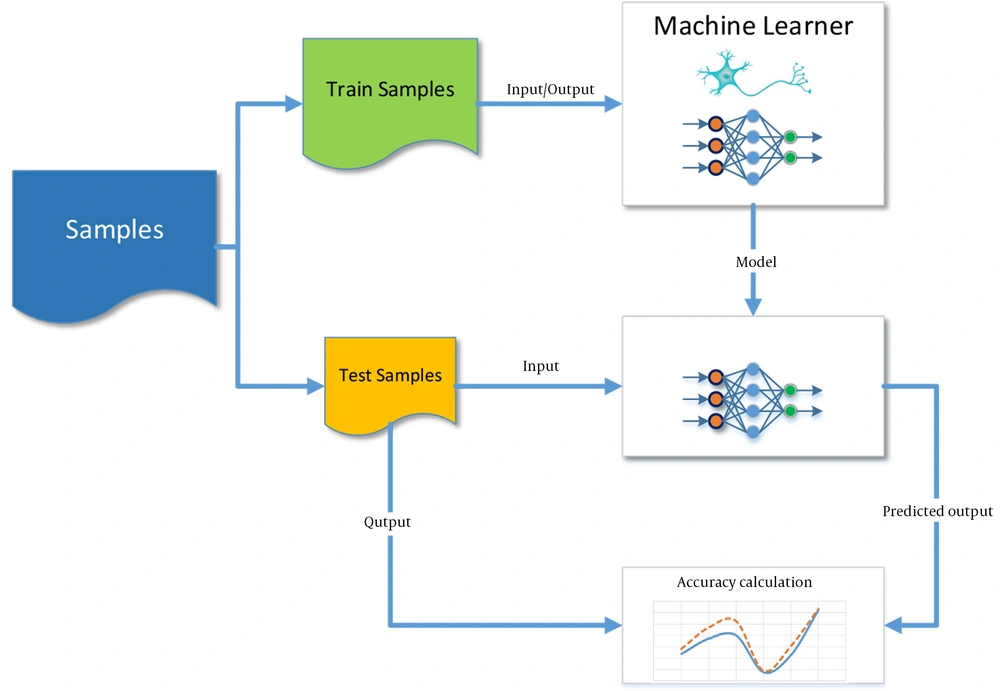
Figure 1.
Machine-learning flowchart for supervised learning
3.4. Validation
To examine the performance of a trained machine, a part of the data is to train the machine, and another part is to test its performance or so-called accuracy calculation. Nevertheless, the part of the data that is for training is highly important because the machine might be well-trained with some parts of the data and not by some other parts. To solve this problem, this study used the k-fold method, in which the data are divided into k sections. At each step, k-1 parts of the data are for training, and one part is to test the machine’s performance. Accordingly, the number of steps to check the accuracy of the performance is equal to k. Figure 2 shows the sections used for training and testing with k = 4. This method’s final accuracy equals the average accuracy calculated at all steps.
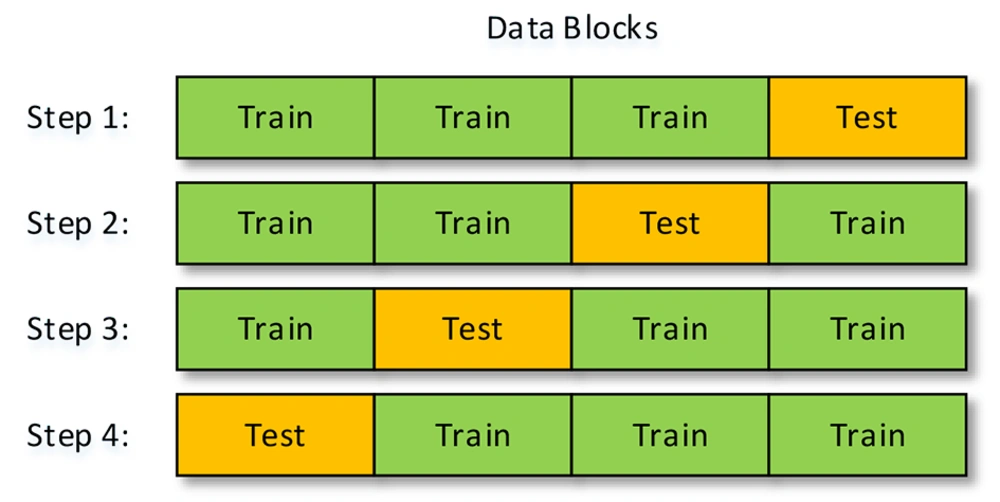
Figure 2.
K-fold steps with k = 4
4. Results
In this study, 20 features were extracted from each cancer dataset, using the feature extraction method. Tables 1 and 2 show the results of the absolute logarithmic values of the extracted genes for CRC and breast cancer, respectively. Tables 3 and 4 show a list of the genes introduced in previous CRC and breast cancer studies, respectively.
Table 1.
Absolute Logarithmic Ratio in Colorectal Cancer Samples for Genes Selected in This Study
| Gene Symbol | Normal Average | Tumor Average | Absolute Logarithmic Ratio |
|---|---|---|---|
| FOXQ1 | 2.223910908 | 6.897400898 | 0.491568084 |
| SFRP1 | 7.791344622 | 2.937684327 | 0.423607288 |
| PLP1 | 6.502352959 | 2.52659399 | 0.410535081 |
| ABCG2 | 8.859031714 | 3.351576673 | 0.422137097 |
| COL11A1 | 2.197618612 | 6.152669908 | 0.447111291 |
| AQP8 | 10.45230679 | 3.832825541 | 0.435693096 |
| CEACAM7 | 8.566520765 | 3.396245367 | 0.401805413 |
| CA1 | 10.78996539 | 3.816095082 | 0.451400865 |
| CA1 | 12.30637631 | 4.583258724 | 0.428955817 |
| CLDN8 | 6.599359908 | 2.4096035 | 0.437556229 |
| CD177 | 8.290931235 | 3.018891276 | 0.438755841 |
| GUCA2B | 10.2922992 | 3.742539765 | 0.439345979 |
| CA7 | 7.444865847 | 2.79510298 | 0.425459063 |
| BMP3 | 5.524542541 | 2.158379102 | 0.408168595 |
| TMIGD1 | 10.06301872 | 3.132877398 | 0.506784881 |
| SLC4A4 | 7.336944143 | 2.864589408 | 0.408452831 |
| MMP7 | 2.076586173 | 7.631830949 | 0.565278784 |
| KRT23 | 2.619680918 | 7.065921806 | 0.43092043 |
| ADH1B | 8.658761071 | 3.07382252 | 0.449776968 |
| OTOP2 | 7.890946133 | 2.733458888 | 0.460416532 |
Table 2.
Absolute Logarithmic Ratio in Breast Cancer Samples for Genes Selected in This Study
| Gene Symbol | Normal Average | Tumor Average | Absolute Logarithmic Ratio |
|---|---|---|---|
| CDH1 | 10.12790132 | 11.38846291 | 0.05095 |
| KRT19 | 8.771923697 | 10.43900939 | 0.07556 |
| LPL | 12.19861268 | 10.57707802 | 0.06194 |
| CFD | 12.98469738 | 11.51893758 | 0.05202 |
| ADIPOQ | 12.56529143 | 10.92177526 | 0.06088 |
| HBB | 12.1307117 | 10.26378344 | 0.07258 |
| AKR1C3 | 10.54135091 | 9.341985121 | 0.05246 |
| CD36 | 12.3276894 | 10.8627203 | 0.05494 |
| ADH1B | 12.4294803 | 10.89986437 | 0.05703 |
| GYG2 | 11.50944658 | 9.867195347 | 0.06686 |
| SORBS1 | 10.83684142 | 9.318539532 | 0.06555 |
| RBP4 | 11.31251754 | 9.626174305 | 0.07011 |
| PCOLCE2 | 10.3687605 | 9.14412402 | 0.05458 |
| CD24 | 9.35284475 | 11.19384905 | 0.07804 |
| ACACB | 11.51449992 | 10.21201579 | 0.05213 |
| CDH1 | 10.12790132 | 11.38846291 | 0.05095 |
Table 3.
Absolute Logarithmic Ratio in Colorectal Cancer Samples for Genes Introduced in Previous Studies
| Gene Symbol | Normal Average | Tumor Average | Absolute Logarithmic Ratio |
|---|---|---|---|
| RPRD1B | 6.340062038 | 7.162458816 | 0.052968630 |
| OGDHL | 3.160723867 | 3.047873622 | 0.015789601 |
| FGF2 | 3.554201888 | 2.781068847 | 0.106530353 |
| TET3 | 6.395727755 | 6.383841133 | 0.000807898 |
| MSH3 | 3.803539776 | 4.019127286 | 0.023943798 |
| WNT16 | 1.999506153 | 1.973441102 | 0.005698576 |
| CYP24A1 | 2.918686673 | 2.944265898 | 0.003789554 |
| WNT1 | 2.182406765 | 2.191098184 | 0.001726140 |
| CLDN16 | 2.279791786 | 2.307774643 | 0.005298213 |
| POFUT1 | 3.736163612 | 4.471701408 | 0.078046910 |
| KLF5 | 10.77017785 | 10.42091324 | 0.014317094 |
| NOD2 | 2.392484296 | 2.436204337 | 0.007864616 |
| EIF6 | 6.735043245 | 7.590437622 | 0.051926427 |
| PTEN | 7.299340194 | 6.935050888 | 0.022233953 |
| MGP | 4.293408755 | 3.166209949 | 0.132262528 |
| TP53 | 2.683255867 | 2.683807286 | 0.000089239 |
Table 4.
Absolute Logarithmic Ratio in Breast Cancer Samples for Genes Introduced in Previous Studies
| Gene Symbol | Normal Average | Tumor Average | Absolute Logarithmic Ratio |
|---|---|---|---|
| HDAC1 | 10.56569313 | 10.79593658 | 0.00936 |
| BAG1 | 11.2298917 | 11.18956404 | 0.00156 |
| MED1 | 9.485055809 | 9.657937687 | 0.00784 |
| CD82 | 11.2675989 | 11.28307914 | 0.00060 |
| MMP9 | 10.5577457 | 10.66589147 | 0.00443 |
| MMP1 | 8.939618655 | 9.223201462 | 0.01356 |
| MDM2 | 9.195558765 | 9.183370978 | 0.00058 |
| CYP1A1 | 11.07315899 | 11.02370657 | 0.00194 |
| SERPINA1 | 9.68937968 | 9.706017316 | 0.00075 |
| ATG4A | 10.94181449 | 10.96255842 | 0.00082 |
| EIF4EBP1 | 11.64878392 | 11.61895678 | 0.00111 |
| HDAC1 | 10.56569313 | 10.79593658 | 0.00936 |
| BAG1 | 11.2298917 | 11.18956404 | 0.00156 |
| MED1 | 9.485055809 | 9.657937687 | 0.00784 |
| CD82 | 11.2675989 | 11.28307914 | 0.00060 |
| MMP9 | 10.5577457 | 10.66589147 | 0.00443 |
As illustrated in Figures 3 to 6 and Tables 1 and 2, the gene expression levels for the genes obtained in this study show a significant difference, compared to the genes introduced in previous studies (as an indicator of breast cancer or colorectal cancer). This finding can indicate that the genes in this study are linked to colorectal and breast cancers more closely or they might be an underlying cause or a complication of the disease. This is discussed in more detail in the Discussions section. Table 5 shows that this algorithm detected CRC by more than 99%, using both neural networks and SVM. Nevertheless, the aforementioned results are less accurate for breast cancer. This might be due to several reasons, including more diversity in the gene expressions of breast cancer. However, diagnosing breast cancer using SVM is still more acceptable than using neural networks. In this study, the false positives are of great importance because a method to identify the susceptible cases was sought as much as possible. Accordingly, reducing the false positives indicates a decrease in the error rate of the current proposed approach. Any algorithm and its optimizations might have an error rate. A combination of different algorithms with different error rates would lead to the cross-product of their error rates, which would logically lead to a lower error rate. Using the k-fold technique helped reduce this rate to the lowest rate possible in the current proposed approach.
Table 5.
Algorithm Accuracy in Classification of Individuals with Tumors and Healthy Individuals Using Neural Network and Support Vector Machine
| Neural Network, % | Support Vector Machine, % | |
|---|---|---|
| Breast cancer | 85.385 | 98.077 |
| Colorectal cancer | 99.675 | 99.806 |
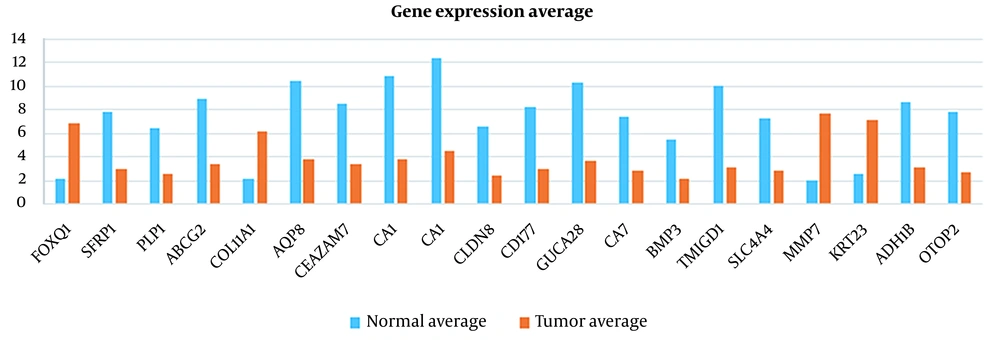
Figure 3.
Gene expression average in normal and tumor colorectal cancer samples for genes selected in this study
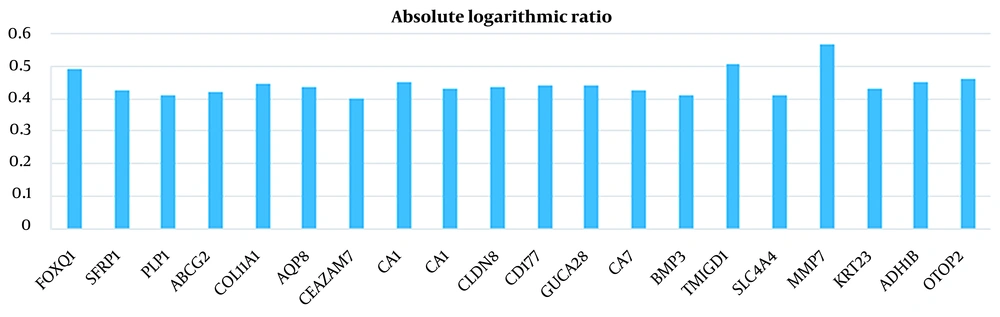
Figure 4.
Absolute logarithmic ratio of colorectal cancer samples for genes selected in this study
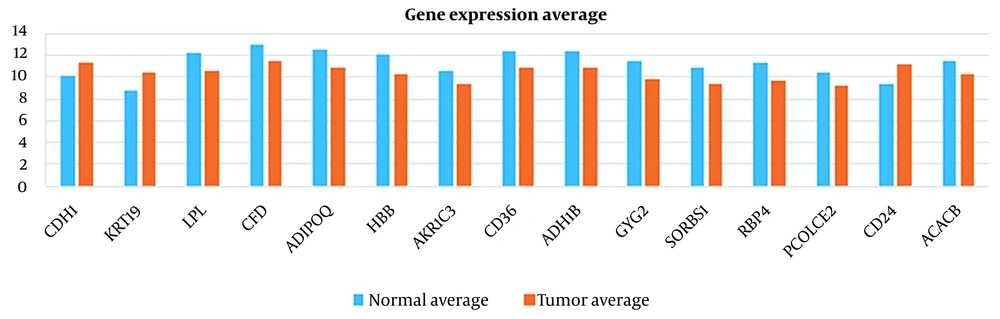
Figure 5.
Gene expression average in normal and tumor breast cancer samples for genes selected in this study
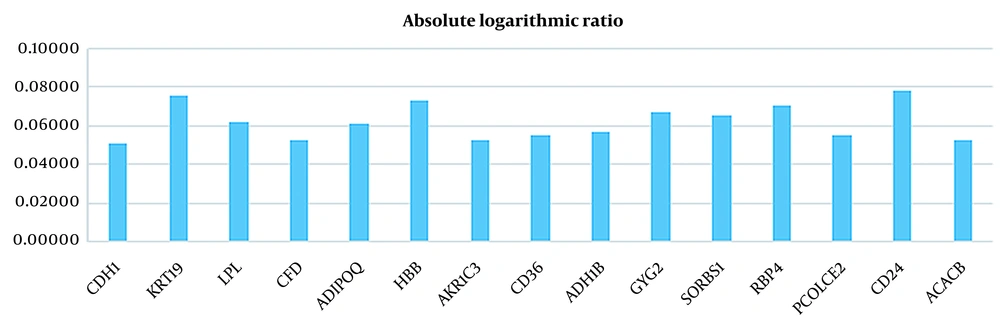
Figure 6.
Absolute logarithmic ratio of breast cancer samples for genes selected in this study
5. Discussion
This study presented a novel approach to classify breast cancer and CRC cases. Moreover, to ensure that the training process is proper and efficient, the k-fold method was followed. This study used the gene expression datasets for breast cancer and CRC (namely breast cancer GSE15852 and CRC GSE44076) obtained from the NCBI database. The datasets included gene expressions from 43 healthy and 43 tumor samples for breast cancer and 148 healthy and 98 tumor samples for CRC, respectively. The findings indicated that the proposed SVM-based approach, in conjunction with the k-fold method, performs much better than neural networks, with accuracy values of 98.077% and 99.806% for breast cancer and CRC, respectively. This result is highly impressive, compared to the results of similar studies, and is due to the way the extraction of the features (33, 34, 41, 42).
For instance, de Ronde et al.’s (33) study aimed at evaluating the performance of subtype-specific and non-specific predictors. They studied several approaches and compared their performance including SVM. A deeper look into the findings showed that for subtype predictors based on gene expression data, the accuracy values of the results were 76.22% and 75.59% for the SVM-Wilcoxon-Mann-Whitney (SVM+WMW) and the SVM-Wilcoxon-Mann-Whitney with uncorrelated features (SVM+WMW uncor.), respectively. This finding shows that our proposed approach performed much better regarding the classification of breast cancer. Furthermore, the most outstanding result reported by Smolander et al. (34) was the utilization of the backpropagation algorithm in conjunction with SVM, resulting in an accuracy of 90.16% for breast cancer in comparison to which the present study revealed a much better performance and accuracy of 98.077%. The reason for such a difference in the accuracy of their study with the present paper is that they selected the features with the highest variance to perform the classification task. Relying on the features with high variance indicates that there is more variation on the data values that may increase the error rate. To overcome this issue, the authors have used back propagation algorithm to handle such variations and reduce the error rate. However, the accuracy remained lower that the one achieved by our study. The same is true for other similar studies by Chiu et al. (41) and Xu et al. (42).
Many other studies have adopted several approaches to classify breast cancer cases, using different methods from supervised binary classification to unsupervised deep learning methods.
Egwom et al. (43) used SVM along with linear discriminant analysis (LDA). LDA is a technique for dimensionality reduction. The concept of dimensionality reduction may intuitively have similarities with feature selection, but the two techniques are different.
Feature selection and dimensionality reduction are often grouped. While both methods are used for reducing the number of features in a dataset, there is an important difference.
Feature selection is simply selecting and excluding given features without changing them. Dimensionality reduction transforms features into a lower dimension.
The dataset used in this paper is different from what we did. This difference can be examined from several aspects. One is related to the type of data used. In the mentioned article, the Wisconsin Breast Cancer dataset (WBCD) contains information and characteristics of the tumor, which has 569 records. The next dataset is the Wisconsin Prognostic Breast Cancer dataset (WPBC), which has 198 records and contains breast cancer tumor characteristics and information. One of the main characteristics and the fundamental difference between our study and the mentioned article is that our dataset is fundamentally different in terms of content and we are dealing with gene expression. On the other hand, our data contains a wide range of genes identified in patient samples, and this causes the number of features we deal with to be much higher than the number of features in the above datasets. The accuracy of their proposed algorithm was 99.2% and 79.5% for WBCD and WPBC datasets, respectively. This variation of accuracy lies under two reasons first variation of features for these two datasets and second large variance of values for each dataset. Although their results cannot be compared to ours because of the reasons above, this result also emphasized that SVM is the proper tool for binary classification, and combining it with proper feature selection or dimensionality reduction can improve its performance (43).
In a similar study by Naji et al. (44), the dataset used in it is different from what we did. This difference can be examined from several aspects. One is related to the type of data used. In the mentioned article, WBCD is used (same as the study by Egwom et al. (43)).
However, the accuracy we obtained is very similar to the accuracy reported in this paper. On the other hand, similar to our findings, in this article, it has been concluded that the performance of SVM is better for binary classifications.
The paper by Aljuaid et al. has achieved acceptable results such that a very interesting accuracy of 99.7% has been achieved for the ResNet classifier for the classification of clinical images related to breast cancer using the deep learning method. This approach is different from the supervised learning approach we were looking for, and therefore no concrete comparison can be made in this regard (45).
The data source used in the study by Arooj et al. is ultrasound images and histopathology images, and the CNN-AlexNet model is also used, which is a combination of deep learning. The accuracy of this model has varied between 96.07 and 100% depending on the different datasets used (46).
The most similar research to our work so far is the work by Wu and Hicks The tool they used was R. In their study, SVM achieved the highest accuracy. But, since our model has been used for both breast cancer and CRC classification, the accuracy of our model has decreased for breast cancer classification (47). However, it is still very acceptable.
Therefore, utilizing a proper feature selection method presents much better results in SVM-based approaches for either machine learning or deep learning (34, 48). This study adopted an approach to be used for machine learning feature selection, in which the gene expression levels have changed the most. The average gene expressions have provided us with proper features and led us to identify some implicit information regarding the potential variations in gene expressions for the infected and healthy individuals.
In other words, these genes might not necessarily indicate the direct cause of infection by the disease; however, these genes show a potential to suspect the infected cases. These genes might not be the ones triggering the cancer incident; nevertheless, cancer-prone cases might affect these genes. They might also indicate adverse reactions to, for example, drug use and therapy.
It is noteworthy that the above-mentioned results for the set of selected features can be the cause/effect of the disease.
For instance, the current study has selected SFRP1 (Table 1), a suppressor gene located in a chromosomal region frequently deleted in breast cancer (49). Another study revealed that SFRP1 gene methylation in CRC was associated with lymph node invasion (50). On the other hand, PTEN has been widely studied as an indicator of CRC (18). A deeper look at the Tables 1 and 2 shows that relying on the set of genes that have already been identified as tumor markers (i.e. PTEN in Table 3) may mislead us based on our dataset. Because they might not show a significant difference between healthy and tumor cases, leading to inaccurate classification.
The same can be concluded for breast cancer. For instance, MMP9 has been studied as the risk factor for breast cancer (17). However, according to Table 4, the expression of this gene in our dataset could not differentiate the healthy and tumor case because of the close normal average and tumor average. Instead, ADIPOQ has been identified as one of the proper features in our dataset. ADIPOQ does not trigger breast cancer but it is shown that it increases the efficacy of chemotherapeutic agents. Notably, high expression of ADIPOQ receptor ADIPOR2, ADIPOQ/adiponectin, and BECN1 significantly correlate with increased overall survival in chemotherapy-treated breast cancer patients (51). This is shown in Figures 7 - 10 visually.
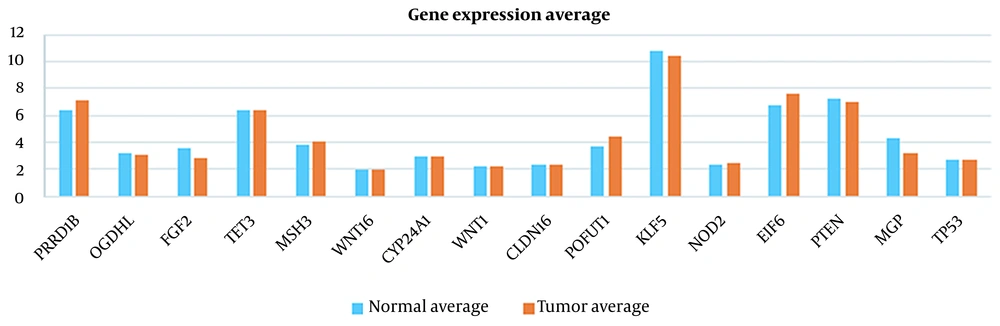
Figure 7.
Gene expression average in normal and tumor colorectal cancer samples for genes introduced in previous studies
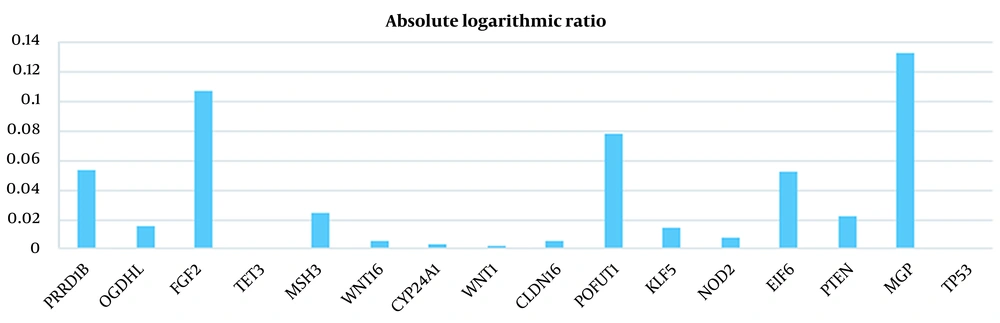
Figure 8.
Absolute logarithmic ratio of colorectal cancer samples for genes introduced in previous studies
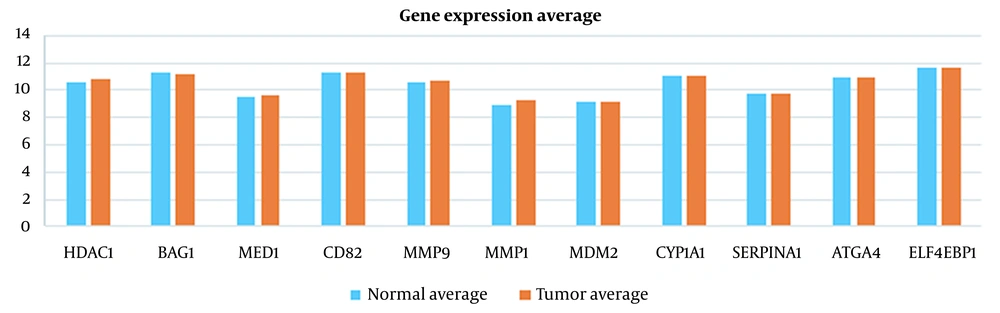
Figure 9.
Gene expression average in normal and tumor breast cancer samples for genes introduced in previous studies
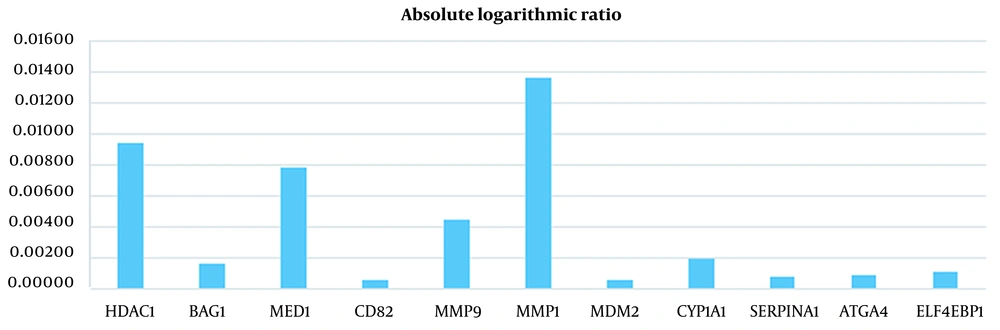
Figure 10.
Absolute logarithmic ratio of breast cancer samples for genes introduced in previous studies
Accordingly, it can be concluded that the expression of some genes, such as MSH3 (for breast cancer) and SFRP1 (for CRC) has effects on the disease progression; however, some others detected in the present study might not be known yet, or they might not be studied extensively to have any direct impact on the concerned diseases, yet. As previously mentioned, such effects can be studied further as causes and effects.
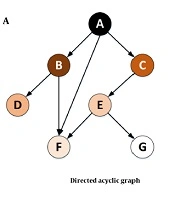
A directed acyclic graph (DAG) or directed cyclic graph (DCG) can visualize such effects. The DAGs are used to model a priori causal assumptions (52). In some cases, the relationships might be mutual (i.e., any change in the expression of a certain gene might cause the loss or overexpression of another gene). The cyclic relationship might occur either directly or indirectly (Figure 11). In future studies, visualizing such relationships among the genes in this study can reveal valuable implicit information. Furthermore, the graphs lead us to a better understanding of the chain of transformations or any other disease and might help manage the disease by cutting these transformation chains.
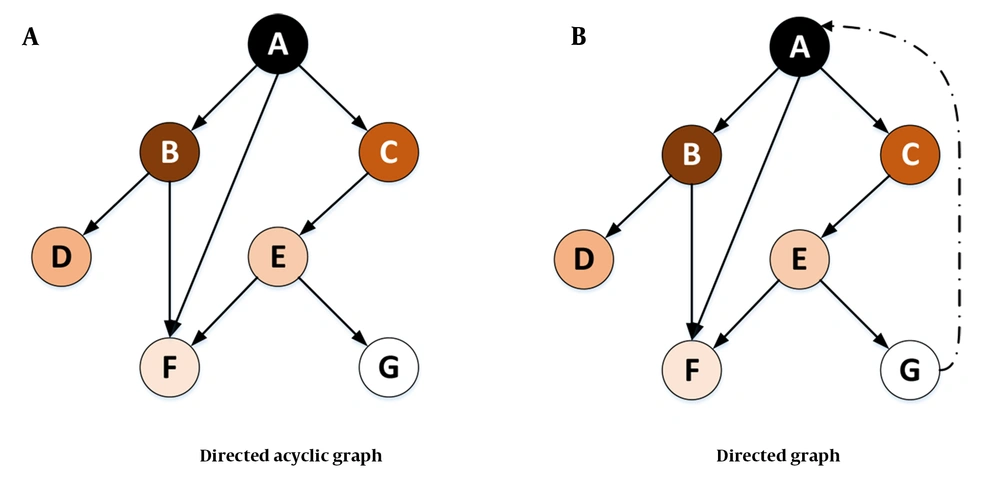
Figure 11.
Two types of directed causal graphs: acyclic (A) and cyclic (B) models
In Figure 11A, it is assumed that a change in the expression level or the mutation of gene A (in terms of loss or overexpression) affects the expression or mutation of genes B, C, and F. Gene C itself affects gene E, which affects genes F and G. In this case, all the relationships form a tree (or an acyclic graph). However, in Figure 11B, any change in the expression or mutation of gene G might affect gene A. Visualizing such a relationship would lead to a DCG.
The graphs in Figure 11 can also be considered weighted graphs. In this model, the weight of the edges of the graph indicates the probability of the effect of a change in the level of gene expression or the mutation of one gene on the gene expression or mutation of other genes. Figure 12 shows an example of this type of weighted graph. This graph is a Markov chain because it has the Markov property (i.e., being memoryless because the conditions at the time [step] t+1 only depend on the inputs and conditions at the time [step] t). Equation 9 shows the formal definition of this property, where X is a discrete random variable.
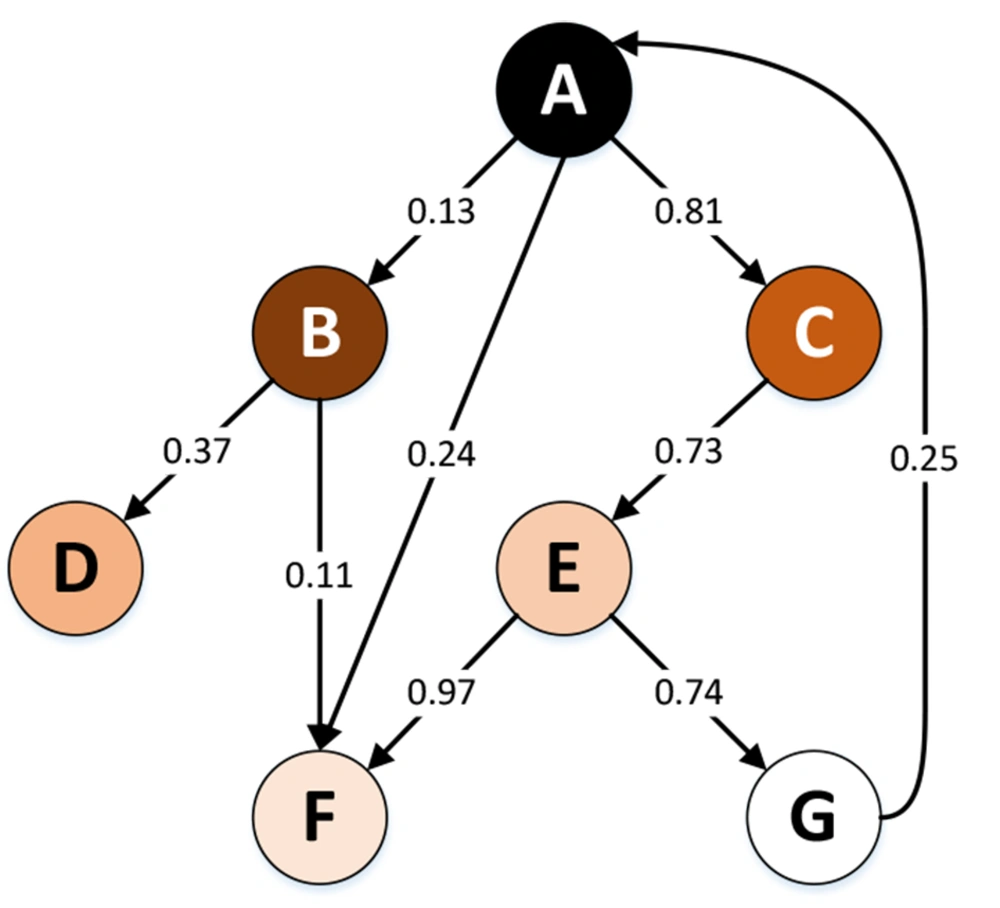
Figure 12.
Directed weighted causal graphs
Considering the Markov chain as a causal model, the capabilities of the Markov chain (e.g., the steady state) can be used to investigate some issues in the medical field. One can consider pharmaceutical products and medical care (e.g., surgery) inputs in this causal system. Accordingly, using the steady state, it is possible to predict which direction the patient’s condition would eventually go by the use of special medicines and care (i.e., recovery, further complications, or death).
Our proposed approach gave us a set of genes that are not necessarily the main causes of the disease; however, they may be the side effects of the disease. In other words, the changes in the expression of the genes responsible for breast cancer and CRC have led to a change in the expression level of a set of genes in different patients, which indicates the occurrence of complications caused by the disease or other changes and developments in such patients. Since these affected genes were more apparent in the dataset, the proposed model of this study obtained better results.
Another advantage of this approach is that it identifies a diverse range of potential gene expressions affected by the diseases, which is the superior capability of SVM. Not all the identified gene expressions in this paper (as features) trigger the disease itself; however, the study of their effects on the disease and the study of their relationships might further lead to new observations and even new treatment approaches to control the disease and achieve more acceptable quality survivals and prognosis. In other words, in addition to identifying susceptible cases, the cause and effect of gene expressions in breast and CRC might be pursued, which might lead to further health status complications for each individual. Drawing the derivation tree of such a cause/effect relationship can reveal more implicit information. Such information can be helpful in the domain of precision medicine. To gain better in-depth insights, such relationships might be studied through network sciences (i.e., network medicine).
The clinical significance of this investigation is that machine learning algorithms could be used not only to improve diagnostic accuracy but also for identifying women at high risk of developing breast cancer and CRC, which could be prioritized for treatment (47). For supporting this idea, a study by Lux et al. it is shown that individuals with high genomic risk are among the substantial contributors to breast cancer treatment costs (53). It was studied that gene expression test was estimated to reduce costs versus standard care in Germany. Such cost-effectiveness seems to be true for both breast cancer and CRC (53, 54). However, it can be further studied and proved that utilizing computer-aided tools such as our proposed classifiers can reduce healthcare costs.
From a prognostic perspective, it is also shown that gene expression profiles for invasive early breast cancer have presented excellent prognostic capacities. This means that the gene expression profiles help for early diagnosis of the disease (55). Moreover, using machine learning-enabled tools such as the one provided in our study can reduce the need for clinical expertise to interpret the result and better and more accurately decide on a proper treatment plan.
One of the limitations of this study was the data size since two datasets consisting of 71 669 gene expressions were used. However, the authors devoted efforts to overcome such a limitation as much as possible, using the k-fold method.
5.1. Conclusions
The obtained findings revealed that in addition to achieving higher classification accuracy, the cause-effect relationships as synthesis structures could be used to build Markov models in the clinical domain to analyze treatment paths and predict patient outcomes. According to this study, the cause-effect relationships are formed by gene expression data not necessarily depending on the genes triggering the disease but on genes indirectly affected by the disease. These sets of genes were obtained, using the proposed feature extraction method. The combination of such relationships with a probabilistic approach illuminates some implicit paths to find the best treatment options (i.e., best treatment paths), using graphic Markov models. Considering the gene expression data as the finite states of the Markov model provides a space, where any transitions of the states can help toward relevant predictions.