1. Background
Gastrointestinal cancers (GIC) is one of the most common cancers worldwide. The mortality and morbidity caused by GIC are rising throughout the world and Asia (1). This type of cancer is one of the most dangerous and prevalent ones in Iran, causing about half of the deaths from cancers (2). The GIC causes many physical, social, and psychological problems for patients. Moreover, GIC causes many problems for the patients and their families, including the costs and economic issues (3).
Unfortunately, treatments are not effective on GICs diagnosed at advanced stage (4). According to various studies, some factors, including the grade of the tumor, metastasis to other organs, age, and gender, were identified as effective for GIC (5).
In recent decades, the research on the effect of socio-economic status (SES) inequalities on health has attracted increasing attention. According to various studies, the greatest burden of diseases and a large part of the health inequalities in the world are caused by social factors. The effect of some social determinants of health (SDH) on millennium development goals 1 and 2 was also considered (6). Determiners such as income inequity, employment, occupation, housing, education, nutrition, stress, and violence affect both the ability of people to develop diseases as well as their potential recovery from the disease (7). Surveys of the SDH in different parts of the world show the essential role of SES in the distribution of these diseases as well as their risk factors among socio-economic groups (8). In fact, such diseases have a particular social distribution pattern in various societies. In different societies, structural conditions (social and background factors) are responsible for various health problems. The findings of the studies indicate that SDH have an impact on a wide range of health outcomes (cancers, cardiovascular diseases, and diabetes). In addition, the observed difference in the mortality rate of cancer is affected by social variables (9). The role of SES has also been proven in cancer survival. Reducing inequalities is an increasingly important focus of cancer control efforts, alongside improving survival overall. The role of SES and regional inequalities in survival from some types of GIC, such as colon and rectum cancer, have been observed in different studies (10-12). In addition, results showed that GIC was more prevalent in rural areas compared with urban ones, which can be due to low SES in the rural areas (13). Moreover, low SES is an important predictor of GIC survival and is directly related to it (14). Lower SES is generally associated with diagnosis at a later stage, and in some settings, poorer standards of care, less favorable health behaviors, and/or greater co-morbidity (15, 16).
Low SES can affect the diagnosis of cancer, which leads to diagnosis at the advanced stage and higher grade of cancer. A timely diagnosis that is related to the SES leads to diagnosis at a lower level and consequently prevents exaggeration, recurrence, and metastasis (17). Therefore, it is important to explain the role of the SES inequality in stage, grade, recurrence, and metastasis of the disease.
Nowadays, the C index is widely used in measuring health inequalities (18-20). This index indicates the inequality in health or the use of health services in a single number. The greater value of the C index, the higher degree of inequality (21). Moreover, this index is capable of decomposition, which means that the contribution level of various socio-economic variables can be obtained according to the level of inequality index. Therefore, variables that have the largest contribution in inequality are identified and can be prioritized in policymaking. The purpose of these studies is to identify the gaps and differences among diverse socioeconomic groups in achieving health services required for patients with cancer, so as to identify the causes of the differences and inequities, which ultimately, leads to a reduction in inequity in health services (22).
Self rated health (SRH) is an effective and popular way to define individual health. This method is widely used for its simplicity (23). Regarding the relationship between SRH and SES, individuals with low SES have a poor SRH (24). SRH can encourage individuals to follow a therapy or perform diagnostic and screening procedures (25). Therefore, it has an important role in preventing diseases and their deterioration (26).
Access to healthcare and screening is one of the important issues that have a positive effect on cancer prognosis and reduces metastasis and recurrence, which can be related to SES inequality. In addition, the grade and stage of cancer, as well as the SRH are among factors that affect the progress of the disease. Up to now, no study has been performed to identify the role of SES inequalities in recurrence, metastasis, grade, and stage of disease, and SRH in of GIC.
2. Objectives
In this study, we evaluated the role of SES inequality in the recurrence and metastasis of GIC, regarding a C index approach in Arak, Iran.
3. Methods
3.1. Sampling
This cohort study was conducted on 409 patients suffering from GIC (April to October, 2018), who were referred to one of the hospitals of Arak University of Medical Sciences (Arak, Iran). They were entered to the study, using non-random sampling (accessible sampling). The protocol of the study was approved by the Ethics Committee of Shahid Beheshti University of Medical Sciences under grant number IR.SBMU.RETECH.REC.1396.839.
3.2. Data Collection
The required data were collected, using 3 questionnaires. (1) The personal, demographic, and disease information including age, gender, marital status, education, occupation, insurance, supplementary insurance, history of GIC in first degree relatives, history of chemotherapy, radiotherapy, and surgery, stage and grade of disease, recurrence, and metastasis. (2) SES questionnaire: Since the economic and social situation has widespread dimensions, there is no precise method for measuring it. Therefore, other alternatives are used (27), including house ownership, the number of rooms in the house, refrigerator, Television, mobile phone, washing machine, dishwasher, microwave oven, vacuum cleaner, computer, car, tablet, Internet access, air conditioner, water cooler, and radiator. The correlation of these factors with the total score and validity was 0.87 and 0.88, respectively (28). (3) SRH questionnaire: SRH was examined by two questions: (A) “In general, what would you say about your health?” The answers were measured by a 5-point Likert type scale, ranging from excellent (score 1) to poor (score 5). (B) “How would you assess your general health status in comparison with your own age?” The answers were classified as much worse, worse, slightly worse, not better not worse, a little better, better, and much better. However, as coefficients of alternatives were close to each other in the regression analysis, SRH was divided into two groups of poor (quite poor, poor, middle) and good (good, excellent). SRH-age was also divided into two groups of poor (much worse, worse, slightly worse, not better not worse) and good (a little better, better, much better). This questionnaire was used by other studies, too (29, 30).
3.3. Analysis
In our study, the varimax rotated principal components analysis was used to calculate the SES. The principle component analysis (PCA) is a multivariate statistical technique for reducing a set of variables that are possibly correlated to a few non-interrelated variables called principle components. The first component, resulting from the analysis, explains the most variance among the variables in question and it is considered an index for the economic situation of each household. In fact, this component provides a score for each household, which reflects the household's economic situation and can be used in the analyses (31, 32).
In this study, the C index method was used for measuring inequality. The C index is a variable between -1 and +1. The negative values indicate that the variables (including metastasis, recurrence, grade, stage, SRH, and SRH-age) are concentrated on individuals with poor SES, but positive values indicate that these variables are concentrated among those with good SES. When the distribution of these variables is the same for all individuals, the C index will be zero (33, 34). The C index is a common inequity measure in health outcomes and it has been used continually in recent studies (33, 35, 36). It was calculated, using a formula proposed by Kakwani Nanak et al. (33).
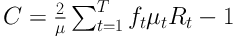
In this formula, µ is the mean of the SRH in studied patients, who were affected by cancer, and µt is the same value for the tth group. In addition, ft is the group share of patients. Rt is also the relative rank of the tth educational level of the participating patients, which was obtained through following formula:
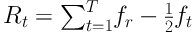
Therefore, Rt indicates the cumulative proportion up to the midpoint of each SES group interval. The corresponding confidence interval for C is calculated based on Wagstaff and Van Doorslaer method (20, 33, 37). This method has been used in other studies, too (20, 33, 37-40), and it is defined as follows:

In this formula, σt2 is the variance of µt,
The binary logistic regression was used to investigate the association of recurrence and metastasis with other variables in the study. This method calculates the value of odds ratio (OR) for each variable while removing the effect of other ones. Moreover, the variance analysis and the significance level of 95% were used to investigate the relationship between SES and other variables. All statistical analyses were performed, using Stata (V. 13) software.
4. Results
Using the binary logistic regression, the association of crude and adjusted OR and their confidence interval of recurrence with other variables was investigated, and the results were shown in Table 1. Based on these results, the OR estimate of recurrence was 0.86 (95% CI: 0.84, 0.89) among patients with supplementary insurance, compared to those who lacked the supplementary insurance. Compared to patients with poor SRH-age, the OR estimate of recurrence was 3.63 (95% CI: 1.56, 8.48) among those with good SRH-age. Compared to patients affected by stage one of GIC, the OR estimate of recurrence was 9.86 (95% CI: 1.00, 98.92) among those suffering from stage 4. The OR estimate of recurrence was 7.05 (95% CI: 1.99, 24.93) among patients with grade 3 compared to those with grade 1.
Table 1.The Association of Crude and Adjusted OR of Recurrence with Other Variables
| Subgroups | Crude, OR (95% CI) | Adjusted, OR (95% CI)a |
|---|---|---|
| Age | ||
| < 40 | Reference | Reference |
| 40 - 60 | 3.53 (0.44, 28.30) | 4.27 (0.50, 36.36) |
| > 60 | 5.42 (0.67, 43.36) | 6.28 (0.67, 58.84) |
| Gender | ||
| Female | Reference | Reference |
| Male | 2.62 (1.21, 5.69) | 2.72 (0.94, 7.84) |
| Marital status | ||
| Single | Reference | Reference |
| Married | 1.98 (0.23, 16.44) | 1.44 (0.16, 12.50) |
| Widow/divorced | 0.53 (0.04, 6.65) | 0.46 (0.03, 6.23) |
| Education | ||
| Illiterate | Reference | Reference |
| Primary | 0.68 (0.27, 1.71) | 0.79 (0.28, 2.19) |
| Diploma | 1.01 (0.36, 2.79) | 1.17 (0.35, 3.85) |
| Academic | 0.76 (0.21, 2.65) | 1.84 (0.54, 8.41) |
| Job | ||
| Housewife | Reference | Reference |
| Retired | 1.49 (0.53, 4.17) | 0.57 (0.13, 2.44) |
| Unemployment | 3.26 (0.86, 12.32) | 1.23 (0.24, 6.28) |
| Permanent/temporary | 1.29 (0.49, 3.37) | 0.53 (0.13, 2.10) |
| Insurance | ||
| No | Reference | Reference |
| Yes | 0.19 (0.02, 1.46) | 0.09 (0.007, 1.30) |
| Supplementary insurance | ||
| No | Reference | Reference |
| Yes | 0.84 (0.28, 0.99) | 0.86 (0.84, 0.89) |
| SRH | ||
| Poor | Reference | Reference |
| Good | 2.41 (0.86, 6.31) | 2.57 (0.91, 5.79) |
| SRH-age | ||
| Poor | Reference | Reference |
| Good | 3.53 (1.59, 7.82) | 3.63 (1.56, 8.48) |
| History of BC in first-degree relatives | ||
| No | Reference | Reference |
| Yes | 1.43 (0.68, 3.00) | 1.66 (0.75, 3.67) |
| Chemotherapy | ||
| No | Reference | Reference |
| Yes | 2.54 (0.93, 6.93) | 2.28 (0.80, 6.52) |
| Radiotherapy | ||
| No | Reference | Reference |
| Yes | 1.39 (0.65, 2.95) | 1.67 (0.74, 3.75) |
| Surgery | ||
| No | Reference | Reference |
| Yes | 0.55 (0.23, 1.31) | 0.88 (0.33, 2.29) |
| Stage | ||
| One | Reference | Reference |
| Two | 0.29 (0.02, 3.58) | 0.23 (0.01, 3.16) |
| Three | 1.17 (0.13, 10.20) | 1.04 (0.11, 9.82) |
| Four | 12.0 (1.32, 108.67) | 9.86 (1.00, 98.92) |
| Grade | ||
| One | Reference | Reference |
| Two | 2.43 (0.73, 8.03) | 2.23 (0.65, 7.68) |
| Three | 8.53 (2.56, 28.48) | 7.05 (1.99, 24.93) |
a Adjusted for age, marital status, education level, and job.
Using the binary logistic regression, the association of crude and adjusted OR and their confidence interval of metastasis with other variables was investigated, and the results were shown in Table 2. Based on these results, the OR estimate of metastasis was 3.25 (95% CI: 1.05, 10.08) in patients over 60 years old, compared to those under 40 years old. The OR estimate of metastasis was 4.03 (95% CI: 1.96, 8.28) in male patients compared to female ones. Compared to the illiterate level of education, the OR estimate of metastasis was 3.39 (95% CI: 1.22, 9.43) in academic level. Compared with patients who lacked insurance, the OR estimate of metastasis was 0.15 (95% CI: 0.02, 0.93) among those with insurance. Compared to patients with poor SRH, the OR estimate of metastasis was 0.35 (95% CI: 0.10, 0.99) among those with good SRH. In comparison with patients without surgery, the OR estimate of metastasis was 0.43 (95% CI: 0.23, 0.82) in those with surgery. Compared to patients affected by stage 1 of GIC, the OR estimate of metastasis was 3.17 (95% CI: 2.01, 7.43) among those with stage 3, and was 5.25 (95% CI: 4.81, 16.34) among those who suffered from stage 4. The OR estimate of metastasis was 4.64 (95% CI: 2.06, 10.46) among patients with grade 2, and was 9.76 (95% CI: 3.92, 24.30) among those with grade 3, compared to those affected by grade 1.
Table 2.The Association of Crude and Adjusted OR of Metastasis with Other Variables
| Subgroups | Crude, OR (95% CI) | Adjusted, OR (95% CI)a |
|---|---|---|
| Age | ||
| < 40 | Reference | Reference |
| 40 - 60 | 1.22 (0.48, 3.09) | 1.73 (0.62, 4.83) |
| > 60 | 2.36 (0.93, 5.99) | 3.25 (1.05, 10.08) |
| Gender | ||
| Female | Reference | Reference |
| Male | 3.80 (2.23, 6.49) | 4.03 (1.96, 8.28) |
| Marital status | ||
| Single | Reference | Reference |
| Married | 0.69 (0.23, 2.06) | 0.42 (0.12, 1.38) |
| Widow/divorced | 0.47 (0.13, 1.67) | 0.39 (0.09, 1.61) |
| Education | ||
| Illiterate | Reference | Reference |
| Primary | 1.29 (0.69, 2.42) | 1.61 (0.79, 3.30) |
| Diploma | 0.92 (0.43, 1.99) | 1.16 (0.47, 2.85) |
| Academic | 1.42 (0.64, 3.17) | 3.39 (1.22, 9.43) |
| Job | ||
| Housewife | Reference | Reference |
| Retired | 1.84 (0.92, 3.68) | 0.41 (0.15, 1.14) |
| Unemployment | 4.95 (1.85, 13.20) | 1.46 (0.45, 4.77) |
| Permanent/temporary | 1.64 (0.86, 3.13) | 0.50 (0.20, 1.24) |
| Insurance | ||
| No | Reference | Reference |
| Yes | 0.36 (0.08, 1.68) | 0.15 (0.02, 0.93) |
| Supplementary insurance | ||
| No | Reference | Reference |
| Yes | 1.49 (0.91, 2.45) | 1.27 (0.69, 2.30) |
| SRH | ||
| Poor | Reference | Reference |
| Good | 0.31 (0.10, 0.93) | 0.35 (0.10, 0.99) |
| SRH-age | ||
| Poor | Reference | Reference |
| Good | 0.34 (0.02, 1.93) | 0.38 (0.04, 1.74) |
| History of BC in first-degree relatives | ||
| No | Reference | Reference |
| Yes | 1.01 (0.62, 1.66) | 1.07 (0.62, 1.82) |
| Chemotherapy | ||
| No | Reference | Reference |
| Yes | 1.23 (0.69, 2.18) | 1.07 (0.57, 2.00) |
| Radiotherapy | ||
| No | Reference | Reference |
| Yes | 0.65 (0.38, 1.11) | 0.82 (0.46, 1.46) |
| Surgery | ||
| No | Reference | Reference |
| Yes | 0.28 (0.16, 0.51) | 0.43 (0.23, 0.82) |
| Stage | ||
| One | Reference | Reference |
| Two | 2.18 (0.81, 18.43) | 2.54 (0.99, 17.31) |
| Three | 3.01 (0.1.98, 8.54) | 3.17 (2.01, 7.43) |
| Four | 5.19 (4.65, 16.42) | 5.25 (4.81, 16.34) |
| Grade | ||
| One | Reference | Reference |
| Two | 4.17 (1.95, 8.89) | 4.64 (2.06, 10.46) |
| Three | 10.61 (4.54, 24.79) | 9.76 (3.92, 24.30) |
a Adjusted for age, marital status, education level, and job.
The relationship between SES and other variables are shown in Table 3. Results of analysis of variance showed the significant statistical relationship of SES with supplementary insurance, SRH-age, chemotherapy, and surgery (P < 0.05).
Table 3.The Relationship Between SES and Other Variables
| Subgroups | Mean ± SD | P Value |
|---|---|---|
| Insurance | 0.142 | |
| No | -0.37 ± 1.13 | |
| Yes | 0.05 ± 0.98 | |
| Supplementary insurance | < 0.001 | |
| No | -0.12 ± 0.93 | |
| Yes | 0.25 ± 0.99 | |
| SRH | 0.303 | |
| No | 0.02 ± 0.99 | |
| Yes | 0.18 ± 0.90 | |
| SRH-age | < 0.001 | |
| No | 0.31 ± 0.96 | |
| Yes | -0.17 ± 0.94 | |
| Chemotherapy | < 0.05 | |
| No | -0.111 ± 0.86 | |
| Yes | 0.119 ± 1.03 | |
| Radiotherapy | 0.595 | |
| No | 0.02 ± 1.00 | |
| Yes | 0.08 ± 0.94 | |
| Surgery | < 0.05 | |
| No | -0.19 ± 0.95 | |
| Yes | 0.10 ± 0.98 | |
| Grader | 0.121 | |
| One | 0.20 ± 0.90 | |
| Two | -0.04 ± 0.94 | |
| Three | 0.13 ± 1.13 | |
| Stage | 0.107 | |
| One | -0.18 ± 0.64 | |
| Two | 0.23 ± 1.01 | |
| Three | 0.11 ± 0.90 | |
| Four | -0.11 ± 1.03 | |
| Recurrence | 0.750 | |
| No | 0.05 ± 0.93 | |
| Yes | 0.11 ± 0.95 | |
| Metastasis | 0.224 | |
| No | 0.14 ± 0.91 | |
| Yes | -0.00 ± 1.05 |
Abbreviation: SRH, self rated health.
The C index was obtained as -0.0188 (-0.0392, 0.0016) and -0.0484 (-0.1352, 0.0383) for recurrence and metastasis, respectively. In addition, the C index for grade, stage, SRH, and SRH-age of GIC was obtained as -0.019 (-0.030, -0.0091), -0.010 (-0.021, 0.0004), 0.0055 (0.0001, 0.0109), and -0.044 (-0.0525, -0.0355), respectively. According to these results, there was no concentration of metastasis and grade regarding the SES levels (Table 4). However, there was concentration of higher stage and SRH-age in lower SES levels, and there was concentration of SRH in higher SES levels.
Table 4.Calculation of C Indexes and Their Equivalent 95% CI, for Metastasis, Recurrence, Stage, and Grade of BC Patients
| Outcomes | Concentration Index | 95% Confidence Intervals |
|---|---|---|
| Recurrence | -0.0188 | -0.0392, 0.0016 |
| Metastasis | -0.0484 | -0.1352, 0.0383 |
| Stage | -0.010 | -0.021, 0.0004 |
| Grade | -0.019 | -0.030, -0.0091 |
| SRH | 0.005 | 0.0001, 0.0109 |
| SRH-age | -0.044 | -0.0525, -0.0355 |
Abbreviation: SRH, self rated health.
5. Discussion
The main findings of our study included the effect of supplementary insurance, SRH-age, stage 4, and grade 3 on the recurrence of the GIC (P < 0.05). Also, there was an association between recurrence and age, gender, academic level of education, insurance, SRH, surgery, stage 3, stage 4, grade 2, and grade 3 (P < 0.05). The SES levels had an effect on supplementary insurance, SRH-age, chemotherapy, and surgery (P < 0.05). There was no concentration of metastasis, recurrence, and stage, while there was some concentration of grade, SRH, and SRH-age regarding the SES levels.
The findings of this study showed that there was no significant relationship between recurrence of GIC and age of patients. According to some studies, age is an important factor in the prognosis of a variety of cancers (41). The results of our study are similar to those of other investigations (42, 43). The relationship between gender and metastasis of GIC was observed in our study. In a study on single-variable analysis of information, gender had a significant relationship with deterioration and death due to GIC, and men were more likely to die from colon and rectal cancer compared with women. However, in a multivariate model, there was no significant relationship between gender and survival in both cancer cases (44). A study by Wei et al. also confirms this conclusion (45). Park et al. reported a significant relationship between gender and death due to rectal cancer. However, this relationship was not significant for colon cancer (46).
Supplementary insurance was proved to be a significant and protective factor for metastasis and recurrence of GIC. Supplementary insurance can be considered a factor in the prevention and treatment of disease. The effect of insurance on GIC was evaluated in various studies. In a study conducted by Shin et al., titled “Impact of Supplementary Private Health Insurance on Stomach Cancer Care in Korea”, they concluded that supplementary private health insurance had no effect on the treatment process and the patient's condition (47). In another study, it was shown that there was a statistically significant relationship between health insurance and the average quality of life in patients with GIC, such as colon cancer (48). Previous studies have shown that patients without health insurance have less access to health care and prevention services such as cancer screening and are more likely to be diagnosed with cancer at advanced stage (49). This can be a factor, which increases metastasis. People who have insurance, benefit from a better quality of life and are more satisfied with health services. The existence of supplementary insurance in Iran could play an effective role in increasing the patient's referral to the physician for care and treatment (50).
Extensive studies have identified a number of genes, each of which causes metastases in different tissues. According to the different conditions of each organ, these genes can explain the distribution of metastasis in different organs (51). In this study, the grade and stage of disease played a strong and significant role in the recurrence and metastasis of GIC. According to a previous study, the grade of the disease was an important factor in predicting the relative risk of metastasis (52). In a study by Elston and Ellis the grade of the tumor was reported as a significant factor, and it was shown that patients with grade 1 had a greater survival compared to those with grade 2 and 3 (53). Another issue that may be raised regarding the relationship of the grade of GIC with recurrence and metastasis is the size of the tumor. In some studies, the size of the tumor has been shown as a prognostic factor in the survival of patients (54).
According to the results of a previous study, there is a long-standing relationship between economic variables and the demand for supplementary treatment insurance. The findings of this study also showed that national income per capita and literacy rates have a positive and significant relationship with the demand for supplementary insurance (55). Emamian et al. evaluated the role of SES inequality in risk factors of non-communicable disease in Iran. Their results showed the concentration of these factors in the lowest SES. The most important factors that affect these inequalities included age, marital status, job, and living in rural areas (56).
SRH as an indicator on the international level may be considered as the best index of a person's health status. The results of this study showed that GIC patients with good SRH had more chance of recurrence and less chance of metastasis compared with those with poor SRH. Another kind of SRH was evaluated in this study, in which the health of GIC patients was evaluated in comparison with that of the same age group. The result of the variance and C index analysis of the association of both types of SRH with SES showed that patients with a good SES have a good SRH, too. The concentration of good SRH was also better on good SES. Although the relationship of SRH with recurrence and metastasis was not significant, the relationship between SRH and health has been proven in different studies. One of the things that can explain the role of SRH in recurrence and metastasis is the effect of age on SRH. Based on the results of a study, the increase in age is an effective factor in poor SRH. This finding is corroborated by the results of previous studies in Asia and Europe, which demonstrated that reducing the level of health is associated with age (57-59). SRH is also known as a predictor of death (60). Therefore, it can be concluded that by increasing the age, the SRH decreases. On the other hand, the relationship of age with recurrence and metastasis has been proven in our study. Therefore, by increasing the age, the amount and chance of recurrence and metastasis of SRH decreases.
According to the results of this study, the role of SES inequality was evident in factors related to GIC such as grade, SRH, and SRH-age. This was the first study to examine SES inequality in these factors. However, the role of SES inequality in health status has been addressed in other studies (61-63). One of the important factors affecting cancer is the economic situation. Individuals with high SES use more diagnostic and therapeutic tests and health services, which leads to the early detection of cancer (64). If the disease is diagnosed at the beginning stage, there will certainly be less recurrence and metastasis. Another study showed that income inequality is one of the most important factors affecting the health of individuals (65). Regarding SES inequality in SRH, it can be concluded that individuals measure their well-being in comparison to the average welfare of their community, and when they have less access to economic resources compared with others, they feel retarded. This issue affects people's attitudes, behaviors, and mental health. Psychosocial stresses and high-risk behaviors play an important role in the incidence of various diseases (66). Income inequality is associated with inequality in education, access to drinking water, health facilities, nutrition, and disease outbreaks, which affect people's health (67). Therefore, SES inequality has an important effect on health, prevention of diseases, and the prevention of deterioration of chronic diseases such as cancers.
5.1. Conclusions
Considering the fact that there has been no study on the role of SES inequality in recurrence, metastasis, grade and stage of GIC, SRH, and SRH-age so far, our study can demonstrate the importance of this topic. Metastasis in patients with cancer is very important because it is one of the most important factors for cancer survival. Patients with cancer without metastasis have more life expectancy and survival. Recurrence and grade of disease are also important factors in survival from cancer. Moreover, SRH plays an important role in early diagnosis and treatment of cancer.