
1. Context
Acute liver failure (ALF) is a life-threatening disease, characterized by a multi-system disorder, severe liver dysfunction with or without encephalopathy, and hepatocellular necrosis. Although the true incidence of ALF is unknown in pediatric patients, it has a high mortality rate, ranging from 24 to 53% (1). Pediatric ALF (PALF) has a variety of age- and geography-related etiologies. In a large number of children, the cause of PALF remains undetermined (2) due to several factors, such as limitations of detection instruments.
Due to the insufficient number of liver donations, it is necessary to identify patients with a poor prognosis to determine whether liver transplantation (LT) must be performed. Multiple prognostic factors have been studied so far, including the international normalized ratio (INR), severity of hepatic encephalopathy (HE), and serum ammonia level (3, 4). However, no optimal prognostic model has been developed for PALF so far. Generally, an optimal predictive model should include some static and dynamic parameters (5). To the best of our knowledge, there are no systematic reviews to determine the prognostic factors that may provide an ideal predictive model for PALF.
2. Objectives
In the present study, a systematic review and meta-analysis of prognostic studies was carried out, and the general prognostic factors predicting poor outcomes in studies on PALF were investigated for the development of a new prognostic model.
3. Methods
3.1. Study Selection
This systematic review and meta-analysis was conducted based on the PRISMA guidelines (6). The PubMed, Embase, and Cochrane databases (from 1950 to November 20, 2020) were searched to identify prognostic studies on PALF. The keywords included “pediatric acute liver failure”, “prediction”, “prognosis”, “epidemiology”, “child”, and “risk factors”. Also, “liver failure” and “prognosis” were used as the MeSH terms. The literature search strategy is presented in Appendix 1. The reference lists of all included studies were also reviewed to retrieve relevant publications.
The inclusion criteria for all publications were defined before the search. The inclusion criteria were as follows: (1) a study population of children aged 0 - 18 years; (2) identification of prognostic factors for PALF; (3) evaluation of outcomes, including spontaneous survival, death without undergoing LT, and undergoing LT; (4) a prospective or retrospective cohort design; and (5) published studies in English. On the other hand, the exclusion criteria were as follows: (1) focus on only the prognostic factors for PALF complications or LT; (2) comparison of the groups without prediction; and (3) assessment of treatment effects (e.g., transplantation or supportive devices). After omitting duplicates in the Endnote software, two independent reviewers selected studies by screening their titles and abstracts, according to the inclusion and exclusion criteria. They identified potentially eligible articles by reviewing the full-texts independently and subsequently. Disagreements were discussed and resolved in a consensus meeting.
3.2. Quality Assessment
The quality in prognosis studies (QUIPS) tool was used to examine the methodological quality (7). Since prognostic studies evaluated the possible prognostic factors, we did not assess the confounding variables; therefore, the QUIPS tool was used in this study. We developed a scoring algorithm to discriminate and summarize the quality of studies (Appendix 1). The total score was measured by summing the scores (maximum total score = 75). If the score was ≥ 60, the quality of the study was ranked as high; if the score was 45 - 59, it was considered moderate; and if it was < 45, it was considered low (8).
3.3. Data Extraction and Reporting
We extracted the data using a standardized extraction form (Table 1). The prognostic factors with statistical significance were selected from the multivariate and univariate analyses (P < 0.05). In the meta-analysis, we defined death (with or without LT) and LT as poor outcomes, regardless of the short- and long-term outcomes.
Table 1.
Methodological Characteristics of the Included Prognostic Studies
| Authors | Country (y) | Type | Uni Test/Multi | N Included | Population | Outcome | Significant Prognostic Factors from Multivariate Analysis | Significant Prognostic Factors from Univariate Analysis | Score |
|---|---|---|---|---|---|---|---|---|---|
| Kathemann 2015 (9) | Germany (2010 - 2013) | Retrospective | Univariate | 37 | 0 – 16 (y) (mean 1 y) | R or NSR | (1) Low ALT; (2) high ammonia; (3) low albumin | 63.5 | |
| Alam 2017 (10) | India (2011 - 2016) | Prospective | Multivariable | 109 | 0 - 18 (y) (mean 5.8 y) | R or death or LT | PELD-MELD (cutoff > 24), JE interval > 7 d. | Bilirubin, INR, ALT, lactate, J-E interval, KCC, PELD, cerebral edema, MODS, HE grade 3/4 | 61 |
| Bariş 2012 (11) | Turkey (1987 - 2006) | Retrospective | Univariate | 74 | 1 mo – 17 y (mean 5.8 y) | R or death | TB, DB, PT, INR, PH | 61 | |
| Hussain 2014 (12) | USA (2008 - 2011) | Retrospective | Univariate | 19 | mean 6.9 ± 1.3 (y) | R or death | (1) The HE scores; (2) lactate; (3) AST ALT; (4) the LIU scores; (5) EEG | 59.5 | |
| Ozcay 2016 (13) | Turkey (2000 - 2015) | Retrospective | Multivariable | 91 | 11 d - 17 y (mean 5.7 y) | R or LT or Ddeath | Grade 3 - 4 HE, TB, PT | HE grades 3 - 4, (PRISM), (PELD) scores, TB, DB, ammonia, lactate, APTT, PT, INR | 58.5 |
| Öztürk 2010 (14) | Turkey (2000 - 2007) | Retrospective | Multivariable | 21 | 1 - 14.7 (y) (median 8 y) | R or LT or death | Presence of encephalopathy, Serum phosphorus | Serum phosphorus, presence of encephalopathy | 58.5 |
| Pei 2014 (15) | China (2008 - 2013) | Retrospective | Multivariable | 53 | 2 mo – 14 y | R or death | INR, HE and serum albumin | INR, HE, ammonia, serum albumin, MODS, gastrointestinal bleeding | 58.5 |
| Chien 2019 (1) | TaiWan (2003 - 2016) | Retrospective | Univariate | 23 | 3 d – 15 y (mean 1.39 y) | R or NSR | Idiopathic etiology, ammonia, and AFP, plasma exchange more than six times | 57 | |
| Rajanayagam 2013 (3) | Australia (1991 - 2011) | Retrospective | Multivariable | 54 | 1 d - 15.6 y (median 1.4 y) | R or LT or death | High peak bilirubin and peak INR | (1) Bilirubin, ALT, AST, lactate, lactate dehydrogenase, platelets; (2) INR and bilirubin | 55 |
| ANN (artificial neural network) model | |||||||||
| Zhao 2014 (4) | CHINA (2007 - 2012) | Retrospective | Multivariable | 32 | ≤ 12 y | R or death | The entry blood ammonia | INR, creatinine, LDH, BLA, PTA | 54.5 |
| Di 2017 (16) | Italy (1996 - 2012) | Retrospective | Multivariable | 55 | 0.1 - 15.1 (y) (mean 2.6 y) | R or LT or death | Higher bilirubin and severe encephalopathy (grade 3/4) on admission | ALT, bilirubin, ammonia, INR | 53.5 |
| Kaur 2013 (17) | India (2008 - 2010) | Prospective | Multivariable | 43 | 0 – 18 (y) (mean 4.8 y) | R or death | (1) JE interval > 7 days and HE; (2) blood glucose | (1) HE, (2) bilirubin, (3) pH | 40.5 |
| Aydoğdu 2003 (18) | Turkish (1994 - 2002) | Retrospective | Univariable | 34 | 1 mo – 17 y | R or NSR | Encephalopathy grade, total and indirect bilirubin levels | 61.5 | |
| Ciocca 2008 (19) | Argentina (1982 - 2002) | Retrospective | Multivariable | 210 | 1 – 18 (y) | R or LT or death | Prothrombin time and encephalopathy III/IV | Peak bilirubin, PT, FV < 30 and HE III/IV | 63.5 |
| Lee 2005 (20) | UK (1991 - 2000) | Retrospective | Multivariable | 97 | 0 - 18 (y) | R or NSR | Time to onset of HE > 7 d, PT > 55 s, ALT≤ 2384 IU/L on admission | Time to onset of hepatic encephalopathy, PT, bilirubin, ALT | 63.5 |
| Lee 2020 (21) | Korea (2000 - 2018) | Retrospective | Multivariable | 146 | 1 mo – 18 y | R or LT or death | Peak TB, daily TB, peak INR, daily INR, peak ammonia, mechanical ventilator, renal replacement, vasopressor | 61 | |
| Squires 2006 (22) | USA (2000 - 2018) | Prospective | Multivariable | 348 | 0 - 18 (y) | R or NR or LT | TB ≥ 5 mg/dL, INR ≥ 2.55 and HE | 68.5 | |
| Sanchez 2011 (23) | Italian (2007 - 2012) | Retrospective | Multivariable | 40 | 6 mo -17 y | R or LT or death | TB, PELD-MELD | 58.5 | |
| Núñez-Ramos 2018 (24) | Spain (2005 - 2013) | Retrospective | Multivariable | 20 | ≤ 15 (y) | R or LT or death | PELD-MELD | 56 | |
| Azhar 2013 (25) | Multi-centers (since1999) | Retrospective | Multivariable | 49 | 0 - 18 (y) | R or LT or death | Dynamic Bayesian Network (DBN) analysis of inflammatory mediators | 63.5 | |
| Bucuvalas 2013 (26) | Multi-centers | Prospective | Univariable | 77 | Mean 9 (y) | R or LT or death | sIL2Rα | 59 | |
| Devarbhavi 2014 (27) | India (1996 - 2012) | Retrospective | Multivariable | 61 | Children with Wilson Disease (WD) 9.7 ± 2.8 (y) | R or NSR | Encephalopathy and total bilirubin | Encephalopathy, INR, total proteins, TB, DB, alkaline phos-phatase, serum creatinine, white blood cell count, PELD/MELD score, King’s College Criteria score, Nazer score | 60.5 |
| Feldman 2017 (28) | Multi-centers (1999 - 2010) | Prospective | Univariable | 537 | 0 - 18y | R or LT or death | The initial lactate or pyruvate molar ratio (L: P) were not association with biochemical variables of clinical severity or clinical outcome. | 55.5 | |
| Grama 2020 (29) | Romania (2015 - 2018) | Prospective | Univariable | 34 | 1 mo - 17 y | R or NSR | Vitamin D-binding protein (Gc-globulin) serum levels | 59 | |
| Lal 2020 (30) | India (2012 - 2019) | Prospective | Multivariable | 120 | 8.6 ± 4.6 (y) | R or death | HE grade 3/4, INR ≥ 3.1, JE interval ≥ 10 s | INR, grade of HE, JE interval | 60.5 |
| Etiology (HAV) specific prognostic model (Peds-HAV model) | |||||||||
| Lebel 2003 (31) | USA (1990 - 2001) | Prospective | Univariable | 24 | 1.1 - 17 (y) | R or NSR | TB, INR, factor VII, PABA | 56.5 | |
| Lu 2013 (32) | Multi-centers (1999 - 2008) | Retrospective | Multivariable | 461 | 1.1 - 13.5 (y) | LT or death | Liver injury units (LIU) scoring system, admission LIU (aLIU) score | 65 | |
| Quintero 2014 (33) | Spain (2005 - 2011) | Prospectively | Multivariable | 48 | 5.15 - 9.3 (y) | R or NSR | Indocyanine green plasma disappearance rate (ICG - PDR) | 61.5 | |
| Sundaram 2013 (34) | Multi-centers (1999 - 2009) | Retrospective | Univariable | 522 | 0 - 17.9 (y) | R or death | KCHC does not reliably predict death in PALF | 60 | |
| Uchida 2017 (35) | Japan (2005 - 2015) | Retrospective | Univariable | 73 | 2.6 ± 3.3 (y) | LT or no LT | Scoring system established by the Intractable Hepato-Biliary Disease Study Group (JIHBDSG) | 62.5 | |
Abbreviations: R, survive with native liver; LT, liver transplantation; Death, died without LT; NSR, non-recovered spontaneously; INR, international normalized ratio; ALT, alanine aminotransferase; LDH, lactate dehydrogenase; PELD, the pediatric end-stage liver disease; KCC, King's College Criteria; MELD, the model for end-stage liver disease; HE, hepatic encephalopathy, OR, odd’s ratio, SD, standard deviation; J-E interval, jaundice to encephalopathy interval; DB, direct bilirubin; PTA, prothrombin time activity; TB, total bilirubin; PRISM, pediatric risk of mortality; PABA, para-aminobenzoi; FV, factor V; AST, aspartate aminotransferase; LIU, liver injury units scoring system.
3.4. Statistical Analysis
For the meta-analysis, we extracted the mean and SD of variables in the included studies. Data reported as median and range were transformed into mean and SD using statistical methods (36). Due to anticipated heterogeneity, we used the random-effects model, as it is more conservative. The effect size and 95% confidence intervals (CIs) are also presented in the forest plots. Moreover, Cochran’s Q and Higgins I2 tests were used to examine the heterogeneity of studies. The Cochrane’s Q P-value < 0.1 and I2 > 50% indicated the high level of heterogeneity among studies. In case of significant heterogeneity, a sensitivity analysis was conducted by eliminating studies one at a time. Besides, funnel plot and Egger’s test were used for evaluating the potential publication bias. If publication bias was detected, Duval’s trim-and-fill method was applied. Since different measurement methods were used in different studies, we used the standardized mean difference (SMD) and odds ratio (OR) for the groups. The RevMan software was used for statistical analysis. P-value < 0.05 was considered statistically significant, unless otherwise specified (registration number: INPLASY202040116).
4. Results
4.1. Search Results and Inclusion of Studies
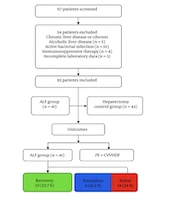
A total of 1465 studies were extracted in the initial search (Figure 1). Thirty articles were finally included in this study. Generally, prognostic models are scores derived by biochemical or clinical variables and cannot be included as variables on their own. Therefore, we did not include the prognostic models or factors that were discussed only once in the studies in our meta-analysis. We also excluded studies collecting data related to prognostic factors at their peaks. The study by Kaur (2013) (17) was ranked as low quality and was excluded. Finally, 16 studies were included in the meta-analysis.
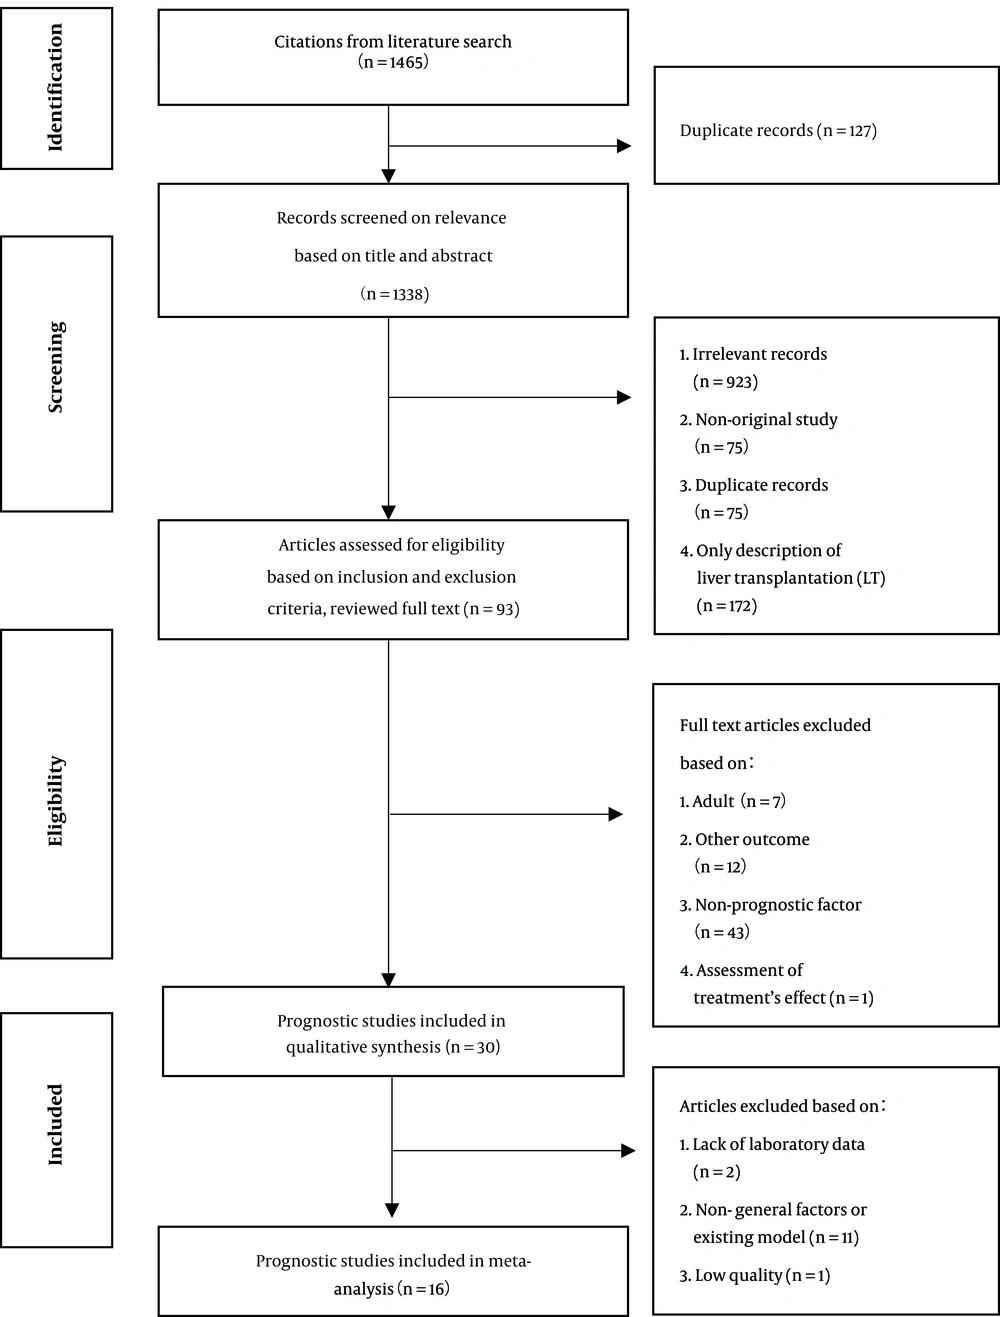
Figure 1.
Selection and number of publications
There were six definitions of PALF in 30 included articles (Table 2). The heterogeneity of the definitions was small. The main differences were related to coagulopathy, high bilirubin level, jaundice, course of the disease, and HE. Generally, the definition proposed by the PALF study group is widely accepted (22), and most of the retrieved studies used this definition.
Table 2.
Definitions of PALF
| Definition | References |
|---|---|
| Definition of PALF study group: (1) no pre-existing chronic liver disease; (2) coagulopathy that cannot be corrected by vitamin K. It was defined as INR ≥ 1.5 with HE or, INR ≥ 2.0 with or without HE; (3) acute liver injury. | (1, 3, 9-17, 21-30, 32-34) |
| (1) Coagulopathy (PT > 24s or INR > 2.0) and HE; (2) no pre-existing liver disease; (3) liver disease within 8 weeks. HE is not absolutely necessary. | (18, 20, 37) |
| Coagulopathy (PT < 50% and INR > 2), HE is not absolutely necessary. | (19) |
| Chinese definition: (1) coagulopathy (prothrombin activity (PTA) ≤ 40% or INR ≥ 1.5) without hematologic diseases; and (2) jaundice (total bilirubin (TB) ≥ 171 μmol/L); (3) liver disease within 4 weeks; (4) no pre-existing chronic liver disease. | (4) |
| Acute liver failure coagulopathy (factor II and factor V (reduced by more than 50%). HE is not absolutely necessary. | (31) |
| (1) Acute liver injury with HE and INR > 1.5; (2) previously healthy liver. | (35) |
4.2. Study Characteristics
Fifteen studies were classified as high quality, 14 studies as moderate quality, and one study as low quality. Overall, there were nine prospective studies and 21 retrospective studies. 19 studies were multivariate analyses. There were 3512 patients examined in these studies.
4.3. Prognostic Factors
The indicators extracted from the studies were divided into four categories: general markers (7), biomarkers (38), scoring systems (22), and treatments (4) (Appendix 1). Overall, 18 factors were described in at least two studies (Figure 2).
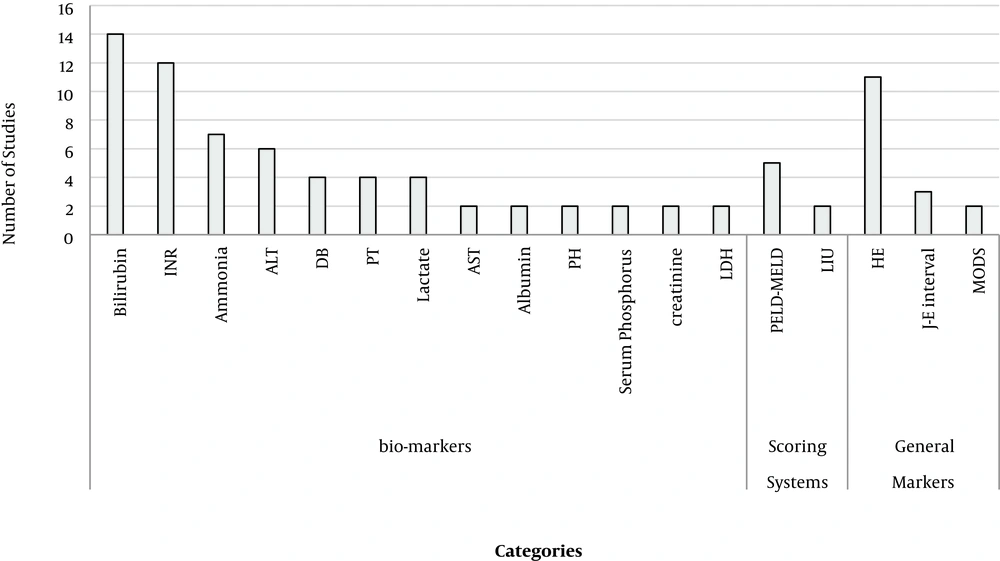
Figure 2.
Indicators with the number of studies with significant
We conducted a meta-analysis of some general markers and biomarkers described in the included studies (Table 3). According to the pooled results, INR (OR, 0.78; 95% CI, 0.42 - 1.14; P < 0.05), ammonia (OR, 0.41; 95% CI, 0.15 - 0.67; P < 0.05), alanine aminotransferase (ALT) level (OR, 0.41; 95% CI, 0.21 - 0.58; P < 0.05), aspartate transaminase (AST) level (OR, 0.26; 95% CI, 0.01 - 0.50; P < 0.05), bilirubin (OR, 0.66; 95% CI, 0.49 - 0.83; P < 0.05), albumin (OR, 0.42; 95% CI, 0.18 - 0.66; P < 0.05), severe HE (grade 3/4) (OR, 0.19; 95% CI, 0.10 - 0.37; P < 0.05), sex (male) (OR, 0.63; 95% CI, 0.46 - 0.85; P < 0.05), and lactate (OR, 0.69; 95% CI, 0.40 - 0.98; P < 0.05) were significantly associated with poor outcomes.
Table 3.
Meta-analysis of Parameters
| Parameters | Studies | Participants | Effect Estimate | I2 (%) | P |
|---|---|---|---|---|---|
| 1.1. INR | 11 | 776 | 0.78 [0.42 - 1.14] | 79 | < 0.05 |
| 1.2. INR (subgroup) | 11 | 776 | 0.78 [0.42 - 1.14] | 79 | < 0.05 |
| 1.2.1. No newborn | 7 | 589 | 0.83 [0.32 - 1.33] | 86 | < 0.05 |
| 1.2.2. Include newborn | 4 | 187 | 0.71 [0.33 - 1.08] | 27 | < 0.05 |
| 1.3. INR (no LT) | 6 | 261 | 0.73 [0.06 - 1.51] | 86 | 0.07 |
| 2.1. Ammonia | 8 | 471 | 0.41 [0.15 - 0.67] | 44 | < 0.05 |
| 2.2. Ammonia (subgroup) | 8 | 471 | 0.41 [0.15 - 0.67] | 44 | < 0.05 |
| 2.2.1. No newborn | 5 | 304 | 0.46 [0.06 - 0.86] | 62 | 0.02 |
| 2.2.2. Include nowborn | 3 | 167 | 0.33 [0.02 - 0.65] | 0 | 0.04 |
| 2.3. Ammonia (no LT) | 2 | 68 | 0.70 [0.19 - 1.20] | 0 | 0.007 |
| 3.1. ALT levels | 9 | 572 | 0.41 [0.24, 0.58] | 0 | < 0.05 |
| 3.2. ALT (subgroup) | 9 | 572 | 0.41 [0.24, 0.58] | 0 | < 0.05 |
| 3.2.1. No newborn | 6 | 366 | 0.40 [0.17, 0.62] | 7 | < 0.05 |
| 3.2.2. Include newborn | 3 | 206 | 0.43 [0.14, 0.71] | 0 | 0.003 |
| 3.3. ALT (no LT) | 3 | 122 | 0.21 [-0.16, 0.59] | 0 | 0.26 |
| 4.1. Bilirubin | 15 | 986 | 0.66 [0.49 - 0.83] | 32 | < 0.05 |
| 4.2. Bilirubin (subgroup) | 15 | 986 | 0.66 [0.49 - 0.83] | 32 | < 0.05 |
| 4.2.1. No newborn | 9 | 648 | 0.72 [0.55 - 0.89] | 0 | < 0.05 |
| 4.2.2. Include newborn | 6 | 338 | 0.57 [0.14 - 1.00] | 69 | 0.01 |
| 4.3. Bilirubin (no LT) | 7 | 288 | 0.65 [0.40 - 0.89] | 0 | < 0.05 |
| 5.1. Albumin | 7 | 310 | 0.42 [0.18, 0.66] | 0 | < 0.05 |
| 5.2. Albumin (subgroup) | 7 | 310 | 0.42 [0.18, 0.66] | 0 | < 0.05 |
| 5.2.1. No newborn | 4 | 172 | 0.54 [0.16, 0.92] | 28 | < 0.05 |
| 5.2.2. Include newborn | 3 | 138 | 0.26 [-0.10, 0.61] | 0 | 0.15 |
| 5.3. Albumin (no LT) | 4 | 103 | 0.52 [0.12, 0.92] | 0 | 0.01 |
| 6.1. AST levels | 5 | 284 | 0.26 [0.01, 0.50] | 0 | 0.04 |
| 6.2. AST levels (subgroup) | 5 | 284 | 0.26 [0.01, 0.50] | 0 | 0.04 |
| 6.2.1. No newborn | 4 | 230 | 0.23 [-0.08, 0.54] | 21 | 0.14 |
| 6.2.2. Include newborn | 1 | 54 | 0.37 [-0.17, 0.91] | Not | 0.18 |
| 6.3. AST levels (no LT) | 5 | 259 | 0.30 [0.05, 0.56] | 0 | 0.02 |
| 7.1. Creatinine | 3 | 131 | -0.16 [-0.52, 0.20] | 0 | 0.39 |
| 8.1. Lactate | 2 | 200 | 0.69 [0.40 -0.98] | 0 | < 0.05 |
| 9.1. HE grade 3/4 | 9 | 948 | 0.19 [0.10, 0.37] | 65 | < 0.05 |
| 9.2. HE grade ¾ (subgroup) | 9 | 948 | 0.19 [0.10, 0.37] | 65 | < 0.05 |
| 9.2.1. No newborn | 4 | 386 | 0.19 [0.07, 0.55] | 65 | 0.002 |
| 9.2.2. Include newborn | 5 | 562 | 0.18 [0.07, 0.49] | 66 | 0.0008 |
| 9.3. HE grade 3/4 (no LT) | 5 | 408 | 0.08 [0.01, 0.54] | 83 | 0.009 |
| 10.1. Age | 8 | 483 | 0.07 [-0.26, 0.11] | 0 | 0.45 |
| 11.1. Sex (male) | 8 | 706 | 0.63 [0.46, 0.85] | 0 | 0.003 |
| 11.2. Sex (subgroup) | 8 | 706 | 0.63 [0.46, 0.85] | 0 | 0.003 |
| 11.2.1. No newborn | 4 | 192 | 0.71 [0.39, 1.31] | 0 | 0.28 |
| 11.2.2. Include newborn | 4 | 514 | 0.60 [0.42, 0.85] | 0 | 0.004 |
| 11.3. Sex (no LT) | 4 | 308 | 0.79 [0.41, 1.54] | 15 | 0.50 |
| 12.1. Etiology (include LT) | 9 | ||||
| 12.1.1. Indeterminate | 8 | 914 | 0.40 [0.29, 0.54] | 0 | < 0.05 |
| 12.1.2. Metabolic | 6 | 665 | 0.73 [0.41, 1.29] | 23 | 0.28 |
| 12.1.3. Autoimmune | 7 | 692 | 1.06 [0.57, 1.98] | 1 | 0.86 |
| 12.1.4. Drugs | 8 | 801 | 4.02 [2.52, 6.43] | 0 | < 0.05 |
| 12.1.5. Infective | 8 | 801 | 1.32 [0.76, 2.30] | 40 | 0.32 |
| 12.2. etiology (no LT) | 9 | ||||
| 12.2.1. Indeterminate | 8 | 615 | 0.36 [0.16, 0.80] | 62 | 0.01 |
| 12.2.2. Metabolic | 6 | 431 | 0.52 [0.28, 0.94] | 0 | 0.03 |
| 12.2.3. Autoimmune | 7 | 458 | 0.97 [0.43, 2.22] | 0 | 0.95 |
| 12.2.4. Drugs | 8 | 552 | 2.94 [1.62, 5.37] | 0 | < 0.05 |
| 12.2.5. Infective | 8 | 552 | 1.44 [0.77, 2.69] | 37 | 0.26 |
Abbreviation: LT, liver transplantation.
In the subgroup without LT, ammonia, bilirubin, albumin, AST, and severe HE (grade 3/4) were significantly associated with death (without LT). The INR (P = 0.07), ALT levels (P = 0.26), and sex (male) (P = 0.50) were not associated with death (without LT). In the subgroup of newborns, the predictive role of INR, ammonia, ALT levels, bilirubin, and severe HE (grade 3/4) were stable in newborns. In the subgroup of newborns, albumin was not associated with poor outcomes. However, regarding sex (male), in the subgroup without newborns, the relationship was not statistically significant.
Based on the results, the inclusion of newborn patients influenced the AST levels, while in two subgroups including newborns, the AST levels were not associated with poor outcomes; generally, the role of AST level is a controversial issue. Moreover, lactate was associated with poor outcomes; however, there were only two studies reporting this finding. On the other hand, creatine and age were not associated with poor outcomes (P = 0.39). As for etiology, in the subgroup including LT patients, indeterminate and drug-induced diseases were associated with poor outcomes. Also, in the non-LT subgroup, indeterminate diseases, drug-induced diseases, and metabolic diseases were associated with mortality.
4.4. Heterogeneity and Publication Bias
The analysis of INR (I2 = 0.79) and HE grade (3/4) (I2 = 0.65) indicated heterogeneity. Based on the sensitivity analysis by excluding individual studies, it was found that studies by Ciocca in 2008 (19) and Squires in 2006 (22) affected the pooled results significantly. By reviewing these two studies, we found that the definition proposed by Ciocca in 2008 did not exclude patients with preexisting liver diseases. Generally, pre-damaged liver may affect coagulation. However, it did not influence the heterogeneity of other parameters. Although identification of higher grades of HE (grade 3/4) was not difficult in children, HE grades were still assessed subjectively. Overall, heterogeneity was unavoidable. The corresponding pooled ORs of other parameters did not significantly change by eliminating one study at a time (data not shown). A funnel plot is presented in Appendix 1. According to Egger’s test (P = 0.3731), there was no significant publication bias.
5. Discussion
It is generally important to identify patients with a poor prognosis. However, no optimal prognostic model has been developed for PALF so far. A proper prognostic model should include stable and accessible clinical indicators; have high sensitivity and specificity; include some static and dynamic parameters; and comprise of a combination of single parameters (5). We aimed to determine the prognostic factors that may contribute to the development of a new prognostic model. The INR, ammonia, ALT levels, AST levels, bilirubin, albumin, severe HE (grade 3/4), sex (male), and lactate were significantly associated with poor outcomes.
Generally, the increased ammonia level in the plasma indicates the loss of functional liver mass, predisposition to HE, and the increased level of glutamine in astrocytes (2). Deep (39) found that the reduction of ammonia after 48 hours of continuous renal replacement therapy (CRRT) was associated with survival, according to the multivariate analysis (P = 0.004). A study by Ng revealed that severe HE was associated with mortality in 769 children (40). Nevertheless, HE is a dynamic condition, which is difficult to assess in children. Therefore, serial neurological assessments must be carried out routinely during hospitalization of patients. In this regard, Hussain found that electroencephalography (EEG) could help identify children with a possible poor prognosis or those requiring LT (12). The serum S100b and IL-6 levels can also assist us in the assessment of brain injury (41). However, use of the existing assessment tools is still limited. Therefore, there is a pressing need to develop a reliable biomarker for brain damage to be used across different pediatric age groups.
The ALT and AST levels are sensitive indices of liver function, closely related to the degree of liver damage. However, liver enzymes of children with spontaneous recovery were higher on admission. These indices were also found to be statistically significant in studies by Rajanayagam (3) and Kathemann (9). The reason may be that pre-damaged livers have lower liver enzymes, such as gestational alloimmune liver disease and Wilson’s disease, which are commonly associated with poor outcomes (9).
A high INR represents severe hepatocellular dysfunction. INR is generally a predictor of poor outcomes, as reported in many studies (42, 43). In the King’s College Hospital (KCH) model, INR > 4 showed a good predictive capability (AUC = 0.79). On the other hand, albumin and bilirubin levels represented the synthesizing functions of the liver (15). Besides, INR combined with arterial ammonia, HE, and serum bilirubin showed a good predictive capability (AUC = 0.91) (44). In the pediatric end-stage liver disease (PELD) model, INR combined with albumin, bilirubin, and age showed 81% specificity and 86% sensitivity for poor outcomes.
Only two studies examined the lactate level. Feldman found that lactate could not predict the 21-day clinical outcomes. As for gender, few studies, which were mostly univariate analyses, identified its prognostic role; therefore, further research is needed. Rajanayagam developed an artificial neural network (ANN) model (37), which consisted of 34 input variables, such as ALT, AST, ammonia, albumin, lactate, prothrombin time (PT), INR, and serum bilirubin. This model showed a superior predictive power for poor outcomes. Besides, in the literature, dynamic models (44), such as dynamic Bayesian network (DBN) analysis of inflammatory mediators (25) and ANN models (37), have been found to be promising.
Age was found to be a prognostic factor in studies by Zhao (45) and Deep (39), considering the children’s small size, rapidly progressive etiologies of the disease, and long waiting time for LT. While this factor is included in the PELD model, our meta-analysis was different, and further evidence is needed. Moreover, a high creatinine level is included in the model for end-stage liver disease (MELD) criteria. Nevertheless, in our study, this factor was not statistically significant, although some studies on children have confirmed its significance (38), which may be due to the fact that kidney function is rarely impaired in children, even in those with liver failure.
To reduce the effect of LT on the natural course of PALF and to investigate survival, we included studies on patients without LT. In this subgroup, ammonia, bilirubin, albumin, AST, and severe HE (grade 3/4) were significantly associated with death (without LT); this finding is important for identifying children who can recover without LT; however, the results are not replicable if LT is performed. Overall, neonatal liver failure is an independent phenomenon, which does not have a natural course like other PALFs. In this newborn subgroup, the predictive role of INR, ammonia, ALT, bilirubin, and severe HE (grade 3/4) was stable. Besides, the ALT levels and INR predicting the prognosis of neonatal liver failure have been previously reported (46).
As for etiology, children with indeterminate and drug-induced diseases were more likely to have poor outcomes due to several reasons, such as limitations of detection instruments and genetic susceptibility (47), and were more likely to receive LT (48). In the subgroup without LT, metabolic diseases were also associated with poor outcomes. In recent studies, etiology-specific prognostic models have shown optimal sensitivity and specificity, such as Peds-HAV (30) and Wilson’s score (5).
5.1. Limitations
This study had some limitations. We focused on published studies written in English language in the inclusion criteria, leading to possible language bias. Also, we focused on studies assessing the prognostic value of different factors for poor outcomes; therefore, we might have missed some studies focusing less on prediction. The scoring algorithm used in our study had arbitrary cut-off points; nevertheless, readers can draw conclusions from the details presented in the studies. Besides, some studies had a retrospective design and a small sample size. Heterogeneity was inevitable in this study, because we ignored the heterogeneity of some characteristics, such as follow-up duration; therefore, further analyses on larger prospective cohorts are needed. Also, inclusion of LT as a poor outcome was limited by the criteria for listing at respective centers, living donor liver transplantation (LDLT) vs. deceased donor liver transplant (DDLT) programs, availability of LT, and use of bridging therapies. Finally, since limited studies have been conducted on PALF, we synthesized significant univariable factors rather than multivariable factors. Therefore, the effects of these factors may be unavoidable, and further multivariable studies are necessary in the future.
6. Conclusions
We summarized several prognostic factors for the poor outcomes of PALF, including etiology (indeterminate diseases and drug-induced diseases), INR, ammonia, ALT levels, AST levels, bilirubin, albumin, and severe HE. Regardless of LT, etiology (indeterminate diseases, drug-induced diseases, and metabolic diseases), ammonia, bilirubin, albumin, AST, and severe HE (grade 3/4) were significantly associated with death (without LT). These prognostic factors might be of significance in the development of a new prognostic model. However, due to unavoidable heterogeneity, they must be considered with caution. Further high-quality studies on larger cohorts are also needed.