


1. Background
The educational environment, due to its inherent complexity, could be expressed as the “social interactions, organizational culture and structures, and physical and virtual spaces that surround and shape the learners' experiences, perceptions, and learning” (1). In the medical post-graduate curriculum, the quality of the hospital educational environment (HEE) is a profound determinant of the satisfaction, engagement, and training outcomes of health professionals. A supportive, stimulating, and congenial HEE is most often conducive to the success of trainee physicians. However, lack of support and perception of exclusion, harassment, or injustice could adversely impact the psychological health of the medical trainees, leading to exhaustion, burnout, and depressive disorders (2-4). Furthermore, a suboptimal learning environment and negligence toward resident's social exigencies lead to lousy learning outcomes that directly affect the clinical performance of physicians and the quality of patient care (5-7). Therefore, evaluation and improvement of the psychological safety of the HEE are of utmost concern for educators, academic institutions, accreditation organizations, and researchers in medical education (7-11).
Various psychometric tools have been developed to tangibly measure the quality of the clinical learning environment besides serving as an indicator for improvement over time (1, 10, 12). Additionally, it also enables analysis of the disparities in the quality of the learning environment between different settings or departments in the same health care system or institution. Some of these tools are focused on specific specialties, such as the anesthetic theatre educational environment measure (ATEEM) (13) and the surgical theatre educational environment measures (STEEM) (14), whereas the Post-graduate Hospital Educational Environment Measure (PHEEM) designed by educators from the University of Dundee covers all specialties (15). Since its first implementation in 2005, PHEEM has gained acceptance and has been validated in several educational settings throughout the globe (16).
In Saudi Arabia, several authors have assessed the learning environments in their local settings for both interns and residents (17), only interns (18), or post-graduate residents in all (19) or specific specialties, including family medicine (20), urology (21, 22), and pediatrics (23). The only study involving pediatric residents was conducted in the Eastern region of Saudi Arabia in 2015.
2. Objectives
This study primarily examines the status quo of the post-graduate educational environment for pediatric fellows and residents at King Abdulaziz University Hospital (KAUH). We set out to assess the reliability and practicality of PHEEM to measure the quality of the educational environment in pediatric residency programs and identify potential sections that may require serious attention and improvisation.
3. Methods
3.1. Participant Sampling, Study Design, and Setting
A quantitative cross-sectional study was conducted at the Pediatrics Department of KAUH, Jeddah, Saudi Arabia, in the second half of 2021. The study included all general pediatrics residents and fellows from various pediatric subspecialties who received training at the department during the academic year 2020 - 2021. A convenience sampling method was used to include all eligible participants. The study protocols and tools were reviewed and ethically approved by the Biomedical Ethics Research Committee of King Abdulaziz University (Ref. No. 289-21).
3.2. Psychometric Tools for Hospital Educational Environment
The demographic and educational factors included age, gender, marital status, training affiliations, post-graduate year, and subspecialty (general pediatrics, pediatric intensive care unit [PICU], neonatal intensive care unit [NICU], and pediatric cardiology), and the type of training received. The assessment of the clinical learning environment used a widely adopted PHEEM questionnaire tool developed and validated by Roff et al. in 2005 (15) and later adopted in various medical post-graduate specialties in Saudi Arabia (17) and worldwide (16, 24-26).
3.3. Data Collection Procedure
Upon ethical approval, the PHEEM questionnaire was distributed to all pediatric trainees at KAUH via a Google Drive link, coordinated through the pediatric post-graduate office. Participants received a written notice clarifying that the participation was voluntary, responses would remain confidential, and no personal information would be collected. The participants were instructed to complete the PHEEM questionnaire, designed to evaluate various aspects of the post-graduate educational environment. Responses were automatically saved and stored securely. A 100% response was registered from a total of 71 participants comprising general pediatric residents (n = 57) and pediatric subspecialties fellows (n = 14).
3.4. Scoring of the Post-graduate Hospital Educational Environment Measure Questionnaire
Answers to the 40 PHEEM items were scored according to the level of agreement with respective statements using a 5-point Likert scale as used in the original PHEEM. A higher score indicates a better HEE. The PHEEM score was calculated as the sum of all scores of 40 items; hence, the minimum and maximum possible scores of the questionnaire lay between 0 and 160, respectively. The PHEEM score was divided into 4 levels: Poor (0 - 40), suboptimal (41 - 80), more positive with the need for improvement (81 - 120), and optimal (121 - 160). Scores for subscales of perceptions of role autonomy (P1, 14 items), teaching (P2, 15 items), and social support (P3, 11 items) were scaled from 0 - 40 and were calculated as the sum of respective item scores multiplied by 10 and divided by the number of items. The questionnaire was designed for online access using Google Forms. A link was created and emailed to all training residents and fellows. Given the relative length of the questionnaire, the survey link was active for 4 months, with reminder messages sent to the participants every 2 weeks.
3.5. The Construct Validity of the Post-graduate Hospital Educational Environment Measure
Principal component analysis (PCA) was carried out, followed by Varimax rotation, to explore the interrelationship among the 40 PHEEM items. The suitability of the dataset for factor analysis was assessed using the Kaiser-Meyer-Olkin (KMO) measure of sampling adequacy and Bartlett's test of sphericity. A KMO measure exceeding 0.5 indicates an adequate sample size for PCA. A P value below 0.05 in Bartlett's test indicates a significant deviation of the correlation matrix from an identity matrix, implying variable correlation and validating the use of PCA for data reduction. Initial extraction criteria considered an eigenvalue ≥ 1 and an extraction value above 0.5. This was followed by the Scree plot analysis and comparison of calculated eigenvalues with the Monte Carlo parallel PCA by setting the number of replications to 100. Subsequent to the extraction of components via PCA, we employed Varimax rotation with Kaiser Normalization. Components were retained if their eigenvalue in real analysis exceeded that in the parallel analysis; otherwise, the component was rejected. Subsequently, a second extraction was carried out by fixing the number of factors to 3, and the final extraction criteria involved removing the unloaded items.
3.6. Statistical Analysis
Statistical analysis was performed using SPSS version 21 (SPSS Inc, Chicago, IL, USA). Categorical variables are presented as frequency and percentage, while continuous variables are presented as mean and SD. The reliability of the PHEEM scale and subscales was analyzed by estimating Cronbach's Alpha with and without deleted items. Correlations between the scores of the 3 subscales were evaluated using Pearson's correlation. The PHEEM and subscale scores among the demographic and academic factors were compared using an independent t-test and 1-way analysis of variance (ANOVA) as appropriate. A P value of < 0.05 was considered to reject the null hypothesis.
Additionally, one-way multivariate ANOVA (MANOVA) was used to analyze the interaction effect between the 3 PHEEM subscale scores and the demographic and academic factors. Box’s test of equality of covariance matrices was used to test the hypothesis of non-equality of covariance, which was rejected for a significance value > 0.005, thereby confirming the equality of covariance. F-statistics were analyzed using Pillai’s Trace, and the effect size was indicated by partial Eta squared. Where appropriate, Post hoc analysis was conducted using the least significant difference (LSD) test.
4. Results
4.1. Participant’s Characteristics and Internal Consistency of the Post-graduate Hospital Educational Environment Measure Scales and Score Statistics
Seventy-one trainees responded to the PHEEM questionnaire during the study period, with a response rate of 100%. Among the participants, 56.3% were female; the mean age was 27.90 ± 2.70 years. Most participants were from the first (23.9%) and second post-graduate (33.8%) years. Further, 83.1% of the trainees were from the general pediatrics department (Table 1).
Table 1.Participant’s Demographic and Educational Characteristics (N = 71)
| Parameters and Categories | No. (%) |
|---|---|
| Age (y) | |
| ≤ 27 | 39 (54.9) |
| > 27 | 32 (45.1) |
| Mean ± SD | 27.9 ± 2.7 |
| Gender | |
| Male | 31 (43.7) |
| Female | 40 (56.3) |
| Marital status | |
| Single | 32 (45.1) |
| Married | 39 (54.9) |
| Institutions | |
| KAUH | 69 (97.2) |
| IMC | 2 (2.8) |
| Post-graduate year | |
| First | 17 (23.9) |
| Second | 24 (33.8) |
| Third | 14 (19.7) |
| Fourth | 6 (8.5) |
| Fifth | 7 (9.9) |
| Sixth | 2 (2.8) |
| Seventh | 1 (1.4) |
| Specialty | |
| General pediatric | 59 (83.1) |
| PICU | 3 (4.2) |
| NICU | 4 (5.6) |
| Cardiology | 3 (4.2) |
| Gastroenterology | 2 (2.8) |
| Type of training | |
| Complete | 62 (87.3) |
| Joint | 9 (12.7) |
Abbreviations: KAUH, King Abdulaziz University Hospital; PICU, pediatric intensive care unit; NICU, neonatal intensive care unit.
The PHEEM questionnaire was highly reliable, with a Cronbach's alpha value of 0.948. Similarly, the 3 subscales showed acceptable to high reliability. The overall PHEEM score was 99.35 ± 22.46 out of 160, and the mean scores of the 3 individual domains were as follows: Perceptions of autonomy (24.03 ± 6.10), perception of teaching (26.97 ± 5.83), and perception of social support (22.96 ± 5.80) out of 40 (Table 2).
Table 2.Internal Consistency and Descriptive Statistics of the Post-graduate Hospital Educational Environment Measure Questionnaire and Its 3 Subscales
| Scales | No. of Items | Cronbach’s Alpha | Reliability Level | Score Statistics | ||
|---|---|---|---|---|---|---|
| Mean ± SD | Range | Ref. Range | ||||
| PHEEM | 40 | 0.948 | Very high | 99.35 ± 22.46 | 29 - 148 | 0 - 160 |
| Perceptions of role autonomy | 14 | 0.872 | High | 24.03 ± 6.10 | 7.86 - 36.43 | 0 - 40 |
| Perceptions of teaching | 15 | 0.897 | High | 26.97 ± 5.83 | 7.33 - 38.67 | 0 - 40 |
| Perceptions of social support | 11 | 0.777 | Acceptable | 22.96 ± 5.80 | 6.36 - 37.27 | 0 - 40 |
Abbreviations: PHEEM, Post-graduate Hospital Educational Environment Measure.
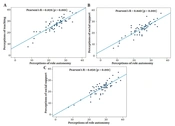
The scores of the 3 domains were strongly intercorrelated, with Pearson's R coefficients of 0.840 - 0.859 (Figure 1).

Figure 1.
Linear correlations between the scores of the 3 Post-graduate hospital educational environment measure subdomains
The distribution pattern of the total PHEEM scores for the 71 participants based on 4 levels of classification showed poor (2.8%), suboptimal (9.9%), more positive with a requirement for improvement (73.2%), and optimal (14.1%).
4.2. Reliability and Validity of the Post-graduate Hospital Educational Environment Measure Scale and Its Subscales: Principal Factor Analysis
The means and SDs of the 40 PHEEM items and the Cronbach's alpha value for the subdomain and overall PHEEM, if the item is deleted, are listed in Appendix 1. The mean scores of items ranged from 1.85 to 2.94 in perceptions of autonomy, 2.44 to 3.06 in the perception of teaching, and 1.25 to 3.13 in perceptions of the social support domain. Kaiser-Meyer-Olkin's measure of sampling adequacy was 0.714 with a significant Bartlett's test of sphericity (P < 0.0001), indicating the suitability of the datasets for factor analysis. Ten components met the initial criteria with eigenvalue > 1 and factor loading > 0.5, explaining 75.9% of the scale variance. The first component had the highest eigenvalue of 14.53, accounting for 36.3% of the variance, while the eigenvalues gradually decreased from 3.24 to 1.02 for the remaining 9 components, with a model variance from 8.09% to 2.55% (Appendix 2).
The Scree plot analysis showed a non-frank inflection point at the third component (Figure 2), which was further validated upon comparing eigenvalues with the Monte Carlo PCA, suggesting a likely presence of 2- to 3-dimension constructs.

Figure 2.
The Scree plot of the initial component analysis of the Post-graduate hospital educational environment measure questionnaire
Repeat PCA analysis by fixing the number of factors at 3 supported a 3-dimensional model, accounting for 50.34% of the variance; however, the PHEEM items 11, 12, 18, 34, and 39 were not loaded at the desired 0.5 level. A final PCA estimation by removing the 5 unloading items and fixing the number of factors to 3 resulted in a cumulative variance of 53.37%. The final extraction and Varimax rotation supported the likelihood of a 3-dimensional structure, with the predominance of the first component accounting for 38.04% of the variance and comprising 17 PHEEM items. Seven belonged to the 'teaching dimension," 5 to the "role autonomy," and 5 to the "social support domain." The 2 other components represented a variance of 8.78% and 6.55%, respectively, and comprised 8 items, each with no consistency to any original dimensions (Appendices 2 and 3). To assess the validity of the PCA-based 3-dimensional model, we analyzed the bivariate correlations between the newly calculated scores on components 1, 2, and 3. We found moderate-to-acceptable correlations with Pearson's correlation coefficients of 0.544-0.712, significantly lower than those between the 3 original dimensions.
4.3. Factors Associated with Post-graduate Hospital Educational Environment Measure Score and Domain Scores
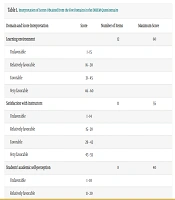
The PHEEM scores were found to be significantly higher with P value = 0.037 among participants with age > 27 years (105.47 ± 19.83) compared to the younger age group (94.33 ± 23.48). Also, in the first post-graduate year (87.76 ± 21.21), trainees scored remarkably less compared to their elder peers (P = 0.008; Table 3).
Table 3.Factors Associated with Post-graduate Hospital Educational Environment Measure Score
| Parameters and Categories | Mean ± SD | P-Value |
|---|---|---|
| Gender | 0.227 | |
| Male | 95.68 ± 26.26 | |
| Female | 102.2 ± 18.86 | |
| Age (y) | 0.037 a | |
| ≤ 27 | 94.33 ± 23.48 | |
| > 27 | 105.47 ± 19.83 | |
| Marital status | 0.095 | |
| Single | 94.44 ± 25.3 | |
| Married | 103.38 ± 19.23 | |
| Post-graduate year | 0.008 a | |
| First | 87.76 ± 21.21 | |
| Second | 109.21 ± 15.72 | |
| Third | 90.29 ± 24.89 | |
| Fourth | 99.5 ± 31.25 | |
| Fifth and above | 108 ± 18.18 | |
| Specialty | 0.134 | |
| General pediatric | 97.15 ± 22.87 | |
| PICU | 119.67 ± 4.62 | |
| NICU | 92.75 ± 7.63 | |
| Cardiology | 119.33 ± 9.61 | |
| Gastroenterology | 117 ± 32.53 | |
| Type of training | 0.405 | |
| Complete | 98.5 ± 22.97 | |
| Joint | 105.22 ± 18.57 |
Abbreviations: PICU, pediatric intensive care unit; NICU, neonatal intensive care unit.
a P-value < 0.05 was considered statistically significant.
Similar trends were also observed in the 3 individual subdomains (Table 4).
Table 4.Factors Associated with Post-graduate Hospital Educational Environment Measure Subscales
| Parameters and Categories | Perceptions of Role Autonomy | Perceptions of Teaching | Perceptions of Social Support | |||
|---|---|---|---|---|---|---|
| Mean ± SD | P-Value | Mean ± SD | P-Value | Mean ± SD | P-Value | |
| Gender | 0.146 | 0.385 | 0.266 | |||
| Male | 22.83 ± 6.68 | 26.28 ± 6.94 | 22.08 ± 6.84 | |||
| Female | 24.96 ± 5.51 | 27.5 ± 4.82 | 23.64 ± 4.82 | |||
| Age (y) | 0.087 | 0.036 a | 0.029 a | |||
| ≤ 27 | 22.91 ± 6.56 | 25.66 ± 6.11 | 21.61 ± 5.86 | |||
| > 27 | 25.4 ± 5.26 | 28.56 ± 5.11 | 24.6 ± 5.36 | |||
| Marital status | 0.054 | 0.118 | 0.247 | |||
| Single | 22.5 ± 7.0 | 25.77 ± 6.27 | 22.07 ± 6.65 | |||
| Married | 25.29 ± 4.99 | 27.95 ± 5.32 | 23.68 ± 4.96 | |||
| Post-graduate year | 0.024 a | 0.021 a | 0.004 a | |||
| First | 21.34 ± 5.72 | 24.12 ± 6.04 | 19.73 ± 4.83 | |||
| Second | 26.37 ± 4.76 | 29.61 ± 4.46 | 25.34 ± 4.22 | |||
| Third | 21.48 ± 6.66 | 25.19 ± 6.36 | 20.39 ± 6.27 | |||
| Fourth | 24.29 ± 8.5 | 26.11 ± 7.38 | 23.94 ± 8.16 | |||
| Fifth and above | 26.43 ± 4.9 | 28.47 ± 4.24 | 25.73 ± 5.16 | |||
| Specialty | 0.106 | 0.217 | 0.17 | |||
| General pediatric | 23.4 ± 6.17 | 26.52 ± 6.04 | 22.37 ± 5.86 | |||
| PICU | 30.48 ± 2.18 | 31.78 ± 1.54 | 26.67 ± 1.05 | |||
| NICU | 22.5 ± 0.71 | 24.67 ± 1.22 | 22.05 ± 4.6 | |||
| Cardiology | 29.76 ± 2.51 | 30.44 ± 1.68 | 29.09 ± 3.28 | |||
| Gastroenterology | 27.5 ± 9.6 | 32.33 ± 7.07 | 27.27 ± 7.71 | |||
| Type of training | 0.316 | 0.546 | 0.447 | |||
| Complete | 23.76 ± 6.15 | 26.81 ± 6.11 | 22.76 ± 5.84 | |||
| Joint | 25.95 ± 5.7 | 28.07 ± 3.34 | 24.34 ± 5.6 | |||
Abbreviations: PICU, pediatric intensive care unit; NICU, neonatal intensive care unit.
a P-value < 0.05 was considered statistically significant.
4.4. Interaction Effects Between the 3 Post-graduate Hospital Educational Environment Measure Subscales in Association with the Demographic and Academic Factors
The effects of demographic and academic factors on the interaction between the 3 PHEEM subscales were analyzed using one-way MANOVA and are presented in Appendix 4. For gender, age, type of training, and specialty, the assumption of equality of covariance matrices was confirmed, with P values indicating the appropriateness of proceeding with MANOVA. However, marital status and post-graduate year factors showed unequal covariance matrices, leading to the rejection of equality and rendering the MANOVA results invalid for these factors.
Specifically, for gender, age, and type of training, MANOVA results were not significant, with P values of 0.088, 0.159, and 0.134, respectively, suggesting no significant multivariate effects on the PHEEM subscales. Specialty was the only factor with a significant MANOVA result (P = 0.011), indicating a multivariate effect on the PHEEM subscales. Subsequent univariate F-tests showed that the effect of specialty was significant only on PHEEM 2 (P = 0.025), with post hoc analysis using LSD revealing specific differences between PICU vs general pediatrics (P = 0.010), PICU vs NICU (P = 0.008), and NICU vs pediatric cardiology (P = 0.003). For PHEEM 3, a significant difference was observed only between PICU and general pediatrics (P = 0.024). There were no significant effects of demographic or academic factors on PHEEM 1.
Regarding effect sizes, the partial Eta squared values indicated a small to medium effect for specialty on the PHEEM subscales. No other significant effects or differences were observed across the demographic and academic factors on the PHEEM subscales, suggesting a limited impact of these factors on the perceived educational environment.
5. Discussion
Post-graduate medical professionals must participate in clinical training to acquire the necessary skills and expertise. Among its core values, KAUH's educational environment emphasizes meaningfulness and collaboration and promotes a motivating environment. However, HEEs that fail to meet these expectations expose their trainees to challenging conditions, leading to high pressure and stress levels (27). The present study showed some positive aspects of the training program but also revealed various sections for improvement in pediatric HEE, as expressed by post-graduate trainees. Comparatively, a negative perception of the learning environment was higher in the first-year residents, who scored 11 points less in PHEEM than trainees from the senior group. Overall, the PHEEM scale performance was appreciable in this study, and the PCA proposed a 3-dimensional construct with the first component being predominant, encompassing 17 PHEEM items and a scale variance of 38.04%.
5.1. Assessing the Clinical Learning Environment
Based on the findings of the closed items, the HEE of the examined setting was more positive but required improvement in several areas. In the present study, PHEEM scores corroborate with those reported in the literature. The overall PHEEM score (99.35 ± 22.46) was similar to that reported by BuAli et al. (100.19 ± 23.13), involving the pediatric population from 5 teaching hospitals in the western region of Saudi Arabia (23). Moreover, other local studies used PHEEM questionnaires to explore post-graduate residents from other specialties. The PHEEM score of 82.63 out of 160 reported by Al-Marshad and Alotaibi among all-specialty residents in a university hospital in Dammam, eastern Saudi Arabia, and by Khoja (M ± SD = 67.1 ± 20.1) among 101 Saudi Board Program family medicine residents, which were significantly lower than the present study (19, 20). Al Helal and Al Turki described an overall PHEEM score (86.7 ± 19.5) in a sample of 140 training family medicine residents from 4 educational hospitals in Riyadh City, with the lowest perceptions observed in the teaching domain (28). On the contrary, the PHEEM score in our study was in accordance with those reported by Alhussain et al. (98.21 ± 18.3) among urology residents training in military hospitals but higher than those reported by Binsaleh et al. (77.7 ± 16.5) in another study (21, 22). However, the perception scores in the 3 inventory domains reported by Alhussain et al. contradict our present findings.
Internationally, a Greek study involving 731 training residents from 33 specialties in 83 hospitals found a mean PHEEM score of 65.76 out of 160, which correlated well with the global satisfaction score of 39.3%. Also, the perception score for social support was the highest (43.6%) (26). Another study from Argentina observed an overall PHEEM score of 106.8 ± 13.98 in 92 trainees, with 29 from the pediatrics department. Interestingly, researchers also correlated the PHEEM with burnout level, using the Maslach Burnout Inventory, and found a negative correlation of overall PHEEM score with exhaustion and depersonalization dimensions of the Maslach Burnout Inventory and a positive correlation with personal accomplishment dimension. However, these relationships were significantly stronger with the autonomy dimension of PHEEM (29). Other reports of PHEEM scores from a study conducted in the United Kingdom, Morocco, and Iran also highlight the regional disparity in perception of the clinical learning environment (25, 30, 31). However, whether the PHEEM tool enables reliable international and cross-cultural comparability is unclear; hence, comparing the scores should be interpreted cautiously outside a given setting.
These aforementioned cross-study comparisons of clinical learning environments necessitate cautious interpretation. The positive assessment of the HEE observed in our study aligns with certain regional findings while differing significantly from others, highlighting regional and specialty-based disparities. Notably, lower PHEEM scores in studies across various Saudi specialties and notably lower scores in international contexts indicate the potential influence of educational, hospital, and regional factors on trainee perceptions. More particularly, some specialties may be more sensitive to the HEE, directly influencing trainees’ perceptions and satisfaction. This sensitivity could stem from varying expectations, workload, or the nature of the specialty itself, necessitating a tailored approach to educational strategies to enhance overall satisfaction and learning outcomes. Further, it highlights the need to carefully consider contextual factors when interpreting PHEEM scores, as the tool's reliability for international and cross-cultural comparison remains uncertain.
5.2. Perception of Learning Environment Across Gender, Post-graduate Year, and Regions in Saudi Arabia
In the present study, PHEEM scores varied remarkably among fellow trainees from various post-graduate years, with the lowest score observed in first-year residents. This observation may suggest that the resident's adaptation to social and organizational aspects was initially perceived as unfavorable. However, no significant difference across genders was found in any of the domains. Contrarily, BuAli et al. and Al-Marshad and Alotaibi did not find any significant correlation between the academic year and PHEEM scores (19, 23). Also, Al-Marshad and Alotaibi found significantly higher scores among males (mean = 88.72) than females (mean = 77.14) in all 3 domains (19).
Interestingly, observations from a study by Khoja were consistent with our findings, where R4 family medicine residents scored 12 points higher than their younger peers in the role of autonomy and social support domains (20). Similar findings were reported by Alhussain et al., where R4-R5 urology residents scored higher than R1-R3 ones. They also observed significant differences between Saudi provinces, where the highest scores were observed in the Eastern region (22). However, Al Hilal and Al Turki did not analyze factors associated with PHEEM. This high heterogeneity between areas of Saudi Arabia suggests variability in clinical learning opportunities between specialties, centers, and regions. However, similar to the variability observed in international research findings, these differences should be interpreted cautiously until further data is presented.
5.3. Validity of the Post-graduate Hospital Educational Environment Measure Inventory
There is great debate concerning the validity of the PHEEM questionnaire. In particular, the construct validity and the aptitude of the inventory to discriminate the 3 dimensions (ie, teaching, role autonomy, and social support). According to the PCA from the present study, which used a high threshold for component loading (0.5), we can relatively accept that the PHEEM is a 3-dimensional scale. However, the item distribution across the original dimensions was inconsistent and disparate, and the first component was remarkably predominant, comprising 17 out of 35 loading items, accounting for 38% of the variance. Additionally, an item overlapped between components 1 and 2. Interestingly, Berrani et al. found similar results, including a 3- or 4-dimensional construct, with a predominant component having 30% variance and encompassing 17 items (31). Both findings are in agreement, suggesting that the PHEEM construct should be revised to adapt to a particular population's cultural characteristics, which may affect the understanding and interpretation of the items. This is supported by the lower correlations between the 3 component scores that were found in the PCA, suggesting relative inter-dependency between the PCA-based construct compared to the original one. Furthermore, a deeper analysis of the findings from the PCA in the present study suggests that the majority of items loading in component 1 may be interpreted under a broad dimension encompassing the quality of the relationship and interaction/communication of the trainees with their clinical teachers and senior doctors. Another aspect of the validity of this construct is the poor interaction between the 3 PHEEM subscales in association across the different demographic and academic factors. This denotes the lack of internal consistency between the 3 subscales, which further limits the validity of considering the overall PHEEM score in a comparative approach.
In summary, the observed inconsistencies in the PHEEM’s construct validity necessitate a critical reassessment of its application to this particular population. The predominant first component and disparities in item distribution challenge the reliability of the PHEEM, potentially leading to skewed interpretations of the educational environment. Moreover, this raises questions about the tool's effectiveness in capturing the nuanced aspects of the hospital training setting, emphasizing the need for cultural and contextual adaptations to enhance its accuracy and relevance. Addressing these validity concerns is crucial, not just for methodological integrity, but to ensure that any derived interventions genuinely reflect trainees’ experiences and contribute to meaningful improvements in the educational climate.
5.4. Implications and Limitations of the Findings
Based on the present study, the educators and trainers of the hospital learning environment should specifically consider the length and number of on-calls as it promotes incompatible learning opportunities and directly impacts the social, physical, and psychological well-being of the residents. Another consideration was the burden of non-clinical tasks, including paperwork and administrative duties, assigned to the trainees, which constituted barriers to managing time to learn with senior doctors. We recommend that the educators consider improving organization and communication to enhance the effectiveness of the HEE and, consequently, resident trainees’ engagement in the learning process. The small sample size in the current study could potentially impact the reliability and validity of the PCA results, considering the suggested participant-to-construct parameter ratio of 10: 1 (32). This issue may be exacerbated by a substantial risk of selection bias, given that participation in the study was voluntary and could attract trainees with particularly strong opinions, potentially leading to skewed evaluations. Another limitation of the psychometric evaluation of the PHEEM tool is the lack of test-retest analysis, which impedes the assessment of the tool's stability and consistency over time. Future studies should incorporate test-retest procedures to evaluate and ensure the tool's reliability longitudinally in the studied population.
5.5. Conclusions
Overall, the HEE examined in the present study was found to be broadly suitable for pediatric training. However, areas impacting the learning time with the clinical teacher, work conditions, and organizational efficiency required further improvements. Furthermore, necessary consideration is required for the social and psychological well-being of the trainees. Trainees needed extended support and consultation regarding their daily concerns and a deeper understanding of their working rights. The PHEEM questionnaire is a reliable tool for the current pediatrics setting; however, further research is required to assess the construct validity of the local population at a large scale.