


1. Background
2. Objectives
3. Methods
3.1. Study Population and Definitions
3.2. Sample Size Calculation
3.3. Ethical Approval
3.4. Laboratory and Clinical Assessments
3.5. Ultrasonographic Evaluation of Thyroid Gland
3.6. Statistical Analysis
4. Results
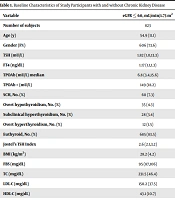
| Variables | Total (n = 98) | Cases with GD (n = 35) | Cases with HT (n = 29) | Healthy controls (n = 34) | P-Value |
|---|---|---|---|---|---|
| Age (y) | 15.00 (12.40 - 16.20) | 15.50 (13.80 - 16.10) | 15.00 (12.60 - 16.80) | 14.10 (11.80 - 15.80) | 0.176b |
| Male/Female | 26/72 (26.5/73.5) | 11/24 (31.4/68.6) | 5/24 (17.2/82.8) | 10/24 (29.4/70.6) | 0.395c |
| Prepuberty/Puberty | 10/88 (10.2/89.8) | 3/32 (9.4/90.6) | 1/28 (3.6/96.4) | 6/28 (21.4/78.6) | 0.195d |
| Weight SDS | 0.17 ± 1.24 | 0.05 ± 1.21 | 0.27 ± 1.40 | 0.24 ± 1.16 | 0.740e |
| Height SDS | -0.08 ± 1.12 | -0.13 ± 1.04 | -0.19 ± 1.24 | 0.05 ± 1.12 | 0.693e |
| BMI SDS | 0.31 ± 1.30 | 0.09 ± 1.33 | 0.46 ± 1.22 | 0.42 ± 1.35 | 0.473e |
| Age at the time of diagnosis (y) | 13.9 (10.4 - 15.4) | 10.4 (8.0 - 12.0) | 0.003f | ||
| Duration of GD or HT (mo) | 12.0 (6.0 - 36.0) | 48.0 (27.8 - 66.3) | < 0.001f | ||
| Methimazole dose per kg (mg/kg/day) | 0.18 (0.10 - 0.3) | ||||
| Duration of methimazole treatment (mo) | 12.0 (6.0 - 36.0) | ||||
| Levothyroxine dose per kg (µg/kg/day) | 1.05 (0.74 - 2.00) | ||||
| Thyroid volume SDSb | 3.50 (2.36 - 8.34) | 1.26 (0.34 - 3.35) | 0.016f | ||
| TSH (μIU/mL; reference range: 0.27 - 4.2) | 1.79 (0.70 - 2.92) | 0.050 (0.01 - 1.74) | 2.60 (1.67 - 3.89) | 2.04 (1.39 - 2.49) | < 0.001b < 0.001 GD vs. HTg < 0.001 GD vs. HCg |
| FT4 (ng/dL; reference range: 0.93 - 1.70) | 1.28 (1.14 - 1.49) | 1.49 (1.21 - 2.13) | 1.29 (1.17 - 1.47) | 1.20 (1.10 - 1.30) | < 0.001b 0.001 GD vs. HCg |
| FT3 (pg/mL; reference range: 2.56 - 5.01) | 4.61 (3.68 - 6.54) | ||||
| TPO-Ab (IU/mL; reference range: 0 - 34) | 57.00 (9.00 - 217.00) | 171.00 (102.50 - 285.30) | 207.50 (114.00 - 377.00) | 9.00 (9.00 - 11.10) | < 0.001b < 0.001 GD vs. HCg < 0.001 HT vs. HCg |
| TG-Ab (IU/mL; reference range: 0 - 115) | 45.00 (14.80 - 291.00) | 145.00 (34.40 - 346.50) | 289.00 (142.50 - 483.00) | 14.75 (13.80 - 17.30) | < 0.001b < 0.001 GD vs. HCg < 0.001 HT vs. HCg |
| TRab (U/mL; reference range: 0 - 1.5) | 3.99 (1.39 - 9.70) | ||||
| Urea (mg/dL) | 16.00 (11.00 - 21.00) | 19.00 (15.00 - 23.00) | 19.00 (18.00 - 23.00) | 10.00 (8.30 - 12.80) | < 0.001b < 0.001 GD vs. HCg < 0.001 HT vs.HCg |
| Creatinine (mg/dL) | 0.59 ± 0.13 | 0.56 ± 0.13 | 0.58 ± 0.13 | 0.62 ± 0.13 | 0.238e |
| eGFR (mL/min/1.73 m2) | 148.00 (134.00 - 164.00) | 151.00 (139.00 - 166.00) | 151.00 (144.00 - 178.00) | 146.00 (129.00 - 160.00) | 0.160e |
| Spot urine microalbumin (mg/dL) | 0.95 (0.43 - 2.34) | 0.92 (0.45 - 1.50) | 0.71 (0.39 - 2.52) | 1.70 (0.63 - 3.00) | 0.179b |
| Spot urine creatinine (mg/dL) | 148.80 (90.30 - 201.40) | 117.50 (71.00 - 192.00) | 123.90 (82.10 - 183.30) | 176.10 (142.20 - 237.90) | 0.010b 0.022 GD vs. HCg 0.032 HT vs. HCg |
| UACR (mg/g; microalbuminuria range: 30 - 300) | 7.06 (4.39 - 12.66) | 7.36 (5.45 - 12.54) | 6.66 (3.96 - 22.59) | 7.79 (4.50 - 11.77) | 0.779b |
| Number of microalbuminuric cases | 7 (7.1) | 1 (2.9) | 5 (17.2) | 1 (2.9) | 0.042c |
Abbreviations: GD, Graves’ disease; HT, Hashimoto’s thyroiditis; SDS, standard deviation score; BMI, Body Mass Index; TSH, thyroid-stimulating hormone; FT4, free thyroxine; FT3, free triiodothyronine; TPO-Ab, thyroid peroxidase antibody; TG-Ab, thyroglobulin antibody; TRAb, thyroid-stimulating hormone receptor antibody; eGFR, estimated glomerular filtration rate; UACR, urinary albumin-to-creatinine ratio.
a Values are expressed as No. (%), mean ± SD or median (25th - 75th percentile).
b Kruskal-Wallis test.
c Chi-square test.
d Fisher exact test.
e One-way ANOVA test.
f Mann-Whitney U test.
g Dwass-Steel-Critchlow-Fligner test.
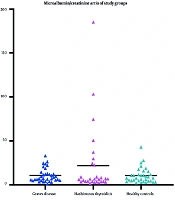
 levels among children and adolescents with Hashimoto’s thyroiditis (HT), Graves’ disease (GD), and healthy controls. UACR: urinary albumin-to-creatinine ratio (mg/g). Microalbuminuria was defined as UACR ≥ 30 mg/g (corresponding to 30 - 300 mg/g).")
Comparison of urinary albumin-to-creatinine ratio (UACR) levels among children and adolescents with Hashimoto’s thyroiditis (HT), Graves’ disease (GD), and healthy controls. UACR: urinary albumin-to-creatinine ratio (mg/g). Microalbuminuria was defined as UACR ≥ 30 mg/g (corresponding to 30 - 300 mg/g).
| Variables | UACR (mg/g) | |
|---|---|---|
| P-Value | r (Spearman’s rho) | |
| Age (years) | 0.903 | 0.012 |
| Duration of GD or HT | 0.378 | -0.116 |
| TSH (μIU/mL) | 0.157 | -0.144 |
| FT4 (ng/dL) | 0.084 | 0.175 |
| FT3 (pg/mL) | 0.725 | 0.063 |
| TPO-Ab (IU/mL) | 0.336 | 0.104 |
| TG-Ab (IU/mL) | 0.664 | 0.047 |
| TRab (U/mL) | 0.336 | -0.182 |
| Urea (mg/dL) | 0.904 | 0.013 |
| Creatinine (mg/dL) | 0.400 | -0.089 |
| eGFR (mL/min/1.73 m2) | 0.585 | 0.059 |
Abbreviations: GD, Graves’ disease; HT, Hashimoto’s thyroiditis; TSH, thyroid-stimulating hormone; FT4, free thyroxine; FT3, free triiodothyronine; TPO-Ab, thyroid peroxidase antibody; TG-Ab, thyroglobulin antibody; TRAb, thyroid-stimulating hormone receptor antibody; eGFR, estimated glomerular filtration rate; UACR, urinary albumin-to-creatinine ratio.
a Correlation coefficients are presented as Spearman’s rho (r).