1. Background
Peripherally inserted central catheters (PICCs) have become an indispensable form of vascular access for pediatric patients, particularly those in neonatal care, hematology/oncology, and those requiring long-term parenteral nutrition. However, because pediatric patients have delicate vasculature, limited cooperation, and an increased risk of complications, PICC placement in this population presents a dual challenge: achieving a high puncture success rate while maintaining a low complication rate (1).
Under the traditional decentralized, part-time management model, problems such as variable puncture success rates, high complication rates, and the slow development of a specialized nursing workforce have become prominent. In accordance with the Operating Standard for Intravenous Therapy Nursing Technology (WS/T 433 - 2023) and the Pediatric Intravenous Therapy Guidelines (2, 3), and in response to challenges including the dispersion of resources across multiple hospital districts and low homogeneity of technical expertise, the Nursing Department of our hospital adopted a problem-oriented approach to nursing management reform. This reform aimed to establish a pediatric intravenous therapy specialist team. By establishing a dedicated, standardized, and refined pediatric intravenous therapy specialist team, integrating high-quality resources, and unifying technical standards, we sought to improve the overall quality and safety of pediatric intravenous therapy. This study systematically summarizes the experience and practical outcomes of developing this team over the past 5 years, thereby providing a replicable and scalable model for similar health care institutions.
2. Objectives
This study aimed to systematically describe the 5-year experience of developing a dedicated pediatric intravenous therapy team and to report observed changes in service volume, technical quality, complication patterns, and regional influence. Given the nonrandomized, single-center design, the findings should be interpreted as service-level improvements associated with the intervention rather than as evidence of causal effectiveness.
3. Methods
3.1. Team Establishment and Management Strategies
3.1.1. Team Formation and Structure
Under unified planning by the hospital nursing department, a "pilot-expansion" strategy was adopted (4). In 2019, 1 intravenous therapy specialist nurse was initially selected to conduct a 6-month pilot program focused exclusively on PICC placement. During the pilot phase, the selected nurse, who held intravenous therapy specialist qualifications, was solely responsible for PICC insertion in 5 hematology/oncology wards. A 6-month practice evaluation was conducted to assess the feasibility and effectiveness of this model. Pilot data showed that the dedicated placement model significantly improved the catheter insertion success rate from 85.2% to 96.5% and reduced the incidence of catheter-related complications, with mechanical phlebitis decreasing from 8.3% to 2.1%. After confirming that this model improved insertion success rates and reduced complications, the team was formally established and expanded to 4 members in 2020. The team adopted a "1+3" structure, comprising 1 team leader responsible for quality coordination across 3 hospital districts, performance management, and external collaboration (5, 6), and 3 core members, all of whom were senior nurses with provincial-level intravenous therapy specialist qualifications and certification in ultrasound-guided puncture. The mean work experience of the core members was 11.5 years.
3.1.2. Eligibility Criteria and Training Mechanism
Quantitative eligibility criteria were established as follows: 1) at least 5 years of pediatric nursing experience, a provincial-level or higher intravenous therapy specialist nurse certificate, and certification in ultrasound-guided vascular access; 2) independent completion of at least 40 pediatric PICC placements; 3) passing theoretical (≥ 90 points) and practical (≥ 95 points) assessments; and 4) passing a specialized evaluation of communication skills with pediatric patients, obtaining a training certificate in pain assessment and intervention, and having no record of major adverse nursing events. A routine training mechanism was implemented, consisting of monthly case discussions on complications and quarterly assessments of ultrasound-guided simulated puncture and emergency response capabilities. Using these quantitative indicators, team members were selected to ensure that each possessed a systematic knowledge base in pediatric intravenous therapy, proficient technical skills in PICC placement, standardized capabilities for executing complication management procedures, and adequate psychological intervention skills for pediatric patients (7).
3.1.3. Role Responsibilities and Workflows
The core responsibilities of the team encompassed quality management and technical support throughout the entire intravenous therapy process (8). These responsibilities included: 1) assuming full responsibility for pediatric PICC/CVC placement across the 3 hospital districts, providing 24-hour emergency consultation for difficult vascular access, and ensuring a consultation response time of within 30 minutes; 2) routinely operating a PICC specialist nursing clinic for 5 half-days per week and strictly adhering to standardized assessment and maintenance procedures to ensure outpatient nursing quality; 3) undertaking quality management of intravenous therapy nursing across the 3 hospital districts, organizing hospital-wide intravenous therapy quality inspections quarterly, systematically analyzing inspection results, and proposing corrective measures to promote continuous quality improvement; 4) managing consultations for intravenous therapy-related complications across the 3 hospital districts and providing professional technical guidance and solutions; and 5) providing technical consultation support to primary health care facilities, training visiting nurses, and delivering theoretical and skills training in intravenous therapy to junior nursing staff within our hospital, thereby promoting the homogenized development of regional intravenous therapy. All procedures were strictly performed in accordance with the Operating Standard for Intravenous Therapy Nursing Technology.
3.1.4. Performance-Based Incentive System
A performance evaluation system oriented toward both clinical value and quality safety was established. Based on the hospital's actual operational costs and benefit structure, this system integrated core workload indicators with quality indicators, encompassing the following dimensions: number of outpatient maintenance procedures, reflecting baseline service volume and cost coverage; number of PICC insertions, representing core technical output; number of difficult-access consultations, indicating technical value in resolving complex cases; and complication rate, a key quality and safety indicator. The evaluation results were directly linked to individual performance-based remuneration and professional title promotion mechanisms, thereby rewarding higher performance with greater compensation and effectively motivating team members' work engagement and sense of professional value (9).
3.2. Data Sources and Collection Procedures
All data were extracted retrospectively from the hospital's electronic medical record system and the intravenous therapy information management system developed by the team. The following variables were collected for each patient encounter: date of service, patient age and diagnosis, type of vascular access device, procedure type (insertion, maintenance, consultation), operator identity (team member or nonteam member), and occurrence of complications. Data entry was performed by bedside nurses or team members at the time of service. No changes were made to the documentation system or case definition during the 5-year study period from 2019 to 2024. For the satisfaction survey, a random 20% sample of outpatient visits was selected monthly using a computer-generated random sequence, and surveys were administered by a dedicated nurse not involved in direct care.
3.3. Outcome Denominators
Puncture success rate was calculated as the number of successful ultrasound-guided PICC insertions divided by the total number of attempted PICC insertions by the team during the same period, expressed as a percentage.
Catheter-related infection rate was defined as the number of catheter-related bloodstream infections per 1000 catheter-days. Denominator data (catheter-days) were obtained from the daily maintenance log of the outpatient clinic.
Complication consultations were counted per event. If the same patient experienced multiple complication episodes in the same year, each episode was counted separately.
Satisfaction rate was defined as the proportion of respondents (parents or pediatric patients old enough to respond) who rated the service as "satisfied" or "very satisfied" on a 5-point Likert scale, among the randomly sampled 20% of monthly outpatient visits.
Regional influence was operationalized as 1) the number of consultation requests from external hospitals and 2) the number of visiting nurses who completed systematic training at our center.
No missing data were identified for the primary outcome variables, including insertion volume, maintenance volume, complication events, and satisfaction survey responses, because these variables were mandatory fields in the electronic documentation system. For the satisfaction survey, the monthly response rate exceeded 95% because of routine collection at the point of care.
3.4. Statistical Analysis
Continuous outcomes, such as service volume, are reported as absolute numbers and compound annual growth rates (CAGR) for descriptive purposes. No inferential testing was applied to these secular trends because the study lacked a concurrent control group. For complication distributions across years, the chi-square test was used for overall comparisons, followed by Bonferroni correction for pairwise comparisons when the overall P value was < 0.05. This approach was chosen to identify specific complication types whose proportional composition changed significantly over time. All other outcomes, including satisfaction, success rates, and infection rates, are reported descriptively without formal hypothesis testing because they represent complete enumeration of all eligible procedures during the study period.
4. Results
4.1. Service Volume and Efficiency
The core service volume of the intravenous therapy center entered a phase of stable optimization after a period of rapid growth. Total outpatient maintenance volume increased from 1551 cases in 2019 to 9781 cases in 2024, with a CAGR of 44.5% (Table 1). The growth pattern showed distinct characteristics: PICC maintenance emerged as the primary driver, with a CAGR of 62.2%, whereas implantable venous access port (port) maintenance volume declined consistently from 2021 onward, with a CAGR of only 13.4%. This structural shift highlights a clinical preference for PICC-dominant intravenous therapy regimens. This trend is largely attributable to the unique characteristics of the pediatric population. Unlike adults, children are in a stage of growth and development, and factors such as vascular condition, changes in body habitus, and long-term catheter safety make PICC a more suitable and convenient option, gradually replacing ports as the mainstream choice. Concurrently, the center’s expertise in catheter placement expanded progressively. Since 2022, the team has successively initiated CVC and midline catheter placement services, completing 265 and 93 cases, respectively, in 2024, indicating the establishment of a comprehensive solution system covering all types of vascular access devices to better meet the diverse clinical needs of pediatric care.
Table 1.
Changes in Key Indicators Before and After Team Establishment (2019 - 2024) a
| Indicator | 2019 (Baseline) | 2020 (%) | 2021 (%) | 2022 (%) | 2023 (%) | 2024 (%) | CAGR (%) |
|---|---|---|---|---|---|---|---|
| Total outpatient maintenance volume | 1551 | 283.7 | 31.7 | 29.6 | -0.2 | -3.5 | 44.5 |
| PICC outpatient maintenance volume | 736 | 284.5 | 75.8 | 60.4 | 8.0 | -4.2 | 62.2 |
| Port (implantable venous access port) outpatient maintenance volume | 815 | 283.0 | -8.3 | -23.9 | -30.3 | 0.7 | 13.4 |
| PICC insertion volume | 158 | 442.4 | 55.0 | 8.0 | 9.4 | 1.5 | 58.7 |
| CVC insertion volume | 0 | - | - | 158.3 | 100.0 | 113.7 | - |
| Midline catheter insertion volume | 0 | - | - | - | - | 89.8 | - |
| Difficult peripheral access insertion volume | 1 | - | 2600 | 44.4 | 243.6 | 111.9 | 209.5 |
| Number of service departments | 18 | 33.3 | 12.5 | -7.4 | 8.0 | 11.1 | 10.8 |
| Difficult access consultations from external hospitals | 0 | - | -9.5 | -26.3 | -64.3 | 80.0 | - |
| Complication consultations | 3 | 733.3 | 144.0 | -39.3 | -43.2 | 47.6 | 59.5 |
| Number of visiting nurses trained | 0 | - | - | -50.0 | -50.0 | 100.0 | - |
a Percentage changes are calculated compared with the previous year. The compound annual growth rate (CAGR) is calculated as [(final value / initial value) (1/number of years)- 1] × 100%. Percentages in parentheses represent year-over-year change compared with the previous year. Shaded cells indicate services not yet offered in that year.
4.2. Core Technical Competence and Regional Influence
Our center has continuously pursued technical innovation and has gradually evolved into a regional hub for resolving complex clinical problems. The ultrasound-guided peripheral venipuncture technique was introduced and promoted. The volume of difficult peripheral access procedures increased dramatically from a single-digit number in 2019 to 284 cases in 2024, with a CAGR of 209.5%. This rapid growth directly reflects the high proficiency of the nursing team and its broad recognition within the hospital. The team played a pivotal role in multidistrict collaboration, with the number of clinical departments served expanding from 18 to 30. The capacity for external technical output was also enhanced: in 2024, the volume of consultations from external hospitals rebounded by 80.0% year-over-year, and the team provided systematic training to 18 visiting nurses, achieving a functional shift from "clinical service" to "technical outreach" (10).
4.3. Quality Control Outcomes
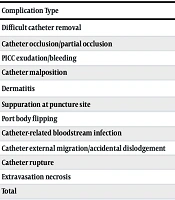
Complication management data serve as a key indicator of health care quality (11). To analyze differences in the distribution of complications across years, a chi-square test was first used for an overall comparison. For complication types showing statistically significant differences (P < 0.05), the Bonferroni method was further applied for multiple-comparison correction to control the increased risk of type I error due to multiple comparisons. The corrected significance level was set at α' = 0.05 / number of comparisons. Superscript letters (eg, a, b) in Table 2 indicate statistically significant differences compared with a specific year after Bonferroni correction (P < 0.05). Statistical analysis showed that the total number of complication consultations peaked in 2021 (61 cases) and then decreased continuously, reaching 17 cases by 2024, reflecting the overall effectiveness of preventive measures and intervention strategies.
Table 2.
Comparison of Complication Distribution Across Different Years a
| Complication Type | 2019 | 2020 | 2021 | 2022 | 2023 | 2024 | χ2 | P-Value |
|---|---|---|---|---|---|---|---|---|
| Difficult catheter removal | 2 (66.7) | 0 (0.0) b | 4 (6.6) b | 2 (5.4) b | 1 (4.8) b | 1 (5.9) | 21.150 | 0.001 |
| Catheter occlusion/partial occlusion | 1 (33.3) | 3 (11.5) | 17 (27.9) | 5 (13.5) | 2 (9.5) | 00 (0.0) | 10.872 | 0.054 |
| PICC exudation/bleeding | 00 (0.0) | 1 (3.8) | 6 (9.8) | 4 (10.8) | 5 (23.8) | 6 (35.3) | 12.426 | 0.029 |
| Catheter malposition | 00 (0.0) | 7 (26.9) | 5 (8.2) | 2 (5.4) | 0 (0.0) | 1 (5.9) | 13.283 | 0.021 |
| Dermatitis | 00 (0.0) | 13 (50.0) | 16 (26.2) | 21 (56.8) c | 11 (52.4) | 7 (41.2) | 13.355 | 0.020 |
| Suppuration at puncture site | 00 (0.0) | 2 (7.7) | 4 (6.6) | 00 (0.0) | 00 (0.0) | 1 (5.9) | 4.381 | 0.496 |
| Port body flipping | 00 (0.0) | 00 (0.0) | 1 (1.6) | 00 (0.0) | 00 (0.0) | 00 (0.0) | 1.715 | 0.887 |
| Catheter-related bloodstream infection | 00 (0.0) | 00 (0.0) | 2 (3.3) | 1 (2.7) | 00 (0.0) | 00 (0.0) | 2.132 | 0.831 |
| Catheter external migration/accidental dislodgement | 00 (0.0) | 00 (0.0) | 5 (8.3) | 1 (2.7) | 00 (0.0) | 1 (5.9) | 4.986 | 0.418 |
| Catheter rupture | 00 (0.0) | 00 (0.0) | 1 (1.6) | 00 (0.0) | 00 (0.0) | 00 (0.0) | 1.715 | 0.887 |
| Extravasation necrosis | 00 (0.0) | 00 (0.0) | 00 (0.0) | 1 (2.7) | 2 (9.5) | 00 (0.0) | 9.129 | 0.104 |
| Total | 3 | 26 | 61 | 37 | 21 | 17 |
a Values are expressed as No. (%). (α' = 0.05 / number of pairwise tests).
b Compared with 2019, P < 0.05.
c Compared with 2021, P < 0.05.
Cross-year analysis revealed that the proportions of 4 complication types--difficult catheter removal (P = 0.001), PICC exudation/bleeding (P = 0.029), catheter malposition (P = 0.021), and dermatitis (P = 0.020)--varied significantly across years, suggesting temporal dynamics in their influencing factors or interventions (Table 2). Dermatitis consistently represented a high-incidence complication, particularly in 2020, 2022, and 2023, when its proportion exceeded 50% each year, highlighting that skin management remains a priority in routine prevention. Notably, the proportion of PICC exudation/bleeding showed a continuous upward trend, increasing from 0% in 2019 to 35.3% in 2024, making it the predominant complication type at present. This finding indicates a need to further optimize catheter insertion techniques, fixation methods, and early intervention strategies. Catheter malposition accounted for a relatively high proportion in 2020 (26.9%) but declined significantly thereafter and remained low, reflecting the substantial benefits of precision insertion techniques such as ultrasound guidance. Difficult catheter removal had a high proportion in 2019 (66.7%), but because of the very small baseline number, this finding has limited reference value; the persistently low incidence in subsequent years suggests that procedures have become standardized.
Among complication types without statistically significant differences in distribution (P > 0.05), the incidence of catheter occlusion/partial occlusion decreased from 27.9% in 2021 to 0 in 2024, indicating the clear effectiveness of standardized flushing and locking protocols and patient education. Other complications, such as port body flipping and catheter rupture, consistently remained at very low levels, confirming the effectiveness of existing preventive measures. Regarding the overall trend in complication numbers, after peaking in 2021 (61 cases), the total number of complications continued to decline, reaching only 17 cases by 2024, supporting the sustained improvement achieved by the whole-process quality management system.
In conclusion, the focus of intravenous therapy complication prevention and control in our hospital has undergone a stage-specific shift, from catheter malposition and occlusion predominating in the early period to PICC exudation/bleeding as the current core challenge. This evolution provides important guidance for adjusting the focus of future nursing research and clinical practice (12).
4.4. Patient Outcomes and Satisfaction
As of 2024, the team had provided services to a cumulative total of 36472 pediatric outpatients. Based on a continuous satisfaction survey conducted monthly with a random sample of 20% of the outpatient volume, the average satisfaction rate among pediatric patients and their parents with the intravenous therapy services was as high as 99.3%, reflecting strong family recognition of the team’s professional competence and service experience. Through systematic health education and the distribution of standardized home care manuals, parents’ knowledge and self-management skills regarding PICC and port maintenance were significantly improved, effectively reducing the risk of complications caused by nontechnical factors and enhancing family caregiving confidence. Furthermore, the satisfaction rate of inpatient ward staff with the specialist team’s technical support, emergency response, and multidisciplinary collaboration reached 99.8%, underscoring the important role of this model in promoting interprofessional collaboration and improving overall quality of care. Collectively, these findings indicate that the team not only provides technical services but also generates positive spillover effects in terms of family empowerment and intrahospital collaboration, thereby establishing a crucial humanistic and cooperative foundation for building a high-quality pediatric intravenous therapy service system (13).
4.5. Intangible Outcomes
In collaboration with the hospital’s information technology department, the team independently developed an information management system for intravenous therapy. This system established a whole-process database covering patient assessment, catheter placement procedures, maintenance records, and complication tracking, enabling real-time data collection, dynamic monitoring of quality indicators, and information-supported nursing decision-making, thereby providing a robust data foundation for intravenous therapy safety and quality improvement. Leveraging this information platform and extensive clinical practice, the team has achieved substantial research productivity. Since its establishment, the team has published a total of 10 academic papers covering topics such as technical optimization, complication prevention and control, and nursing management. The team has been awarded 2 municipal-level or higher research grants focusing on clinical and basic research on challenging issues in pediatric intravenous therapy. Additionally, 2 utility model patents have been granted, involving innovative designs for catheter fixation devices and nursing assistance instruments, demonstrating the team’s ability to translate clinical needs into applied innovations.
5. Discussion
The 5-year data from this single-center before-and-after observational study suggest that the specialist team management model, supported by centralized human resources, standardized protocols, and a refined division of labor, was associated with concurrent improvements in both efficiency and quality indicators.
5.1. Specialist Team Management as a Strategy for Improving Pediatric Intravenous Therapy Quality
Data from this 5-year practice demonstrate that the specialist team management model, supported by centralized human resources, standardized technical protocols, and a refined division of labor, achieved simultaneous improvements in efficiency and quality. This finding is consistent with the results reported by Ma et al. (14). The key to success lies in the top-level design of the management model, which integrates previously dispersed resources into a cohesive, efficient, and professional entity, aligning with the trend toward refined and specialized development in contemporary nursing management (15).
5.2. Dynamic Quality Indicators as the Core of Precision Management
This study not only focused on the incidence of complications but also analyzed dynamic changes in their internal composition, embodying the concept of precision management (16). Notably, the proportion of PICC exudation/bleeding at the puncture site increased continuously from 0% in 2019 to 35.3% in 2024 (P = 0.029), becoming the primary quality challenge and replacing traditional complications. This shift may be attributed to the following factors: 1) the anatomical and physiological characteristics of pediatric skin, because the stratum corneum in infants and young children consists of only 2 to 3 cell layers, compared with 10 to 20 layers in adults, and the immature barrier function makes stratum corneum peeling more likely during mechanical tearing in dressing changes, leading to exudation; 2) the influence of dressing selection, because the permeability and adhesiveness of different dressings directly affect the microenvironment of the puncture site; and 3) the fixation method and mechanical stability, because noncuffed PICCs rely on external fixation to maintain position, and micromovements of the catheter can repeatedly irritate the puncture site, resulting in tissue fluid exudation. The emergence of exudation/bleeding as a new challenge replacing traditional issues suggests that managers should promptly adjust training priorities and quality control directions, such as enhancing catheter fixation workshops and introducing novel dressings. This data-driven continuous quality improvement mechanism is central to modern nursing management (17, 18).
5.3. Scientific Performance-Based Incentive System as a Guarantee of Team Vitality
The performance evaluation system established in this study, incorporating multiple dimensions including quality, efficiency, and teaching, departed from the traditional piece-rate payment model. It guided team members to focus not only on quantity but also on quality and professional development, thereby effectively maintaining work motivation and team stability (19). This performance-based incentive scheme can serve as a reference for the development of other specialized nursing teams.
5.4. Feasibility of Dissemination to Primary Health Care Facilities
The pediatric intravenous therapy specialist team model developed in this study achieved substantial outcomes over 5 years of practice and demonstrates feasibility for dissemination to primary health care facilities. This feasibility is supported by the following aspects. First, the techniques are reproducible. The team established a standardized training system and eligibility criteria, including theoretical assessment (≥ 90 points), practical assessment (≥ 95 points), certification in ultrasound-guided puncture, and evaluation of communication skills with pediatric patients, forming a set of quantifiable competency assessment tools that facilitate the selection and training of intravenous therapy specialists in primary hospitals. Second, the services are deployable. The team received 18 visiting nurses in 2024, and consultations from external hospitals increased by 80.0% year-over-year in 2024. Moreover, the team independently developed an information management system for intravenous therapy, providing the technical foundation for teleconsultation, online training, and quality control guidance, thereby offering sustained technical support and standardized guidance to primary hospitals. Third, the model supports cost control. The team adopts a "1+3" core staffing model, with 1 team leader for coordination and 3 specialist nurses for execution, balancing human resource efficiency and service quality. Referring to the cost-effectiveness study of specialized nursing clinics by Liu et al. (15), a specialist team can achieve cost-effectiveness optimization through centralized puncture procedures, reduced complications, and shortened hospital stays. Fourth, the model is aligned with policy. The National Nursing Development Plan (2021 - 2025) issued by the National Health Commission explicitly promotes the development of specialized nursing and the decentralization of high-quality nursing resources. This model aligns with policy directions and has the potential to be incorporated into regional nursing development plans. However, dissemination also needs to consider practical challenges in primary hospitals, such as equipment conditions, including the availability of ultrasound-guided devices, specialist nurse reserves, and the level of information system development. A "pilot first, stepwise rollout" strategy is recommended, prioritizing collaboration with secondary hospitals with an existing pediatric foundation and gradually disseminating through training programs, technical assistance, and remote guidance, ultimately achieving homogenized development of regional intravenous therapy techniques.
5.5. Limitations Regarding Time-Varying Confounding
Several concurrent changes occurred during the study period that may have contributed to the observed improvements. First, the introduction of ultrasound-guided puncture in 2020 substantially increased success rates independently of team specialization. Second, the team's skills matured over time, creating a potential learning-curve effect. Third, the hospital's referral catchment expanded gradually, which may have increased both service volume and external consultation requests. Fourth, the expansion of the service scope, such as midline catheters from 2022 onward, changed case mix complexity. Therefore, the observed improvements should be attributed to the combined effects of team establishment, technological advancement, and temporal maturation, rather than solely to the management model. A controlled interrupted time-series design would be needed to isolate the causal effect.
5.6. Conclusions
The establishment and management of a pediatric intravenous therapy specialist team is a systematic endeavor. Through scientifically defined role configurations, rigorous eligibility-based training, standardized workflow management, and incentive-aligned performance distribution, this model significantly improves nursing quality and efficiency while promoting the homogenized development of regional intravenous therapy techniques. This study provides a practice-validated and replicable model reference for specialized pediatric nursing management.
In conclusion, the establishment of a dedicated pediatric intravenous therapy specialist team, supported by clear role definitions, competency-based training, standardized workflows, and performance-linked incentives, was associated with favorable changes in service volume, technical quality, and complication profiles in a single children's hospital. These findings provide a practice-based, replicable model for specialized pediatric nursing management, pending validation through more rigorous designs such as controlled interrupted time-series or multicenter studies.