1. Background
Perinatal Asphyxia (PA) is associated with oxygen deficiency before, during or after birth. It has been associated with an increased risk of neurodevelopmental disabilities. Clinical outcomes of PA include cerebral palsy, mental retardation, untreatable seizure and death (1). Hypoxic Ischemic Encephalopathy, a syndrome occurring in the first day of life, and manifesting a cluster of disturbed neurologic functions, consists of difficulty in respiration, decreased muscle tone, reflexes, and consciousness, and often seizures (2). Hypoxic Ischemic Encephalopathy occurs in 1% to 1.5% of live births in developed countries (3, 4). Its prevalence is greater in developing countries; in India, the National Neonatal Perinatal Database reported prevalence of 5% among patients in 16 medical centers. Incidence of encephalopathy is 50% to 60% in infants with severe perinatal asphyxia (5). Moderate/severe Hypoxic-Ischemic Encephalopathy (HIE) is a major cause of morbidity and death in the newborns and perpetual neurodevelopmental handicaps among survivors (6). Among infants with severe HIE, 50% die and the remainder develop neurological deficits whilst 10% to 20% of infants with moderate HIE die and 30% to 40% develop neurological abnormalities (7).
Parameters that have been used to predict or define perinatal asphyxia include: intrapartum electronic fetal monitoring, fetal or umbilical cord blood pH, Apgar score, meconium-stained amniotic fluid, hypoxic ischemic encephalopathy, and major organ disorder. However, currently no marker of perinatal asphyxia has shown a reliable predictive efficiency and only a combination of various parameters can help in the early identification of perinatal asphyxia (2, 8). The heat shock proteins (Hsps) are found in all organisms and all cell types. They are the most phylogenetically conserved proteins known with respect to both structure and function. Usually, Hsps are expressed at low levels, and under normal physiological conditions, many members of the Hsp family are involved in protein synthesis. Hsps are expressed by cells in response to stresses such as high temperature, free radicals, sheer stress, and toxins (9).
The role of these proteins is preventing changes in the composition of cells under stress. These proteins are found in all living cells. It is synthetized by several types of stress such as fever, alcohol, inflammation, oxidative stress, heavy metals and situations that can cause injury and necrosis. These proteins were classified based on molecular weight Hsp60, 70, and 90 (e.g. 90 KDalton). Mammalian heat shock proteins that are highly conserved originate from prokaryotic ancestors. These proteins are in the cytosol, mitochondria, endoplasmic reticulum and nucleus. Hsp70 ranges 0.01 - 0.65 in healthy babies and 0.13 - 0.30 ng/mL in healthy adults (10, 11).
Many factors have been suggested for early and accurate diagnosis of hypoxic ischemic events, one of which is Hsp70 (12-15). Perinatal asphyxia is an important cause of mortality and permanent neurological and developmental deficit. Early and accurate diagnosis would help to establish the likely prognosis and may also help in determining the most appropriate treatment. Studies in experimental animal models suggest that a protein called Hsp70 may be a good and potentially useful marker of cellular stress that may be clinically useful in determining the presence of neonatal asphyxia.
2. Objectives
Hypoxic Ischemic Encephalopathy is associated with high morbidity and mortality rates worldwide and is major burden for the patient, the family, and society, so regarding the importance of early and accurate diagnosis of asphyxia, we conducted this study, which is the first investigation of comparison of the serum Hsp70 antigen level between asphyxiated and healthy infants.
3. Patients and Methods
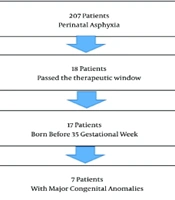
This prospective, case control study was conducted between April 2009 and October 2010, in Mashhad, Iran. Parents filled out an informed consent before recruitment into the study. The study was approved by the Ethical Committee of Mashhad University of Medical Sciences. Among 108 neonates who were originally recruited into the study, 101 subjects completed the study. In the control group two infants were excluded from study because of severe icterus and Down syndrome. In case group five infants were excluded from the study due to congenital heart disease (n = 1), sepsis (n = 1) and gestational age < 37 weeks (n = 3).
Fifty of the 101 infants were recruited as the case group. Exclusion criteria in this group were: gestational age < 37 weeks, congenital anomaly or infection. Originally, 51 control neonates were randomly selected. Exclusion criteria in control group were: hospital staying during first week of life or mother’s difficulty during pregnancy or delivery.
3.1. Inclusion Criteria
Perinatal asphyxia was defined based on the presence of at least two of the following clinical findings: 1) Fetal distress signs (heart rate of less than 100 beats/minute, late decelerations, or an absence of heart rate variability) in the last week of delivery. 2) Non vigorous meconium stained baby and respiratory depression, hypotonia, or bradycardia. 3) Apgar score at 1 min ≤ 4 and at five minutes 6 or less. 4) Need for resuscitation at birth. 5) pH of blood less than 7.20 or a base deficit of at least 12 mmoL/L during the first hour of life. Fifty-one healthy neonates considered as the control group were healthy within the first week of life and their mothers had normal vaginal delivery.
3.2. Clinical Assessment
The neurologic evaluation used to investigate neurologic function of the term neonates at 1, 3, 7 and 30 days of life, included a systematic examination of mental status (level of alertness), cranial nerve function and the motor and sensory systems. In particular, the motor assessment included an examination of spontaneous movement and muscle tone. For the evaluation of active tone, posture and resistance of muscles to passive movement were used. Newborn neurologic examination was performed by one neonatologist. Based on the criteria of Sarnat and Sarnat, HIE was classified as mild (infants with symptoms of hyper-excitability, hyper-alertness, or hyper-reflexia without seizures for at least 24 hours after birth); moderate (infants with lethargy, hypotonia, weak primitive reflexes, pupil miosis, and seizures); and severe (babies with symptoms of apnea, flaccid weakness, frequent seizures, decerebrated posture, and coma).
In addition to neurologic evaluation, other organs were systematically investigated as follows: a-Requirement to oxygen supplementation for more than 24 hours or mechanical ventilator. b- Shock and heart failure without congenital heart disease. c-Ischemia of the liver with increased transaminases and imbalance in coagulation tests. d-Thrombocytopenia. e-Acute tubular necrosis.
3.3. Laboratory Measurement
Cerebrospinal fluid culture, blood culture, urine culture, and serum Hsp70 were determined at the request of clinicians in initial evaluations. In both of the control and experimental group 2 ML of umbilical cord blood was collected and delivered in sterile tubes. After being allowed to clot, the tubes were centrifuged at 1000 rpm at room temperature to obtain serum. Hemolytic samples were excluded from analysis. Serum was stored at -70°C prior to analysis.
3.4. Determination of Serum Hsp70 Antigen
Serum Hsp 70 antigen concentrations were determined using a sandwich ELISA (The enzyme-linked immunosorbent assay) in-house. After overnight incubation 100 µL monoclonal Hsp70 antibody at 4°C, the plate was washed and non-specific binding sites blocked by incubation with 0.1% BSA. Plates were washed and 100 µL of standards, 5000 ng/mL of recombinant Hsp70, and undiluted serum were incubated for 2 hours at 37°C. After adding 100 µL of rabbit polyclonal anti-Hsp70, 100 µL of an anti-rabbit immunoglobulin peroxidase conjugate was added to the plate for 1 hour at 37°C. After adding 100 µl of TMB substrate, the reaction was stopped after 20 minutes with 2 M HCl and the absorbance read at 450 nm. The sensitivity of the assay was 39 ng/mL, and the inter- and intra-assay coefficient of variation was 9% and 6% respectively.
3.5. Statistical Analysis
Data were analyzed using SPSS 11.5 software (SPSS, Chicago, IL, USA) and for comparison of the two groups Mann-Whitney, t-tests and Chi-square tests were used. Receiver-operating characteristic (ROC) curves were also used for determining optimum point for sensitivity and specificity of Hsp70. P values < 0.05 were considered statistically significant.
4. Results
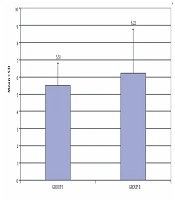
Among 115 neonates who were originally recruited into the study, 101 subjects completed the study (50 cases and 51 controls). There was no statistically significant difference (P < 0.05) between the two groups with regard to gender, amniotic fluid volume, and maternal age (Table 1). The cases had a significantly lower Apgar score in the first minute and five minutes post partum, likelihood of cesarean section, birth weight and higher serum Hsp70 concentrations compared to the controls (P < 0.05, Table 1). Among 50 infants with perinatal asphyxia, 27 had HIE grade 1, 19 had grade 2, and 4 had grade 3. Among the 51 control neonates minimum Hsp70 antigen was 0.01 and its maximum 0.63 (average 0.24) ng/mL. Among the 50, neonates in case group minimum and maximum was 0.04 and 1.14 ng/mL, respectively (average 0.36 ng/mL). In cases, median serum Hsp70 titer was significantly higher than that of the controls (P < 0.05). There was no significant correlation between clinical characteristies and serum Hsp70 levels (Table 2). For serum Hsp70, the sensitivity, specificity and area under the curve for the diagnosis of perinatal asphyxia was 58%, 76% and 73% respectively (Figure 1).
| Variables | Control Group | Case Group | P Value |
|---|---|---|---|
| 51 | 50 | - | |
| Male | 29 (56.9) | 28 (56.0) | |
| Female | 22 (43.1) | 22 (44.0) | |
| 0.021 | |||
| Yes | 0 (0) | 5 (10) | |
| No | 51 (100) | 45 (90) | |
| 28.33 | 27.76 | 0.803 | |
| 3281 | 2997 | 0.003 | |
| 35 (68.6)/16 (31.4) | 12 (24)/38 (76) | 0.001 | |
| 0.050 | |||
| First | 14 (27.5) | 26 (52) | |
| Second and third | 29 (56.9) | 16 (32) | |
| Fourth and more | 8 (15.7) | 8 (16) | |
| 0.492 | |||
| Normal | 50 (98) | 48 (96) | |
| Abnormal | 1 (2) | 2 (4) | |
| 0.24 (0.01-0.63) | 0.36 (0.04-1.14) | 0.001 |
a Values expressed as mean, median (range) or No. (%).
b P Value < 0.05 considered significant.
| Variables | Serum Hsp70 concentration, ng/mL | P value | ||||
|---|---|---|---|---|---|---|
| < 0.015 | 0.15 - 0.25 | 0.25 - 0.35 | 0.35 - 0.45 | > 0.45 | ||
| 0.837 | ||||||
| Male | 8 (14) | 15 (26.3) | 18 (31.6) | 9 (15.8) | 7 (12.3) | |
| Female | 4 (9.1) | 11 (25) | 15 (34.1) | 10 (22.7) | 4 (9.1) | |
| 0.541 | ||||||
| > 20 | 0 (0) | 1 (5.9) | 0 (0) | 3 (23.1) | 0 (0) | |
| 20 - 25 | 0 (0) | 3 (17.6) | 0 (0) | 2 (15.4) | 0 (0) | |
| 26 - 30 | 0 (0) | 5 (29.4) | 5 (45.5) | 4 (30.8) | 1 (25) | |
| 31 - 35 | 3 (60) | 5 (29.4) | 3 (27) | 1 (7.7) | 3 (75) | |
| 36 - 40 | 2 (40) | 3 (17.6) | 3 (27.3) | 3 (23.1) | 0 (0) | |
| 0.993 | ||||||
| < 2 | 0 (0) | 1 (33.3) | 2 (10) | 0 (0) | 1 (25) | |
| 2 - 2.5 | 0 (0) | 0 (0) | 4 (20) | 3 (14.3) | 0 (0) | |
| 2.5 - 3 | 0 (0) | 0 (0) | 7 (35) | 7 (33.3) | 1 (25) | |
| 3 - 3.5 | 1 (50) | 2 (66.7) | 5 (25) | 7 (33.3) | 0 (0) | |
| > 3.5 | 1 (50) | 0 (0) | 2 (10) | 4 (19) | 2 (50) | |
| 0.03 | ||||||
| Yes | 0 (0) | 3 (60) | 1 (20) | 0 (0) | 1 (20) | |
| No | 4 (8.9) | 4 (8.9) | 14 (31.1) | 15 (33.3) | 8 (17.8) | |
| 0.860 | ||||||
| Yes | 2 (9.5) | 3 (14.3) | 4 (19) | 7 (33.3) | 5 (23.8) | |
| No | 2 (6.9) | 4 (13.8) | 11 (37.9) | 8 (27.6) | 4 (13.8) | |
| 0.668 | ||||||
| I | 2 (7.4) | 4 (14.8) | 10 (37) | 7 (25.9) | 4 (14.8) | |
| II | 2 (10.5) | 2 (10.5) | 4 (21.1) | 6 (31.6) | 5 (26.3) | |
| III | 0 (0) | 1 (25) | 1 (25) | 2 (50) | 0 (0) | |
| 0.151 | ||||||
| Live | 2 (50) | 6 (15) | 13 (32.5) | 10 (25) | 9 (22.5) | |
| Dead | 2 (20) | 1 (10) | 2 (20) | 5 (50) | 0 (0) | |
| 0.202 | ||||||
| 6 | 3 (27.3) | 0 (0) | 4 (36.4) | 3 (27.3) | 1 (9.1) | |
| 7 - 9 | 0 (0) | 2 (12.5) | 6 (37.5) | 5 (31.3) | 3 (18.8) | |
| ≥ 10 | 1 (4.3) | 5 (21.7) | 5 (21.7) | 7 (30.4) | 5 (21.7) | |
| 0.301 | ||||||
| ≤ 7.2 | 3 (7.5) | 7 (17.5) | 10 (25) | 14 (35) | 6 (15) | |
| > 7.2 | 1 (10) | 0 (0) | 5 (50) | 1 (10) | 3 (30) | |
a Values expressed as No. (%).
b P value < 0.05 considered significant.
cCorrelation coefficient for maternal age is -0.89.
d Correlation coefficient for Birth weight is 0.001.
e Abbreviation: HIE; hypoxic-ischemic encephalopathy.
f Correlation coefficient for Neonate‘s blood pH is 0.149.
 Graph to Discriminate the Sensitivity and Specificity of Serum Hsp70 Level for the Diagnosis of Perinatal Asphyxia")
Figure 1.
Receiver Operating Characteristics (ROC) Graph to Discriminate the Sensitivity and Specificity of Serum Hsp70 Level for the Diagnosis of Perinatal Asphyxia
5. Discussion
This study aimed to determine the level of serum Hsp70 in asphyxiated and healthy infants. An experimental study in 2008, investigated the effects of citicoline on Hsp proteins in neonatal rats with prenatal asphaxia. Citicoline affected the expression of Hsp proteins as well as severity of asphyxia (1). A Turkish study has reported Hsp70 expression in pup rats. Twenty eight rats were randomly divided into two experimental and two control groups. Experimental group 1 including 7 -day old rats (n = 7) and experimental group 2 including 12-day old rats (n = 7) were exposed to hypoxia for 4 hours. Controls were subjected to air for the same time. For immunostaining, hippocampus, kidney and heart were collected from each rat. Hsp70 expression was higher in the 12-day rats than in the 6 -day rats. However, there were no significant differences in Hsp70 expression in myocardial muscle and kidney in hypoxic rats when compared with the controls (13).
Jiang et al. (14) studied the expression of Hsp70, Hsp27, c-Fos, c-Jun and activation of calpain in 42 postnatal day-7 rats that underwent hypoxia-ischemia. Calpain was up-regulated in 24 hours in cortex and 12 hours in hippocampus after injury while expression of c-Fos and c-Jun were peaked in 2 and 4 hours after injury. Expression of Hsp70 and Hsp27 demonstrated a peak at 12 hours and 24 hours in cortex but expression of Hsp70 was maximal at 1 hour and then decreased until 24 hours after hypoxia-ischemia. Hsp27 expression was increased in hippocampal samples after hypoxia-ischemia. Therefore, it seems hypoxia-ischemia causes apoptosis via activation of calpain and the increasing Hsp70 expression for protection from brain damage and after that Hsp27 expression in brain of rat pups. On the other hand, expression of Hsp70 and Hsp90 did not change in brain of piglets after hypoxia-ischemia injury (14).
There are limited data reported on the level of Hsp proteins in human infants. Child and coworkers reported that serum anti-Hsp70 level of mothers that delivered infants with birth defect was higher than in mothers who delivered healthy infants. In our study serum anti-Hsp70 level was not measured in mothers (15). An increased Hsp70 and Hsp27 expression was found in neurons and glial cells following ischemia, hyperthermia and epileptic seizure (16). Hsp proteins were also observed in the parieto-occipital and hippocampus of subjects with a hypoxic/ischemic damage (17). Our results confirmed that Hsp70 was expressed in babies with hypoxia-ischemia.
Child and colleagues showed increased levels of anti-Hsp70 in blood samples of mothers who delivered babies with neural tube defect or palatine and lip cleft (15). Another study showed that ELISA is a standard and sensitive method for measurement of Hsp70. In this study ELISA and western blot were used for Hsp measurement in pediatric patients with juvenile idiopathic arthritis. Results showed that ELISA is more suitable and sensitive for Hsp60, 65 and 70 antibodies (18).
We investigated serum Hsp70 level of asphyxiated babies 6 hours after birth. It is better to determine the time when serum Hsp70 level of the neonates is elevated. It is also recommended to measure Hsp70 level in CSF of infants or in serum of mothers. The time point of Hsp70 elevation may be crucial in prenatal diagnosis and termination of pregnancy. Our findings demonstrated that Hsp70 may be a good marker for early diagnosis of neonatal asphyxia.