


1. Background
Impacts of modern technologies on different aspects of people’s lives cause some major changes in their behavioral patterns and predispose them to chronic complications such as cardiovascular diseases (1). Despite the achievements in decreasing the fatality rate of cardiovascular disease, it is still the leading cause of death in some countries; the more the risk factors are prevalent, the more the rate of incidence of such diseases increases, and the age of incidence decreases in some countries such as Iran (2).
Fast food consumption is one of the most crucial risk factors causing cardiovascular diseases (3). Fast food is a kind of food made easily and fast, mostly out of the house by some unhealthy foodstuff. Fast food is referred to all kinds of sandwiches (sausages, bologna), burgers, pizzas, fries, etc., which contains high amount of fat and calories, but low in nutrient substances compared with home-made foods (4). Different studies showed that fast food consumption causes cardiovascular diseases as well as depression, concentration problems, and increased saturated fats, sodium, and sugar intake (5, 6). Despite the disadvantages listed above, studies manifested that fast food consumption rate ranged > 3% to 12% in the U.S in the past 2 decades (7). However, such an increase in fast food consumption rate among teenagers is not typical of developed societies and is also observed in the developing countries such as Iran. Studies reported that 29% of Iranian students consume fast food weekly; students within the age range of 6 to 18 years have fast food twice a week (3, 8).
Due to the increased fast food consumption rate, its consequent complications, and the need to establish proper nutritional behaviors from the beginning of the adolescence, health education stands as one of the optimal solutions for this problem.
Health education is a process that tries to modify poor lifestyles by combining different views and helps people and societies to decide upon health-related issues; meanwhile constitutes a significant role in preventing behaviors (9). Performing nutrition education programs in schools is a rational solution to modify inappropriate nutritional behaviors since proper eating habits should be grounded in childhood (10). Social cognitive theory (SCT) is one of the most functional and useful guidelines to generalize and predict nutritional behaviors particularly in adolescents (11). SCT assumes that behavior, and nutritional behaviors in particular, are defined by 1, personal factors such as taste preferences, attitudes, beliefs, self-efficacy, health-related concerns, and body satisfaction; 2, behavioral factors such as meal consumption patterns, weight controlling actions, cooperation in preparing foods, and groceries consumption, and 3, socioenvironmental or interpersonal factors such as availability of healthy foodstuff in home, etc. (12).
Numerous studies adapted the theory and tried to identify and predict nutritional behaviors among different groups of participants such as the study by Beiranvanpour (13). Najimi et al., employed SCT to determine correlations between fruit and vegetables consumption among students and reported self-efficacy as one of the important aspects in changing behavior (14).
2. Objectives
The current study aimed at determining the effect of SCT-based intervention on fast food consumption among female high school freshmen in Isfahan, Iran.
3. Materials and Methods
The current quasi-experimental study was carried out on 92 female high school freshmen in Isfahan, in 2016. Sample size was calculated according to the following formula:
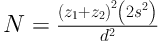
Equation 1.
Z1 confidence level (0.59) is 1.96, Z2, power test (0.80) is 0.84, S is the estimation of SD of each variable in 2 groups, and d is the minimum of mean score difference between the 2 groups in each variable that showed significant differences and S was 0.6.
To select the participants, 3 districts out of 5 educational districts in Isfahan were randomly selected. Among female-only state secondary schools, 4 schools were randomly selected and divided into the intervention (consisting of 2 schools with 36 students) and control (consisting of 2 schools with 36 students) groups.
data collection tools used in the current study were students’ demographic information including age, weight, height, mother’s education and occupation, father’s occupation, household aspect, and economic status. To evaluate fast food consumption rate and SCT aspects, the Beiranvandpour questionnaire including fast food consumption frequency in the past week (8 items), nutritional knowledge (5 items), value expectancy (8 items), outcome expectancy (8 items), and self-efficacy (7 items) was used (13).
A 5-option Like is used to score the fast food consumption frequency questions; 0 (never), 1 (once), 2 (twice), 3 (three or four times) and 4 (five times and more). Knowledge questions are answered by “Yes”, “No”, and “I don’t know”; each correct answer has 2 points, each wrong answer makes zero point, and each neutral answer 1 point. The scores range 0 to 10. To examine the aspects of SCT, a 5-option Likert scale consisting of “completely disagree”, “disagree”, “no idea”, “agree”, “completely agree” items with the scores of 1 to 5, respectively, was used.
Content validity of the questionnaire was confirmed by Beiranvandpour; content validity ratio (CVR) of the instrument was 0.96 and content validity index (CVI) for all measures was > 0.9. Cranach’s alpha for knowledge, self-efficacy, outcome expectancy, and value expectancy was 0.76, 0.65, 0.63, and 0.75, respectively, which confirmed the reliability of the instrument as well.
By self-report method, it took the students 20 to 30 minutes to fill out the questionnaire in both groups before and 3 months after the intervention.
To measure weight, a digital scale to the nearest 100 g was used. Students were weighed barefooted with minimum clothing. Height was measured using a stadiometer while the students were standing with their shoes off. Body mass index (BMI) was calculated for each student with their weights in kilograms divided by their squared heights in meters.
The SCT-based intervention was done through 4 sessions in the intervention group by the health educator.
The first session included introducing the study and its objectives, defining fast food products and their detriments, comparing their nutritional values with other foods based on the food pyramid using educational slides (90 minutes).
The second session included reviewing the materials of the first session and focusing on the value expectations to familiarize the students with the consequences of fast food consumption such as cardiovascular diseases and obesity through lectures and group discussions (90 minutes).
The third session included reviewing the materials of the second session to dissuade consuming fast food consumption focusing on the outcome complications through group discussions (90 minutes).
The fourth session included reviewing the materials of the third session focusing on self-efficacy to teach students how to replace fast foods with other healthier foods through lectures and group discussions (90 minutes).The students were asked to make healthy fast foods, eat them, and talk about their ideas and opinions about such foods.
At the end of each session, pamphlets containing a brief summary of what was taught in that session were handed over to the participants.
After collecting the information of the post-test, one educational session was held for the control group and the prepared educational resources including educational pamphlets were given to them.
Data were analyzed with SPSS version 20 using descriptive statistics and independent t test, paired samples t test, and one-way ANOVA. For all tests, the significance level was considered α = 0.05.
4. Results
The current study was carried out on 92 female high school freshmen with the mean age of 12 years. Independent t test showed no significant difference regarding the mean age, weight, height, BMI, and number of family members between the intervention and control groups. More information is provided in Table 1.
Table 1.Comparison of Demographical Information in the Intervention and Control Groups
| Variable | Group | Independent t Test | |||
|---|---|---|---|---|---|
| Intervention | Control | ||||
| Mean | SD | Mean | SD | P value | |
| Age, y | 12.93 | 0.25 | 12.91 | 0.35 | 0.75 |
| Weight, kg | 50.73 | 10.44 | 52.18 | 9.64 | 0.50 |
| Height, cm | 160.16 | 6.34 | 161.20 | 7.27 | 0.47 |
| BMI, kg/m2 | 19.70 | 3.58 | 20.11 | 3.80 | 0.60 |
| Number of family members | 4.24 | 0.79 | 04.26 | 0.91 | 0.90 |
For father’s occupation item, “private business” and “employee” categories had the highest frequencies; for mother’s occupation, “housewife” category had the highest frequency (more than 65.3% in both groups). Chi-square test showed no significant difference between the groups regarding the frequency distribution of mother’s occupation (P = 0.76) and father’s occupation (P = 0.41).
About fathers’ and mothers’ educational level in both groups, the highest frequencies were observed in “high school diploma” and “university degree” items, respectively. The Mann-Whitney test showed that differences in father’s (P = 0.81) and mother’s (P = 0.33) educational level between the groups were insignificant.
In terms of income, the highest frequency ranged 0.5 to 15 million Rials in both groups (P = 0.23).
Independent t test showed that the mean fast food consumption rate, before and after the intervention, was significantly indifferent between the groups. However, there was a significant different in the mean score of fast food consumption before and after the intervention in the intervention group (P < 0.001). Independent t test manifested that the mean score of fast food consumption in the intervention group decreased after the intervention compared with that of control group (P = 0.007) (Table 2).
Table 2.Comparison of the Means of Fast Food Consumption Before and 3 Months After the Intervention
| Variables | Group | Before Intervention | 3 Months After the Intervention | Paired-Test | ||
|---|---|---|---|---|---|---|
| Mean | SD | Mean | SD | P value | ||
| Fast food consumption | Intervention | 16.1 | 08.9 | 09.4 | 07.5 | < 0.001 |
| Control | 15.5 | 13.7 | 15.1 | 14.3 | 00.84 | |
| Independent t test | P value | P = 0.254 | P = 0.018 | |||
Results of the paired samples t test of the intervention group showed that mean knowledge (P = 0.001), outcome expectancy (P = 0.003), and self-efficacy (P = 0.002) improved after the intervention, but the value of expectancy did not show any significant difference (P = 0.08). None of the aspects showed significant changes in the control group (P > 0.05). Independent t test showed that the mean scores of knowledge (P = 0.02), outcome expectancy (P = 0.03), and self-efficacy (P = 0.03) in the intervention group were significantly higher than those of the control group, but the mean scores of expectancy did not show any significant changes (P = 0.23) (Table 3).
Table 3.Comparison of the Mean Scores of SCT Aspects Before and 3 Months After the Intervention in Both Groups
| Aspect | Group | Before Intervention | 3 Month After the Intervention | Paired t Test | ||
|---|---|---|---|---|---|---|
| Mean | SD | Mean | SD | |||
| Knowledge | Intervention | 82.2 | 18.9 | 90.9 | 15.02 | 0.001 |
| Control | 82.6 | 22.9 | 80.7 | 27.3 | 0.63 | |
| Independent t test | P = 0.921 | P = 0.032 | ||||
| Value expectations | Intervention | 62.3 | 15.1 | 65.9 | 16.3 | 0.008 |
| control | 62.1 | 17.8 | 62.6 | 15.3 | 0.78 | |
| Independent t test | P = 0.950 | P = 0.360 | ||||
| Outcome expectations | Intervention | 75.4 | 11.2 | 81.9 | 14.3 | 0.0003 |
| control | 75.01 | 10.3 | 74.7 | 12.8 | 0.89 | |
| Independent t test | P = 0.749 | P = 0.013 | ||||
| Self-efficacy | Intervention | 62.1 | 20.1 | 72.9 | 19.5 | 0.002 |
| Control | 62.9 | 20.4 | 63.1 | 21.4 | 0.96 | |
| Independent t test | P = 0.792 | P = 0.025 | ||||
5. Discussion
The current study aimed at determining the effect of a SCT-based intervention on fast food consumption among female high school freshmen. The results showed that fast food consumption decreased 3 months after the intervention and the reason can be adapting the SCT-based educational program. There were also other studies, which reported the positive effects of the theory in changing or creating proper behaviors. Loubans aimed at designing a proper diet for females and reported positive effects of SCT in this regard (15). Also, Kimberly Rinderknecht reported the effect of SCT on adolescents’ nutritional behaviors in which positive contributions of the theory to behavior modification process were reported (16). Moreover, Anderson claimed that unhealthy behaviors could be modified using SCT (9).
Results of the current study showed that after the intervention, fast food consumption significantly decreased in the intervention group. This proved that the SCT-based educational intervention was effective. Unfortunately, there were no studies on fast food consumption behaviors on Iranian students to compare with the current study, but the literature indicate that almost 29% of the students eat fast food weekly (17). The mean of fast food consumption among students ages 6 to18 years is twice a week (3). Due to the increasing tendency of adolescents to fast foods, trainings to properly guide this tendency seem urgent. Also, informing adults and adolescents in particular, about the harmful consequences of fast food consumption is of great importance; the impact of knowledge on behavior cannot be denied as well. Hence, the educational program of the current study was designed in a way to affect students’ knowledge by defining fast food products and comparing them with other types of foodstuffs using food pyramid. It increased their knowledge to a remarkable level. SCT has multiple aspects amongst which value expectations was highlighted in the current study. This aspect marks the value, which an individual assigns for the expected outcomes of a given behavior. Therefore, for the sake of intervention, outcomes of fast food consumption and its following health threatening complications were focused on. It increased the mean score of value expectations in the intervention group. These findings were consistent with the results of the study by Beiranvandpour (13). Outcome expectancy is another aspect of SCT investigated in the current study. Mean values for this aspect experienced an increase at the end, but the differences were not totally significant. This finding was inconsistent with those of the study by Anderson; in the current study, the intervention increased in this aspect in the intervention group (9). Limited number of educational sessions and lack of enough time to rehearse the aspect-related messages may be the causes of insignificant differences observed in the intervention group. The other reason may lie in the fact that adolescents assume secondary impacts of fast food consumption such as cardiovascular diseases to occur in their elderly ages. Hence, in the studies that deal with adolescents and teenagers, early complications such as increased blood sugar, obesity, and lack of physical harmony should be put into the focus. Self-efficacy was another aspect of SCT that underwent significant differences in the intervention group. This significant change proved the effect of education. In the current study, techniques affecting self-efficacy such as encouraging, rewarding, etc. were adapted and it seems that preparing home-made foods instead of fast foods by students was one of the useful methods to increase self-efficacy.
The current study had a few limitations. The first was that the questionnaire was a self-reporting one and there were limitations to determine the number of educational sessions. The second limitation was that the study was conducted only on females.
Hence, it can be concluded that using a SCT-based educational intervention program focused on the aspects such as knowledge, self-efficacy, and value expectation can be effective to decrease students’ fast food consumption; also, preparing healthy food by the students themselves can also be very useful to increase their self-efficacy. Therefore, the researchers recommend more SCT-based interventional studies on other behavioral aspects of students’ fast food consumption.

