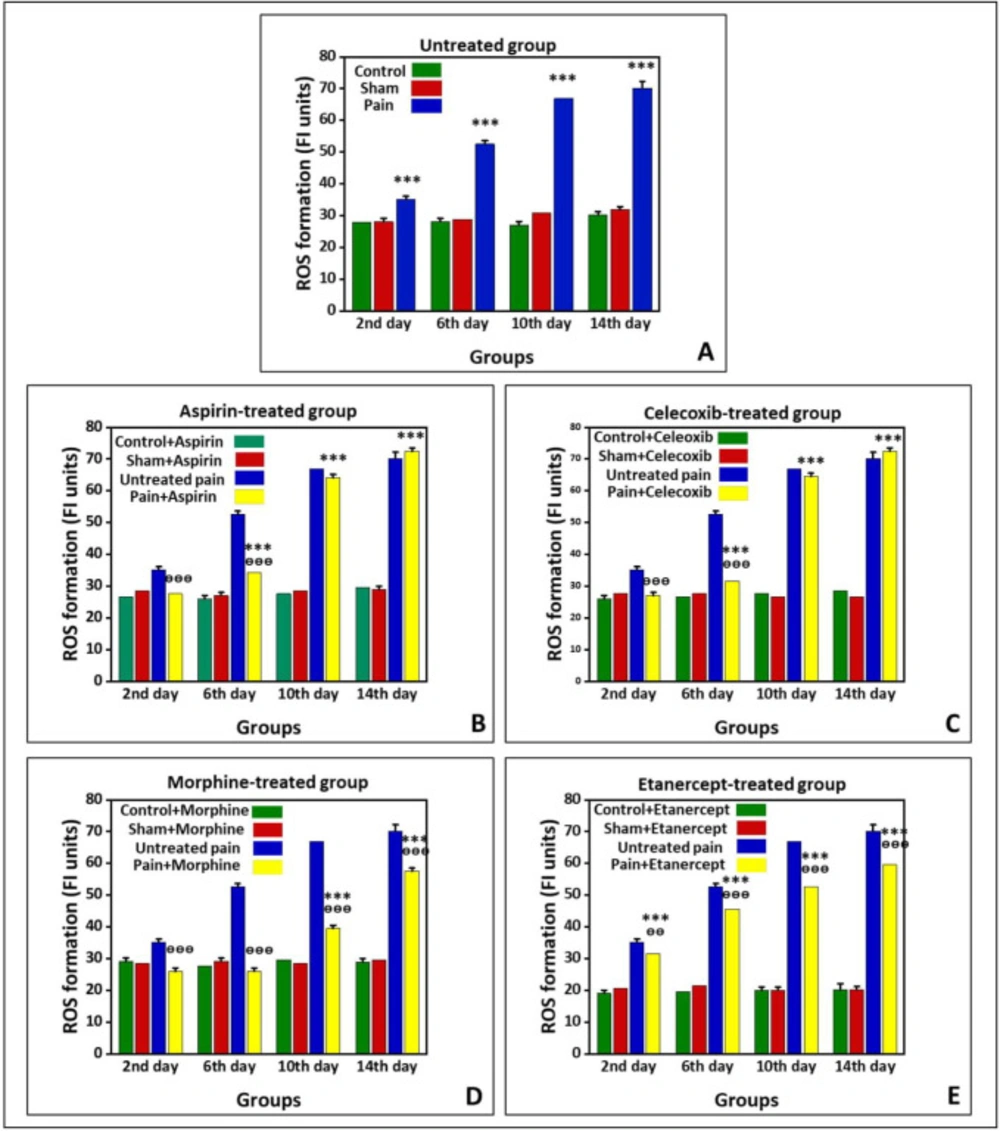
Effects of ASA, Celecoxib, Morphine, and Etanercept on ROS formation in neuropathic pain
Figure 1 shows the production of ROS in the untreated group and groups treated with ASA, celecoxib, morphine, and etanercept on the second, 6th, 10th, and 14th days after induction of neuropathic pain. As shown in
Figure 1A, ROS production in the neuropathic pain model rats was statically higher than the sham group in the untreated animals (
P < 0.001). The results also indicated that the ROS formation reached its highest level on the 14th day in the neuropathic pain model rats. However, there was no difference between sham and control groups on different days after neuropathic pain induction (
P > 0.05).
As shown in
Figure 1B, the generation of ROS in the ASA-treated pain group did not have a considerable difference with the sham rats (
P > 0.05) on the second day after induction of neuropathic pain. However, this alteration was significant (
P < 0.001) on the 6th, 10th, and 14th days. The ROS generation reached its highest level in the case group on the 14th day. Additionally, the results confirmed that the amount of ROS produced in the ASA-treated neuropathic pain model animals was markedly lower than that of the untreated rats (
P < 0.001) on the second and 6th days. However, there was no considerable difference in ROS production between the ASA-treated pain group and the untreated group on the 10
th and 14th days (
P > 0.05). There was also no considerable difference between sham and control rats on different days after neuropathic pain induction (
P > 0.05).
The production of ROS in the celecoxib-treated neuropathic pain model animals did not statically differ from the sham rats (
P > 0.05) on the second day after induction of neuropathic pain (
Figure 1C). On the other hand, ROS formation was markedly elevated compared to the sham rats (
P < 0.001) on the 6th, 10th, and 14th days. Also, there was no significant difference in ROS generation between sham and control groups on different days after induction of neuropathic pain (
P > 0.05). In addition, ROS production in the celecoxib-treated neuropathic pain model animals was markedly lower than in the untreated rats (
P < 0.001) on the second and 6th days. However, there was no difference in ROS production between the celecoxib-treated pain group and the untreated group (
P > 0.05) on the 10th and 14th days.
The production of ROS in the morphine-treated neuropathic pain model rats had no considerable difference with the sham animals (
P > 0.05) on the second and 6th days after induction of neuropathic pain (
Figure 1D). Nevertheless, ROS formation was elevated compared to the sham rats (
P < 0.001) on the 10th and 14th days. As shown in
Figure 1D, the ROS generation reached its highest level in the case group on the 14th day. There was no considerable difference between sham and control rats on different days after induction of neuropathic pain (
P > 0.05). Our results also demonstrated that the ROS production in the morphine-treated pain group is markedly lower than that in the untreated animals (
P < 0.001).
The results showed that ROS formation in the etanercept-treated neuropathic pain model rats was higher than the sham animals (
P < 0.001) at different days after the induction of neuropathic pain (
Figure 1E). Similarly, ROS generation in the etanercept-treated pain group reached its highest level on the 14th day in the case group. Production of ROS was statically lower in the etanercept-treated neuropathic pain model animals than in the untreated rats on the second (
P < 0.01), 6th, 10th, and 14th (
P < 0.001) days. However, there was no considerable difference in ROS production among sham and control rats (
P > 0.05).
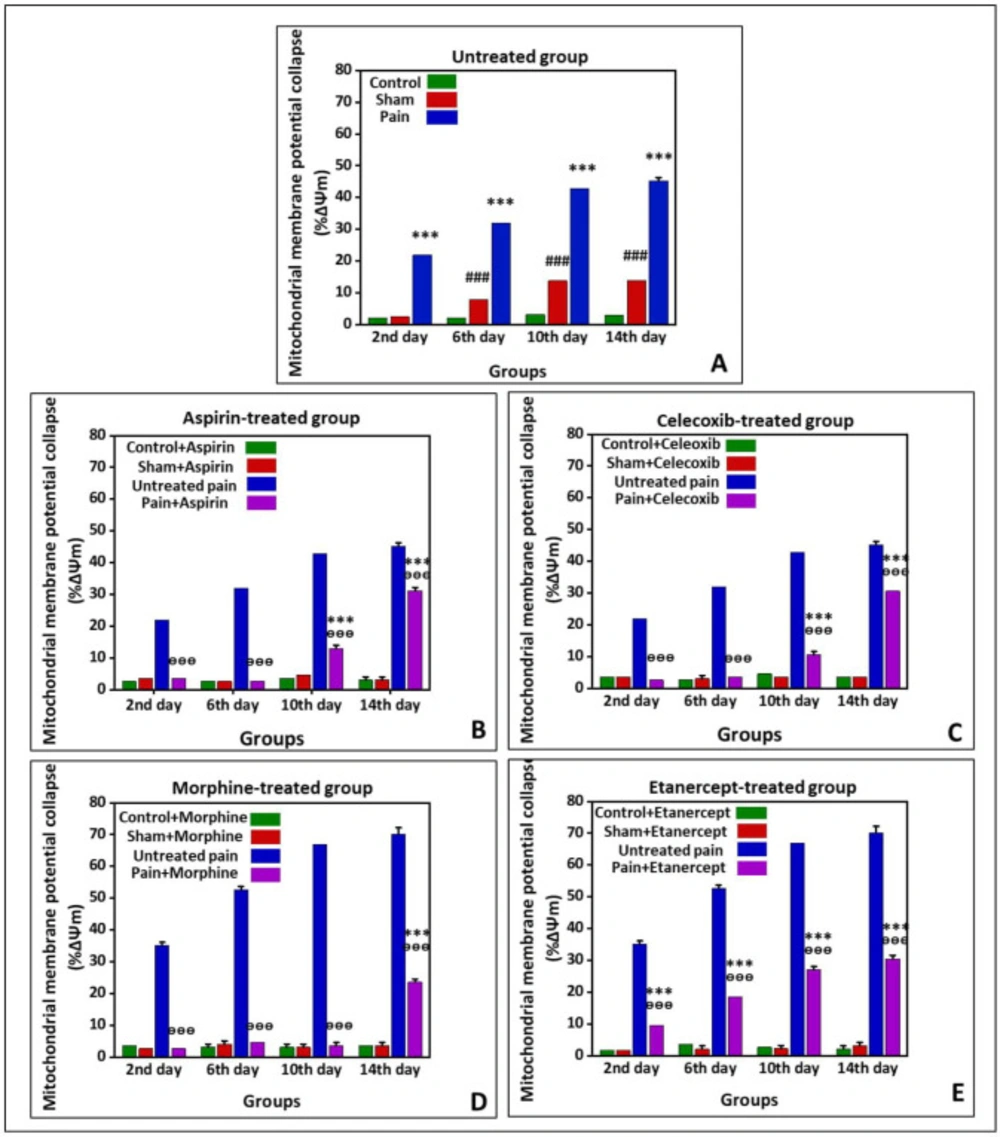
Effects of ASA, Celecoxib, Morphine, and Etanercept on the mitochondrial membrane potential collapse (%∆Ψm) in neuropathic pain
Figure 2 shows %∆Ψm in the untreated group and the groups treated with ASA, celecoxib, morphine, and etanercept on the second, 6th, 10th, and 14th days after induction of neuropathic pain. As presented in
Figure 2A, the %∆Ψm was elevated in untreated pain groups compared to the sham rats (
P < 0.001) on all investigated days, which showed an upward trend. In addition, there was a considerable difference in %∆Ψm between the sham group and the control group (
P < 0.001) on the 6th, 10th, and 14th days.
According to the results, %∆Ψm in the ASA-treated pain group was not statically different from the sham rats (
P > 0.05) on the second and 6th days after induction of neuropathic pain (
Figure 2-B); however, it was significantly increased at the 10th and 14th days (
P < 0.001). There was no difference between sham and control rats on different days after induction of neuropathic pain (
P > 0.05). Our results also demonstrated that %∆Ψm was statically lower in the ASA-treated pain animals than in the untreated case rats in all investigated days (
P < 0.001).
As can be seen in
Figure 2C, %∆Ψm in the celecoxib-treated pain group did not statically differ from the sham rats (
P > 0.05) on the second and 6th days after induction of neuropathic pain; however, this rate was elevated (
P < 0.001) on the 10th and 14th days. There was no considerable difference in %∆Ψm between sham and control rats on different days (
P > 0.05). On the other hand, %∆Ψm was decreased in the celecoxib-treated neuropathic pain model rats than in the untreated case animals (
P < 0.001).
%∆Ψm in the morphine-treated neur-opathic pain model rats was not statically different from the sham animals (
P > 0.05) on the second, 6th, and 10th days after induction of neuropathic pain (
Figure 2D). But, this rate was significantly increased (
P < 0.001) on the 14th day. There was no considerable difference in %∆Ψm between sham and control group on different days after induction of neuropathic pain. However, the mitochondrial potential collapse in the morphine-treated neuropathic pain model rats was lower than that of the untreated neuropathic pain model animals (
P < 0.001).
As shown in
Figure 2E, %∆Ψm was elevated in the etanercept-treated neuropathic pain model animals compared to the sham rats (
P < 0.001) on the second, 6th, 10th, and 14th days after induction of neuropathic pain. There was no considerable difference in %∆Ψm between the sham and the control group (
P > 0.05). On the other hand, the %∆Ψm was statically diminished in the etanercept-treated pain group compared to the untreated neuropathic pain model rats on different days (
P < 0.001).
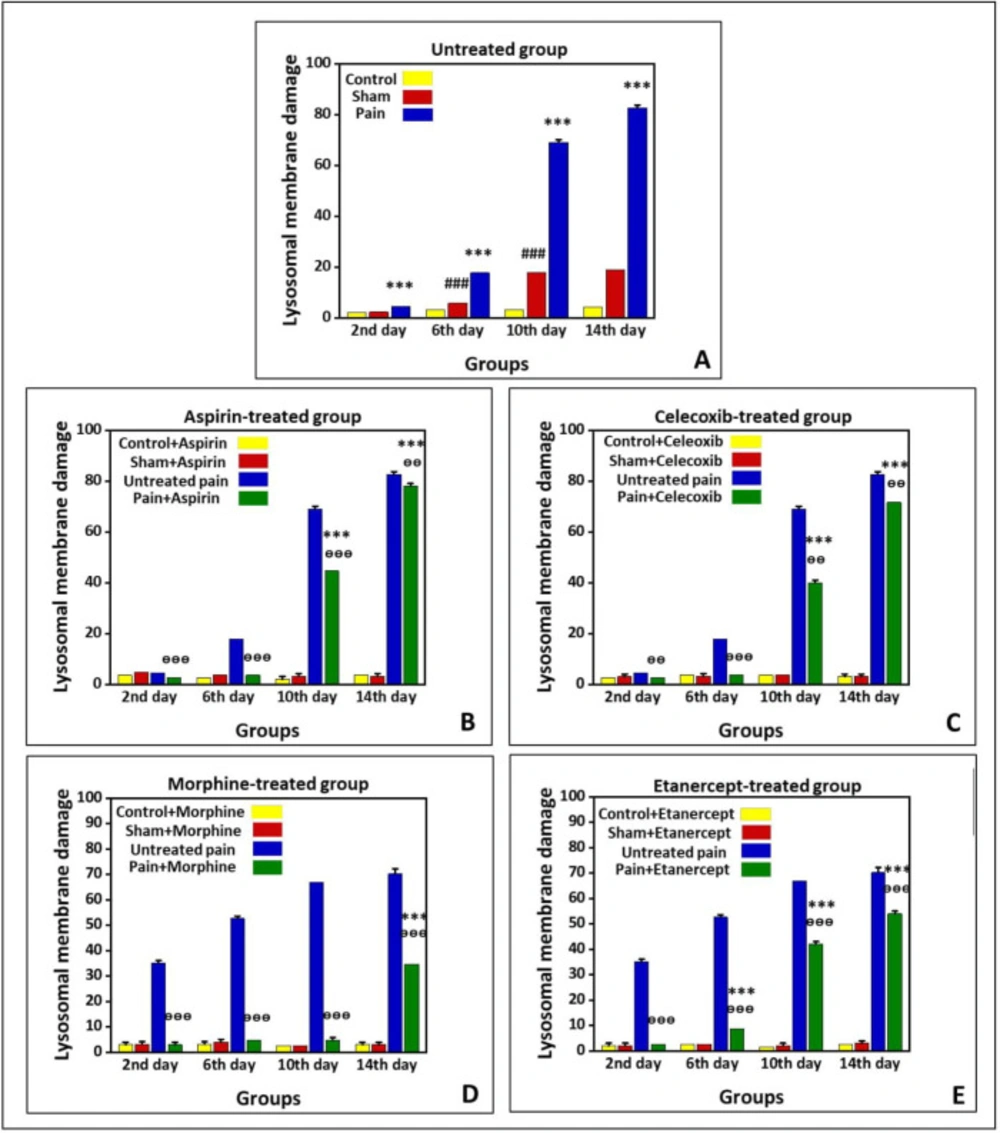
Effects of ASA, Celecoxib, Morphine, and Etanercept on lysosomal membrane stability in neuropathic pain
Figure 3 shows lysosomal-membrane damage in the untreated group and the groups treated with ASA, celecoxib, morphine, and etanercept on the second, 6th, 10th, and 14th days after induction of neuropathic pain. According to the results, there was significant lysosomal damage in the neuropathic pain model rats compared to the sham animals (
P < 0.001) in all investigated days, with an upward trend (
Figure 3A). Besides, there was a statistical difference in the extent of lysosomal damage between the sham and control rats (
P < 0.001) on the 6th, 10th, and 14th days.
As presented in
Figure 3-B, lysosomal damage in the ASA-treated case group was not markedly different from the sham animals (
P > 0.05) on the second and 6th days after induction of neuropathic pain. However, the extent of lysosomal damage was elevated (
P < 0.01) on the 10th and 14th days. There was no statistical difference in the extent of lysosomal damage between the sham and control group on different days. On the other hand, the rate of lysosomal damage in the ASA-treated case animals was markedly lower than that of the untreated case rats on the second, 6th, 10th (
P < 0.001), and 14th (
P < 0.01) days.
As shown in
Figure 3C, the amount of lysosomal damage in the celecoxib-treated pain group was not markedly different from the sham animals (
P > 0.05) on the second and 6th days after induction of neuropathic pain. However, the extent of lysosomal damage was elevated (
P < 0.001) on the 10th and 14th days. There was no statistical difference in the extent of lysosomal damage between the sham and control group on different days (
P > 0.05). On the other hand, the rate of lysosomal damage in the celecoxib-treated neuropathic pain model rats was markedly lower than that of the untreated neuropathic pain model animals (
P < 0
.001).
Our results showed that the extent of lysosomal damage in the morphine-treated pain group was not markedly different from the sham rats (P > 0.05) on the second, 6th, and 10th days after induction of neuropathic pain. Nevertheless, it was elevated compared to the sham animals (P < 0.001) on the 14th day. There was no statistical difference in the extent of lysosomal damage between sham and control groups on different days (P > 0.05). On the other hand, the extent of lysosomal damage in the morphine-treated neuropathic pain model rats was lower than that of the untreated neuropathic pain model animals (P < 0.001).
As shown in
Figure 3E, lysosomal membrane damage in the etanercept-treated neuropathic pain model rats was markedly higher than in the sham animals (
P < 0.001) on the 6th, 10th, and 14th days after induction of neuropathic pain. There was no statistical difference in the extent of lysosomal damage between sham and control groups on different days (
P > 0.05). However, the extent of lysosomal damage was lower in the etanercept-treated neuropathic pain model animals than in the untreated neuropathic pain model rats (
P < 0.001).