Chemicals
Bovine serum albumin (BSA), collagenase (from Clostridium histolyticum), N-Ethylmaleimide (NEM), O-phthalaldehyde (OPT), and rhodamine 123 were purchased from Sigma-Al- drich Co. (Taufkirchen, Germany). All other chemicals were of the highest commercial grade available.
Animals
Male Sprague-Dawley rats weighing 180 to 200 g were housed in ventilated plastic cages over PWI 8-16 hardwood bedding. There were 12 air changes per h, 12 h light photoperiods, an environmental temperature of 21–23 °C, and a relative humidity of 50–60 %. The animals were fed a standard normal chow diet and given tap water ad libitum. Principles of laboratory animal care (NIH publication No. 85-23, revised 1985) were followed. All experiments were conducted according to the ethical standards and protocols approved by the Committee of Animal Experimentation of Shahid Beheshti University of Medical Sciences, Tehran, Iran (protocol approval number: 88/01/94/6555).
Induction of neuropathic pain
Under 10% chloral hydrate (3 mL/kg) anesthesia the skin on the lateral surface of the thigh was incised and a section made directly through the biceps femoris muscle exposing the sciatic nerve and its three terminal branches: the sural, common peroneal, and tibial nerves. The Spared Nerve Injury (SNI) procedure comprised an axotomy and ligation of the tibial and common peroneal nerves leaving the sural nerve intact. The common peroneal and the tibial nerves were tight-ligated with 5.0 silk and sectioned distal to the ligation, removing 2–4 mm of the distal nerve stump. Great care was taken to avoid any contact with or stretching of the intact sural nerve. Muscle and skin were closed in two layers. Crush controls (spared nerve crush group) were performed as above, except that the tibial and common peroneal nerves were crushed for 30 s by a pair of small arterial forceps with smooth protective pads over the blades. At the end of this procedure the nerves were completely flattened and transparent. Sham controls involved exposure of the sciatic nerve and its branches without any lesion (
20).
Mechanical hyperalgesia
After SNI pain evaluation was performed to confirm the occurrence of allodynia or hyperalgesia in the rat model. With the animals on the elevated grid, a pinprick test was performed using a safety pin. The lateral part of the plantar surface of the paw was briefly stimulated at an intensity sufficient to indent but not penetrate the skin (pin-prick test). The duration of paw withdrawal was recorded, with an arbitrary minimal time of 0.5 s (for the brief normal response) and a maximal cut-off of l0 s (
21).
Our results confirmed the induction of hyperalgesia in the neuropathic pain rat model. The withdrawal duration (in seconds) after a pin prick stimulus to the lateral plantar surface of the paw increased significantly after SNI. The SNI group’s elevated response (pin-prick hyperalgesia) persisted for the entire time the animals were monitored (2 weeks) (Data not shown).
Study design
The rats were randomly divided into three different groups of 24 rats each. Group 1 (Control) animals fed with a standard diet and served as a normal control without surgery. Group 2 (Sham) rats that the SNI surgery was performed and was exposed to the sciatic nerve and its three terminal branches but without ligated and cutoff the common peroneal and tibial nerves. Group 3 (Case or neuropathic pain model) rats that the SNI surgery was performed along with ligated and cutoff the common peroneal and tibial nerves.
Glial cells isolation
On the second, 6
th, 10
th, and 14
th days after the surgery, the glia cells were taken. For this, brain was removed and placed in PBS buffer, hemispheres were separated and the bean-shaped hippocampi were isolated. Hippocampus was placed in dishes containing PBS, gently minced and pipetting up and down then incubated in a buffer contains trypsin-EDTA for 5 min at 37 °C. Then, it was smoothly shacked and again incubated for additional 5 min. Afterward, DMEM medium was added. The prepared suspension passed through the funnel (70 mesh, 25 micron) by the vacuum pump for elimination of neurons and oligodendrocytes. The cells were suspended at a density of 10
6 cells/mL in round bottomed flasks rotating in a water bath maintained at 37 °C in Krebs–Henseleit buffer (pH 7.4), supplemented with 12.5 mM HEPES under an atmosphere of 10% O
2, 85% N2, and 5% CO2. The cell suspensions were poured into round bottom flasks and were placed in a bioreactor for 15 min. Glia cells was placed in 1 mL of each in eppendorf tubes and was centrifuged for 1 min at 1000 rpm (
22).
Glial cell identification
To confirm that a majority of isolated cells were glial cells, cells were analyzed for the expression of astrocyte marker glial fibrillary acidic protein (GFAP) through antibody staining. GFAP immunostained samples confirms that 90% of cells present are GFAP positive cells (Immunostaining data not shown).
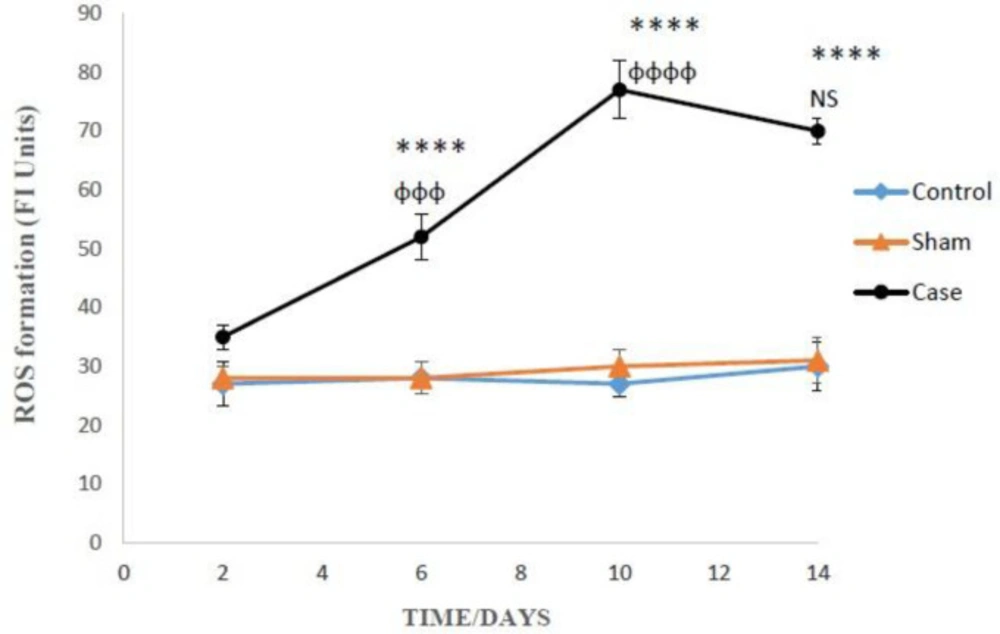
Determination of reactive oxygen spices (ROS (
To measure the rate of glial cells ROS formation, non-fluorescent dichlorofluorescin diacetate (DCFH-DA) was used that hydrolyze to dichlorofluorescin (DCFH) (non-fluorescent) inside the cells. DCFH reacted with intracellular ROS and converted to the highly fluorescent dichlorofluorescein (DCF) that outflow the cell. For this purpose, 3 ml of cells were centrifuged for 1 min at 1000, then mixed with 3 mL of DCFH diacetate. The suspension was shaken gently and incubated for 10 min at 37 °C. The amount of ROS was measured according to fluorescence intensity by the fluorescence spectrometer (Excitation: 500 nm, Emission: 520 nm). The results were expressed as fluorescent intensity per 10
6 cells (
23).
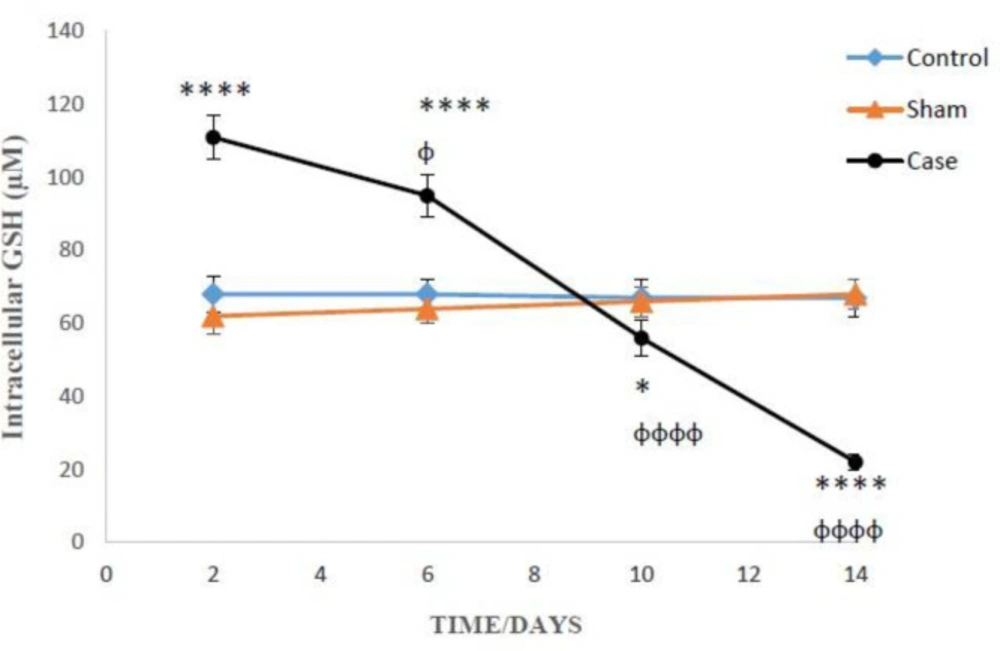
Determination of intracellular reduced glutathione (GSH)
The amounts of reduced and oxidized glutathione were assessed by the spectrofluorometric method with a few modifications (
24). For the measurement of GSH, 1 mL of the cell suspension was centrifuged (1000 rpm, 1 min), and the supernatant was removed. Trichloroacetic acid (10%) was added to the cell pellet. After centrifugation (11000 rpm, 1 min), 4.5 mL of the incubation buffer (pH 8) was added to the supernatant (0.5 mL) then mixed with 100 µL of OPT (1 mg/mL). Incubation buffer (1.8 mL) was added to 100 µl of diluted supernatant in the previous step and incubated for 15 min at room temperature. The intensity was measured at Excitation: 350 nm and Emission: 420 nm.
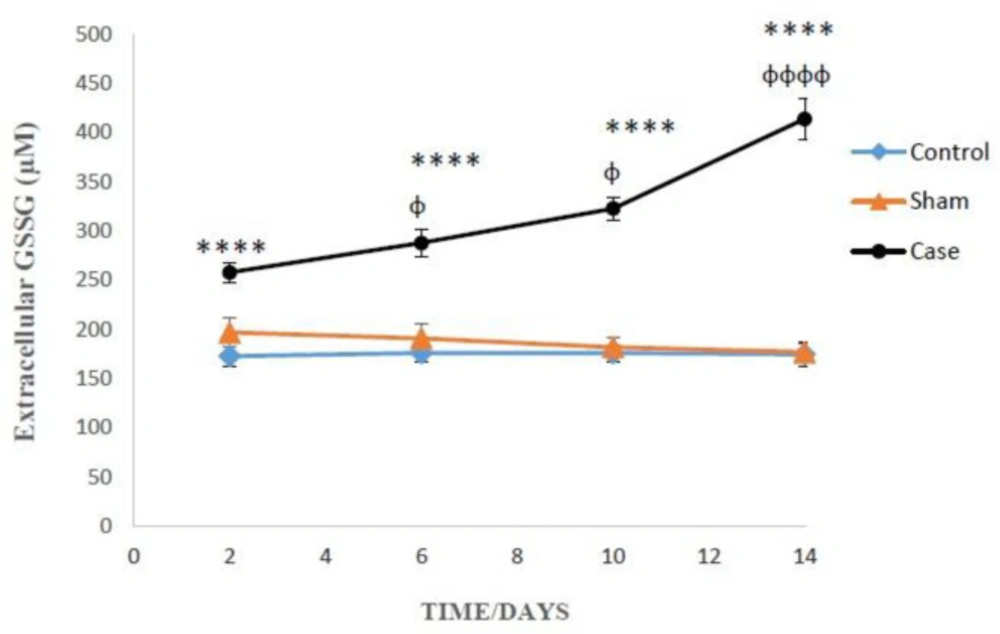
Measurement of extracellular oxidized glutathione (GSSG)
1ml of the cell suspension centrifuged (1000 rpm, 1 min) and the supernatant was mixed with trichloroacetic acid 10%. After centrifugation (11000 rpm, min 1), 0.5 mL of the supernatant from the previous step mixed with NEM (0.04 M, 200 µM) for 30 min at room temperature. Measurement was similar to the GSH determination, except for incubation buffer that was replaced by NaOH (0.1 N) instead as diluents. The amount of GSH and GSSG was calculated by calibration curves (
24).
Determination of glutathione precursors for compensation biosynthesis
After the incubation of glial cells with DMEM medium, the flasks were centrifuged (1000 rpm, 1 min). Incubation buffer (10 mL) was added to the cell pellet and the cell suspension again was transferred into the flask, then incubated with two glutathione precursors, methionine and betaine, for 3 h. The level of GSH was measured by the method described in the previous section.
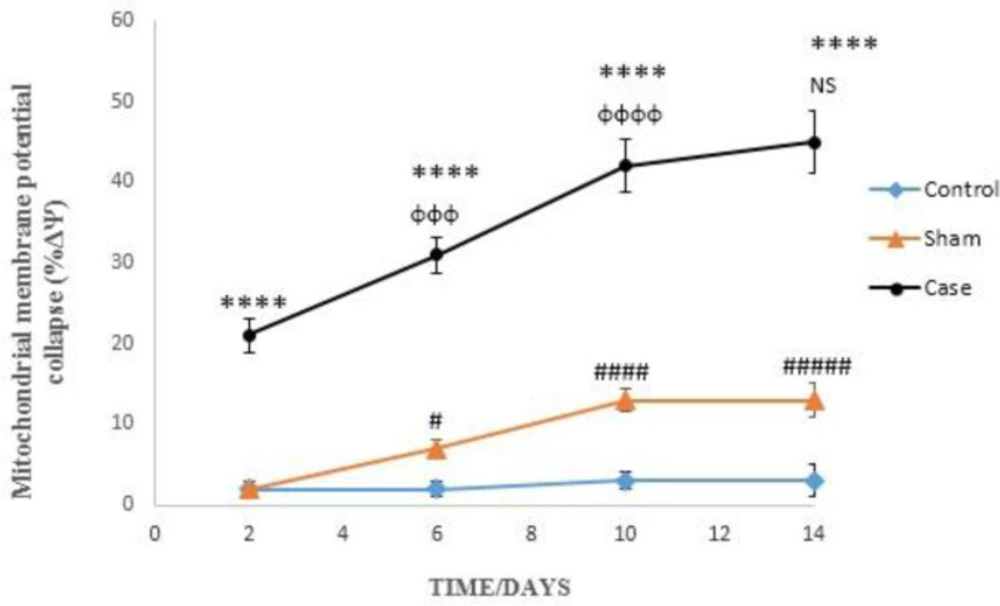
Mitochondrial membrane potential collapse (∆Ψm%) measurement
For the determination of mitochondrial membrane potential decline, cationic flourogenic probe Rhodamine 123 was used (
25). Cell suspension (0.5 mL) was incubated and centrifuged for 1 min at 1000 rpm. The supernatant was removed and Rhodamine (1.5 µM) incubated for 10 min at 37 °C. Then, fluorescence intensity was determined at Excitation: 490 nm and Emission: 520 nm. The capacity of mitochondria to take up the Rhodamine 123 was calculated as the fluorescence difference between the control and test cells.
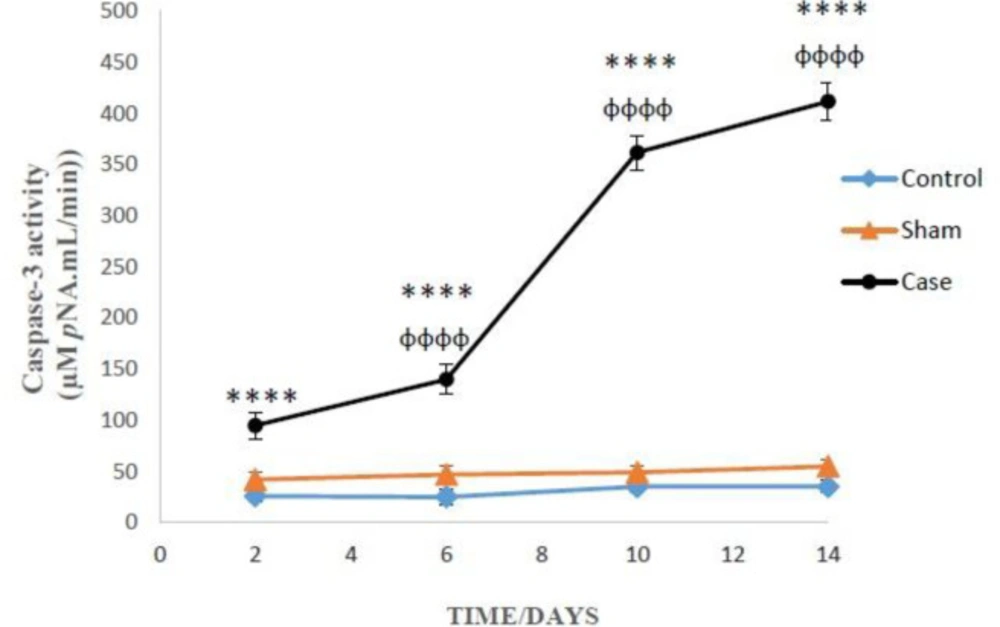
Measurement of Caspase-3 Activity
Caspase-3 activity was assessed in glial cells lysate by ‘‘Sigma’s caspase-3 assay kit (CASP-3-C)’’ (
26). This method is based on the hydrolysis of a peptide substrate (AC-DEVD-pNA) by caspase-3 that leads to release the para-nitro aniline (pNA) moiety. The concentration of pNA released from the substrate was determined by absorption at 405 nm (
27).
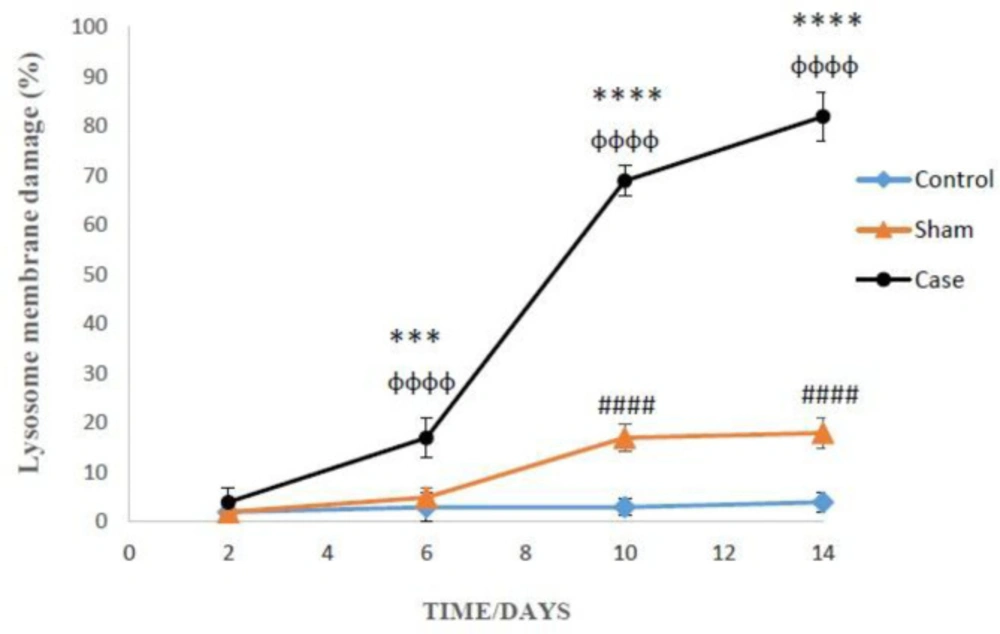
Assessment of lysosomal membrane stability
Lysosomal membrane stability was measured using acridine orange dye (
28). In this method, 1 ml of cell suspension was mixed with 2 mL acridine orange (5 µg/mL) and incubated for 10 min at 37 °C. Then, the fluorescence intensity from distribution of acridine orange to the cytosol was determined at wavelength Excitation: 495 nm: and Emission: 530 nm.
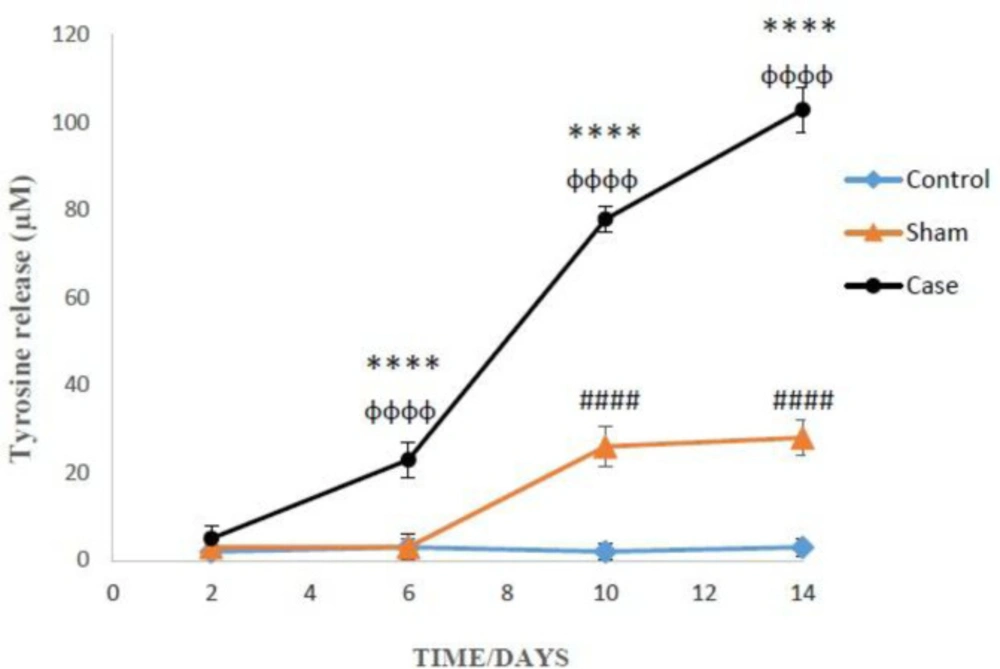
Determination of proteolysis
Proteolysis was measured by fluorescence intensity from tyrosine released into the extracellular space (
29). Each of the samples was added trichloroacetic acid (20%) and incubated for 12 h at 4 °C, then, centrifuged (13250 rpm, 10 min). 1-Nitroso-2-naphthol (1 mL) and 1 mL of nitrite acid (10 mg/mL NaNo
2 in HNO
3 20%) were added to the supernatant and incubated for 30 min at 37 °C. After the addition of ethylene chloride, the suspension was shaken strongly, and again centrifuged (13250 rpm, 10 min). The fluorescence intensity was measured at Excitation: 460 nm and Emission: 570 nm. The amount of tyrosine was calculated by tyrosine calibration curve (0-100 µM).
Statistical analysis
The homogeneity of variances was tested using Levene’s test. Results were expressed as mean ± SD. All data were statistically analyzed by two-way ANOVA followed by Bonferroni post hoc test using GraphPad Prism 8.0. The results with level of significance (P < 0.05) were regarded as significant.