Internal validation
The validity of the AutoDock4.2 method for docking of selected CNS drugs inside their targets was interpreted in terms of RMSD of ligand atoms in re-docked and crystallographic conformations (
Table 3). According to the results, all the crystallographic files could pass the filter since AutoDock4.2 could successfully predict the crystallographic (bioactive) conformation (
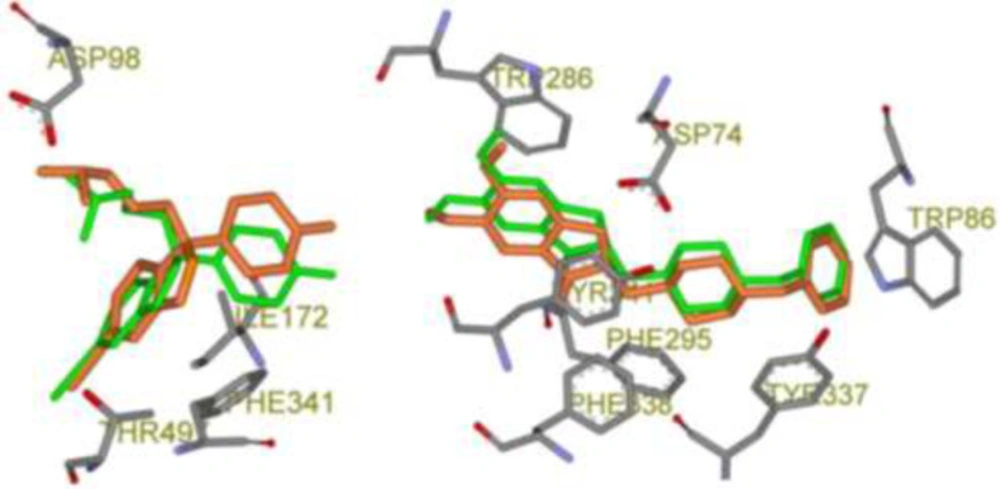
23) within 50 independent GA runs and 2.5 × 10⁶ maximum number evaluations incorporated into LGA. In confirmation of the obtained results, 3D schematic representations of validation results with the best RMSD poses for each drug is depicted in
Figure 2.
Model development and statistical analysis
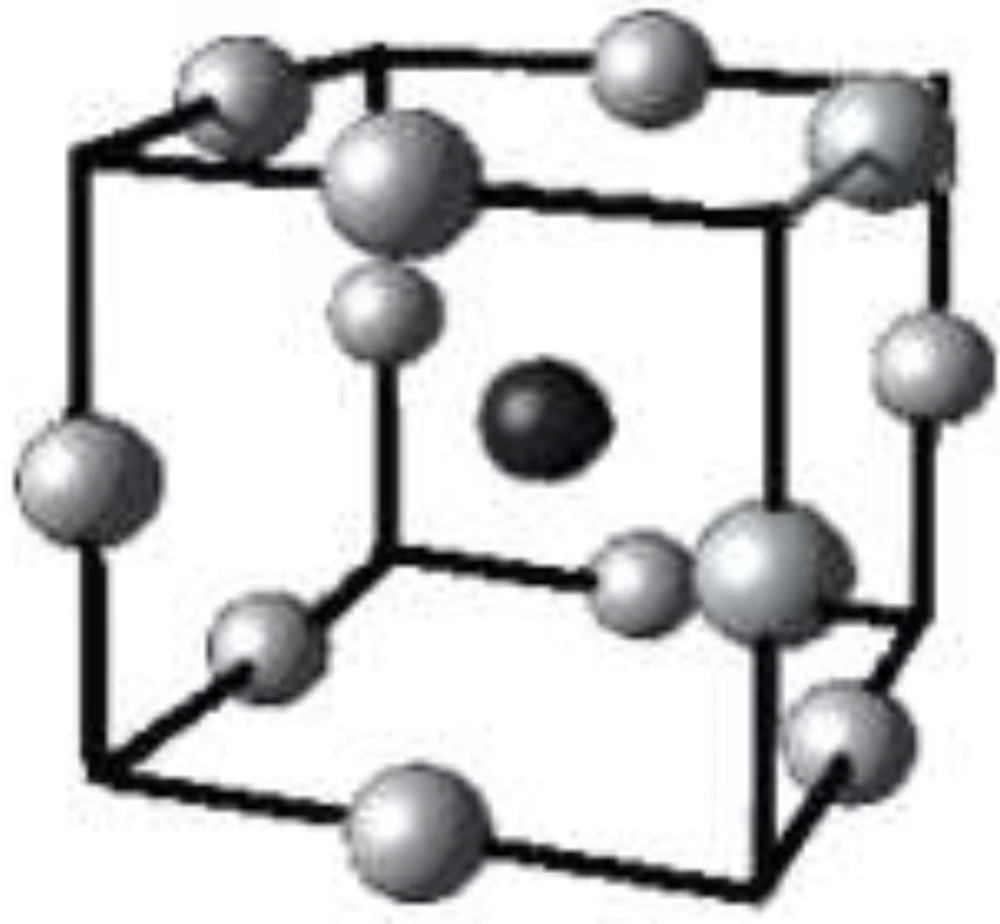
Three-level Box-Behnken designs are generated by combining two-level factorial designs and incomplete block designs (
26). The technique brings about a few benefits, such as desirable statistical properties and, most importantly, the requirement for only a fraction of trials needed for a 3-level factorial. Run number of Box-Behnken design can be estimated according to Equation 5:
(5)
k is the factor number and c
p is the replicate number of the central point. In a cubic scheme of Box-Behnken design (
Figure 3), a model consists of a central point and the middle points of the edges.
Citalopram
The ANOVA results for matrix responses (ΔpK
i 2.298-4.111) are summarized in
Table 4. Statistical analysis proved the quadratic polynomial model to be highly significant (p-value < 0.0001) for data fitting. The acquired model in terms of coded values is illustrated by Equation 6:
(6)
As referred, for citalopram, the quadratic model was capable of describing the relation between ΔpKi as a dependent variable and factors B (AutoGrid space), E (Drug optimization method), and F (Target flexibility) as independent variables. In the quadratic model, factors and second-order interferences with p-values larger than 0.05 were eliminated by stepwise selection. The lack of fit of the model (1.14) implied that it was not significant with regard to the pure error. Pred R-squared was estimated to be 0.9789, and moreover, it was in reasonable agreement with Adj R-squared (0.9842). A good correlation between factors and responses could be confirmed by the Adj R-squared value, and it meant that most of the variations of response were predictable by model. Adequate precision measures the signal-to-noise ratio and the estimated amount (43.939) was indicative of an adequate signal (A ratio greater than 4 is desirable). On the basis of such model characteristics, it was deduced that obtained model could navigate the design space.
According to ANOVA results (summarized in
Table 4), ΔpK
i sensitivity to the effective factors could be ranked as E>B>>C>D>A>F, and factors C, D, A & F were detected as insignificant model terms (
p-value > 0.1). Factors E (drug optimization method) and B (grid spacing) were significant model terms, while factor E (F-value 2204.33) exhibited extremely significant performance. High interactive effects of factors E and F have been observed on the response (
p-value < 0.0001). Quaternion degrees for drug (factor C) was recognized as an insignificant factor in docking of citalopram into SERT. This indicated that docking accuracy was not dependent on the flipping angle of the citalopram molecule. Lack of significant sensitivity toward variations of factor A (torsion degrees for drug) may be interpreted by the fact that docking simulations are commonly initialized by the co-crystallographic conformations, where fitted binding pose of the drug is applied to run the docking procedure. Such a result may have a practical outcome in docking studies; to achieve a desirable result within reasonable computation times, one might set torsions degrees for the ligand at larger values for more rigid structures.
Drug optimization method
Factor E (drug optimization method) was estimated to be the most significant model term in docking of citalopram into ST binding site. The observed highly significant effect might be attributed to the chiral center of citalopram and hence its determinant role in pre-docking conformation of the drug. At first glance, equation 6 indicated that higher docking accuracies could be expected from AM1-based optimization of the citalopram structure method, but due to the highly significant interactive effect of E and F, the best combination toward lowest ΔpKi (2.298) was achieved by PM3 optimization method (coded level of +1). Such a result is in accordance with the inversion barriers of trivalent nitrogen in nitrogen-containing compounds, which are commonly low for AM1 and high for PM3. An apparent consequence is that some nitrogen geometries may be predicted to be flat by AM1 and pyramidal by PM3. Hence it seemed that PM3 could represent a relatively appropriate description of nitrogen geometry and hence more realistic binding interactions with the target.
A common belief is that, unlike ligand-based drug design techniques in which the initial geometry of a bioactive molecule is important, structure-based approaches such as docking are not seriously dependent on the primary optimization of ligand. Indeed beginning a docking practice with a co-crystallographic binding pose of a ligand is a common approach. A rationale is that during molecular docking simulations, molecular conformations are varied via changes in torsion, translation, and quaternion. But the different scenario that was observed with the present study was the highly significant effect of the optimization method (Factor E) on docking output. On the basis of obtained results, it may be assumed that chiral molecules, particularly those bearing nitrogen atoms within a nonpolar scaffold, can undergo an appropriate semi-empirical method such as PM3 to afford better results.
Target flexibility
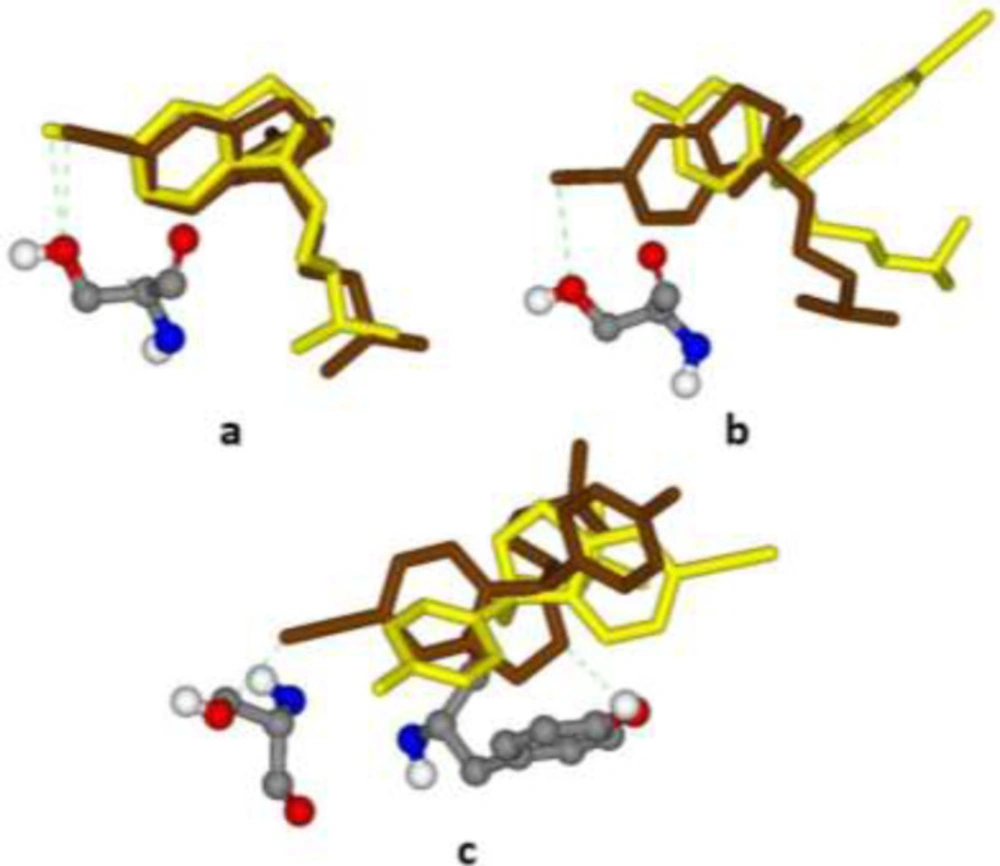
Target flexibility was incorporated into our modeling study via considering different holo-structures of SERT. The results of the statistical analysis were in accordance with what we expected. Higher docking accuracies could be attained via docking of citalopram into the binding site of the SERT structure with the highest resolution (PDB code 5I6X). It was found that decreasing the resolution of SERT from 3.14 Å (5I6X) to 3.24 Å (5I73) reduced docking accuracies (
Figure 9). However,, future studies may be directed toward selecting more induced fit models of the protein and statistical analysis through central composite design (CCD techniques).
Grid spacing
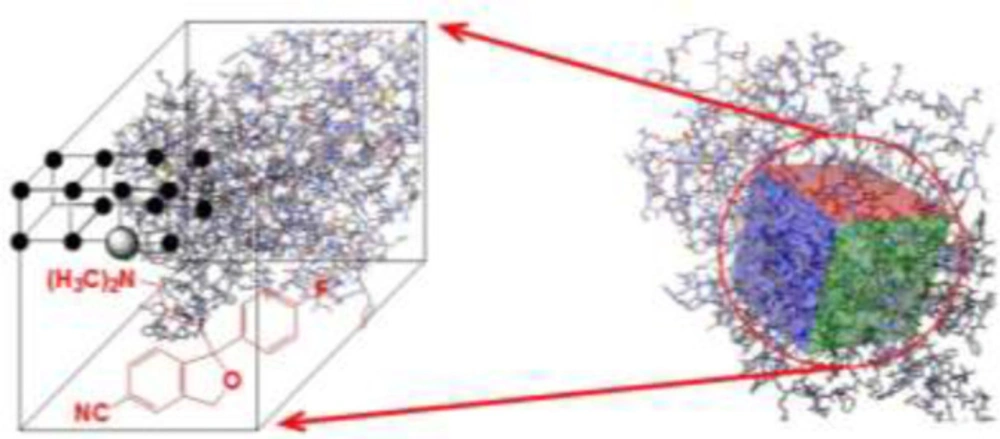
A grid map comprises a 3D frame of regularly spaced points for incorporating the target. On the basis of ligand atom types, a probe atom corresponding to the atom type is placed at each grid point, and the energy of interaction of each probe atom (grid point) with surrounding macromolecular atoms is estimated and assigned to the corresponding grid point (
24) (
Figure 5). Grid spacing (Factor B) is designated as the distance between adjacent grid points. Grid spacing is the distance between adjacent AutoGrid points. ANOVA showed that if the grid spacing is set to lower values, higher AutoDock accuracies for the citalopram-SERT complex will be achieved in confirmation of previous results (
13). Lower grid spacings increase the precision of probe scanning within the designated grid box, and this would probably be translated into better SERT inhibition constants.
Interactive factor effects
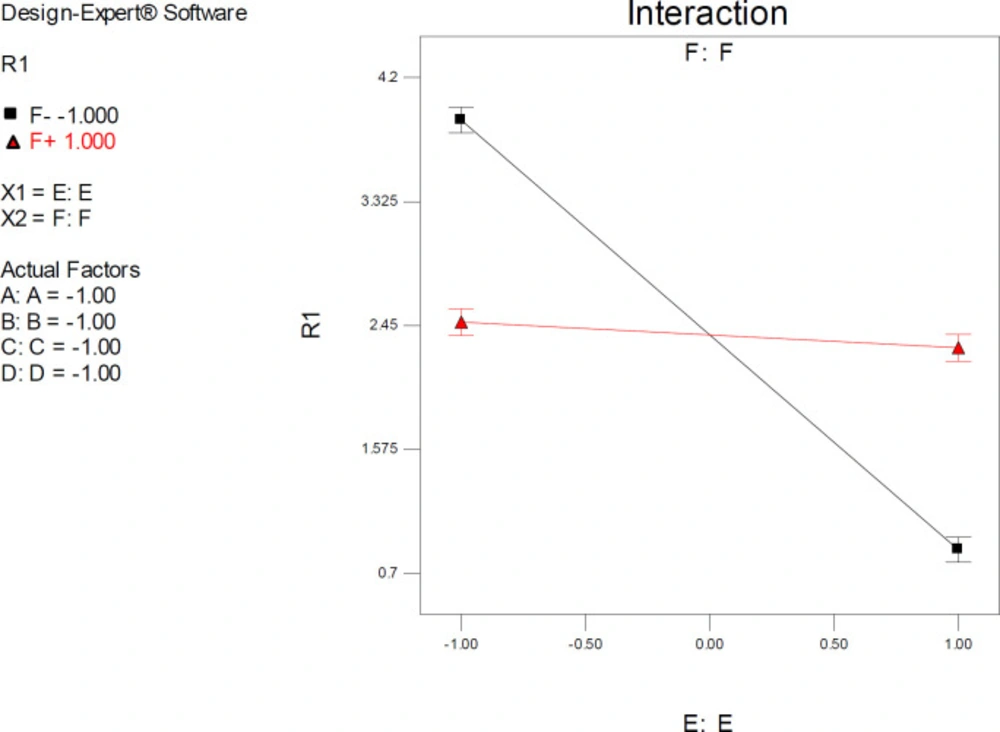
Factor interaction is likely to occur whenever different responses are generated on the basis of different settings of two factors. This dependence of factor levels to each other may be best interpreted by interaction plots (
Figure 6). In this case, interactive factors will be depicted by two non-parallel lines, implying that the effect of one factor depends on the level of the other. ANOVA results proved highly significant interactive effects between factors E (drug optimization method) and F (target flexibility) with
p-value < 0.0001.
It was indicated that the significant effect of factor E on estimated SERT inhibition constants was more pronounced at lower levels of F. As could be seen from the graph in
Figure 6, the red line is indicative of the effect of the drug optimization method (F) within a SERT 3D structure with PDB code 5I6X and the black line represents the effect of drug optimization method (F) within a SERT 3D structure with PDB code 5I73. Higher docking accuracies might be expected when other factors (A, B, C & D) were held at their lower levels (such as factor F) (
Figure 6).
Interaction plots displayed a cross point, and the location of this point showed a distinctive situation within model space in which relatively similar SERT inhibition constants could be expected by docking into all PDB driven 3D SER structures (levels -1 & +1) if the co-crystallographic conformation of citalopram is set as the starting point (Mid-level of factor E).
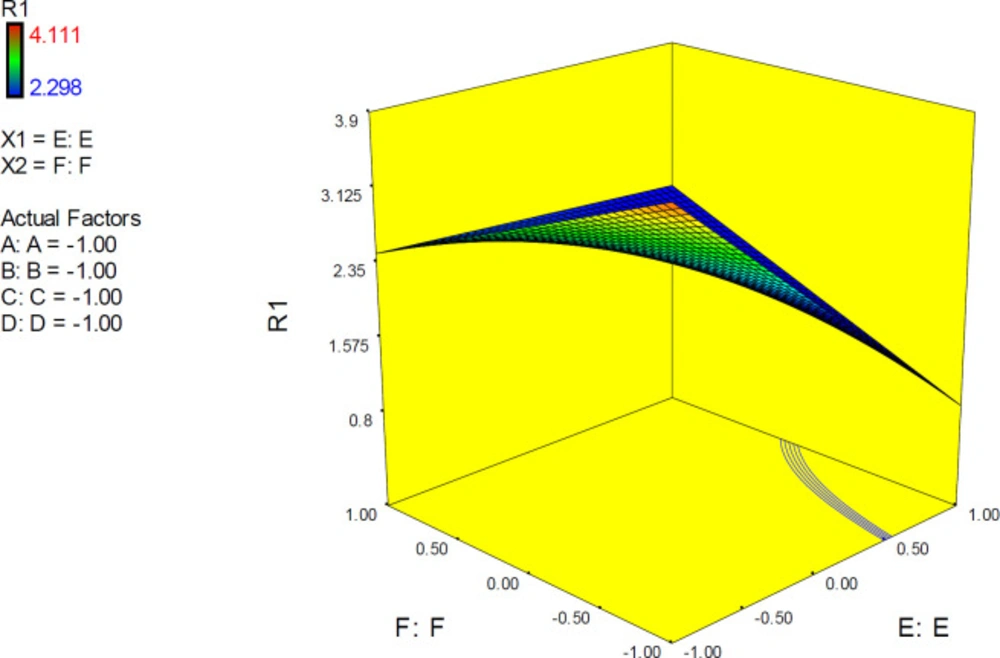
The 3D surface is known as the “response surface” provided a perspective visualization of factor effects on the response at different levels of other factors. 3D response plots were developed to indicate the simultaneous effect of interactive term EF on docking accuracy (
Figure 7). In confirmation of our previous results, a surface was steep and indicated that the interaction between two factors was highly significant. More accurate SERT inhibition constants might be predicted by running the PM3 semi-empirical method (higher levels of factor E) at declined levels of other factors.
Numerical optimization
DOE provides a series of solutions (optimum combinations of factor levels) to achieve the most desirable responses. For this purpose, optimization criteria for levels of factors A, B, C, and D were set in range (spanning from -1 to +1) while factors E (drug optimization method) and F (target flexibility) were set at precise levels -1, 0 and +1 since they were categorical but not numerical factors. With the aim of achieving optimized solutions, the goal for response (ΔpKi) was primarily set at a minimum.
It should be noted that in each case, solutions with desirability equal to 1 were picked up as optimum. Desirability is an objective function ranging from 0 (worst condition) to 1 (ideal case). This function transforms each response value to a desirability index. The program looks for the largest desirability index and presents a series of solutions that best maximize the desirability index. Obtained results showed that the most accurate predictions of SERT inhibition constant (minimum ΔpK
i) could be envisaged through various simulations conditions, and careful selection of factors led to highly enhanced accurate responses (
Table 5). However, it should be emphasized that choosing the best solution depends on financial and time restrictions. A characteristic feature in all of the proposed docking solutions is the lower level of factor F and a higher level of factor E, which confirmed the previous results of this study.
Donepezil
In the case of donepezil, ANOVA results for the responses (ΔpK
i 0.240-5.465) are summarized in
Table 6. Statistical analysis proved the quadratic polynomial model to be highly significant with a low probability value (
p-value < 0.0001) for data fitting (Equation 7 in terms of coded values).
(7)
Lack of fit F-value (1.74) implied that lack of fit was not significant with regard to the pure error. There is a 13.36% chance that a “Lack of Fit F-value” this large could occur due to noise. Pred R-squared (0.9820) was in reasonable agreement with Adj R-squared (0.9888). A good correlation between factors and responses could be confirmed by the Adj R-squared value. Adequate precision (43.939) was indicative of an adequate signal. On the basis of obtained data, it was deduced that model could navigate the design space.
According to ANOVA results (summarized in
Table 6), factor effects could be ranked as B>E>>D>C>A>F while D, C, A & F were insignificant model terms (
p-value > 0.1). It was found that factors B (grid spacing) and E (drug optimization method) were significant model terms. Among the pairwise interactions, EF was the significant model term (
p-value<0.0001) followed by BE (
p-value 0.0102).
Grid spacing
Factor B (grid spacing) was the most significant model term. The polynomial quadratic model (Equation 7) predicted better AChE inhibition constants for donepezil at shorter grid spacings (0.3 Å). The effect was similar to citalopram but more noticeable in the case of donepezil. One possible explanation is the presence of bulky molecular structure of donepezil that necessitates shorter grid spacings in docking simulations.
Drug optimization method
Algebraic signs of quadratic model terms (Equation 7) indicated that the application could expect higher docking accuracies of the PM3 method for primary optimization of donepezil structure. Comparative statistical inspection of the results showed that with regard to p-values, although being significant, the effect of factor E is more significant for citalopram. This may be attributed to the following explanations:
Unlike citalopram, donepezil includes one nitrogen atom within a hydrophobic structural pattern and inversion barriers of trivalent nitrogen for AM1 and PM3 semi-empirical methods, less dependent on the PM3 optimization method might be explainable.
More flexible structure of citalopram (more active torsions) with regard to donepezil.
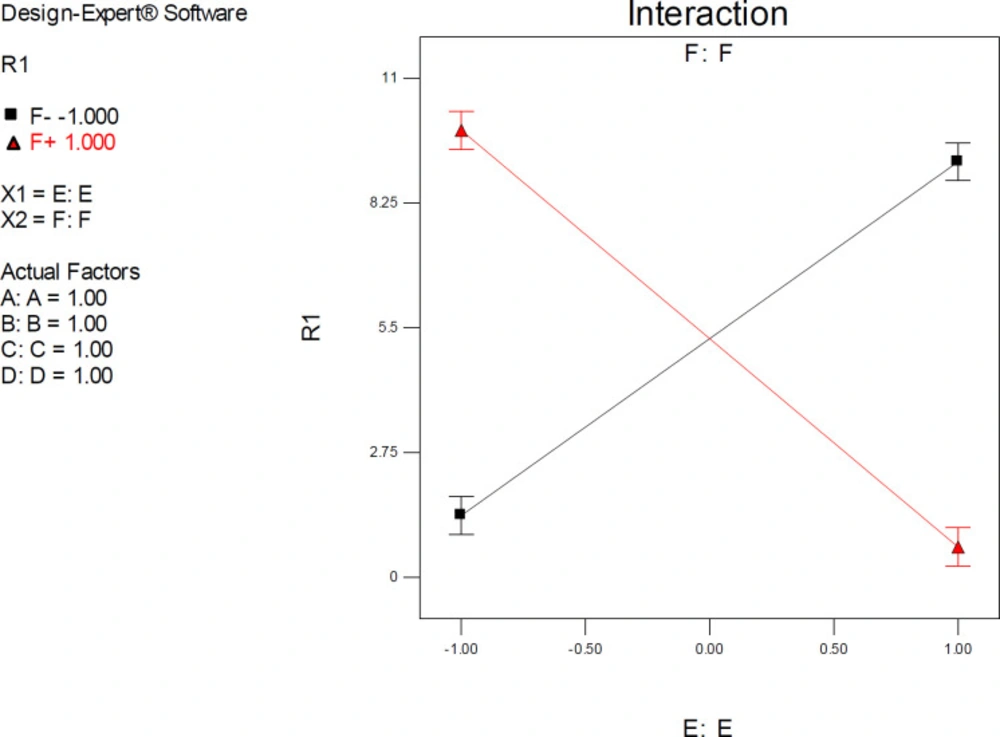
Interactive factor effects
ANOVA results demonstrated a significant pairwise interactive effect between factors E and F (
p-value < 0.0001). The significant effect of factor E was most pronounced when donepezil was docked into the AChE model that possessed the highest resolution (PDB 4M0E) (
Figure 8). The observed interaction pattern was different from that of citalopram. More accurate enzyme inhibitory activities for donepezil could be expected within two scenarios; AM1-based optimization of drug molecules and docking simulations on 4EY7 or PM3-based optimization of a drug molecule with docking simulations on 4M0E.
All the interaction plots of EF interactive effects displayed a cross point on mid-levels of factor E (Initial Co-crystallographic conformation of donepezil). To explain more, when co-crystallographic conformation of donepezil was used as the starting point for docking simulations, the estimated AChE inhibition constant was not seriously dependent on the selected PDB model of the target. Such interferences might not be detected via applying one factor at each time method.
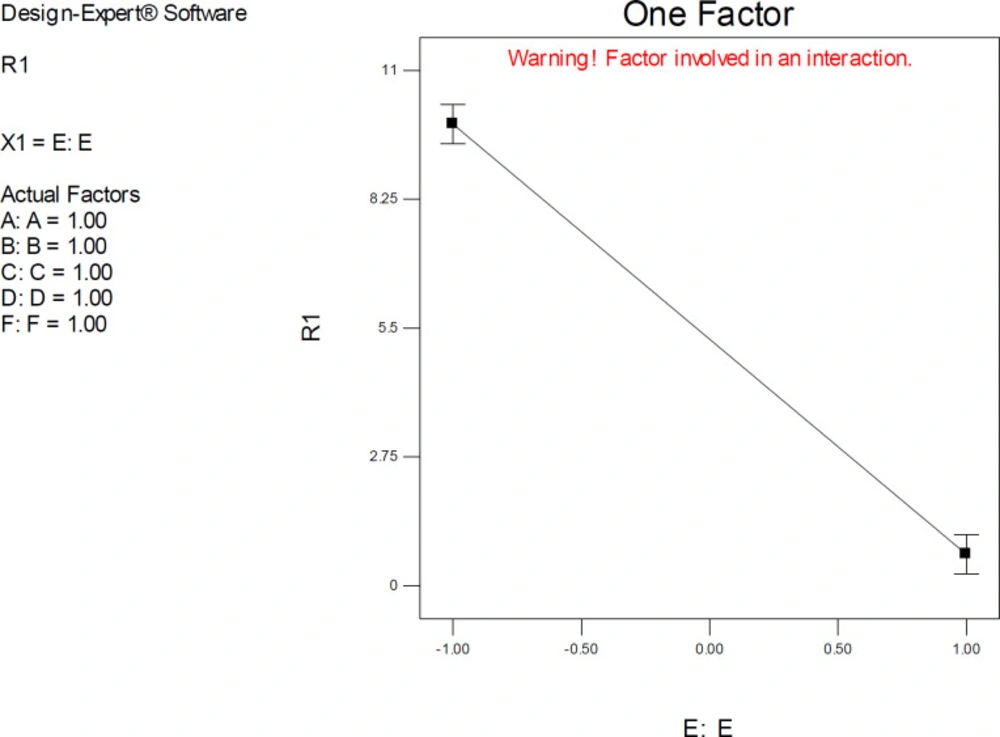
One-factor plots confirmed the direction of interactive effects and indicated the highly significant effect of factor E was detected when other factors were held at their upper levels.
3D plots representing simultaneous effects of factors B and E at different levels of other factors are depicted in
Figure 10. In upper levels of other factors, more desirable docking accuracies were expected at higher levels of E (PM3 or PM3-like optimization methods). The surface in mid-levels of factors is relatively smooth that was indicative of a less significant interactive effect between B and E.
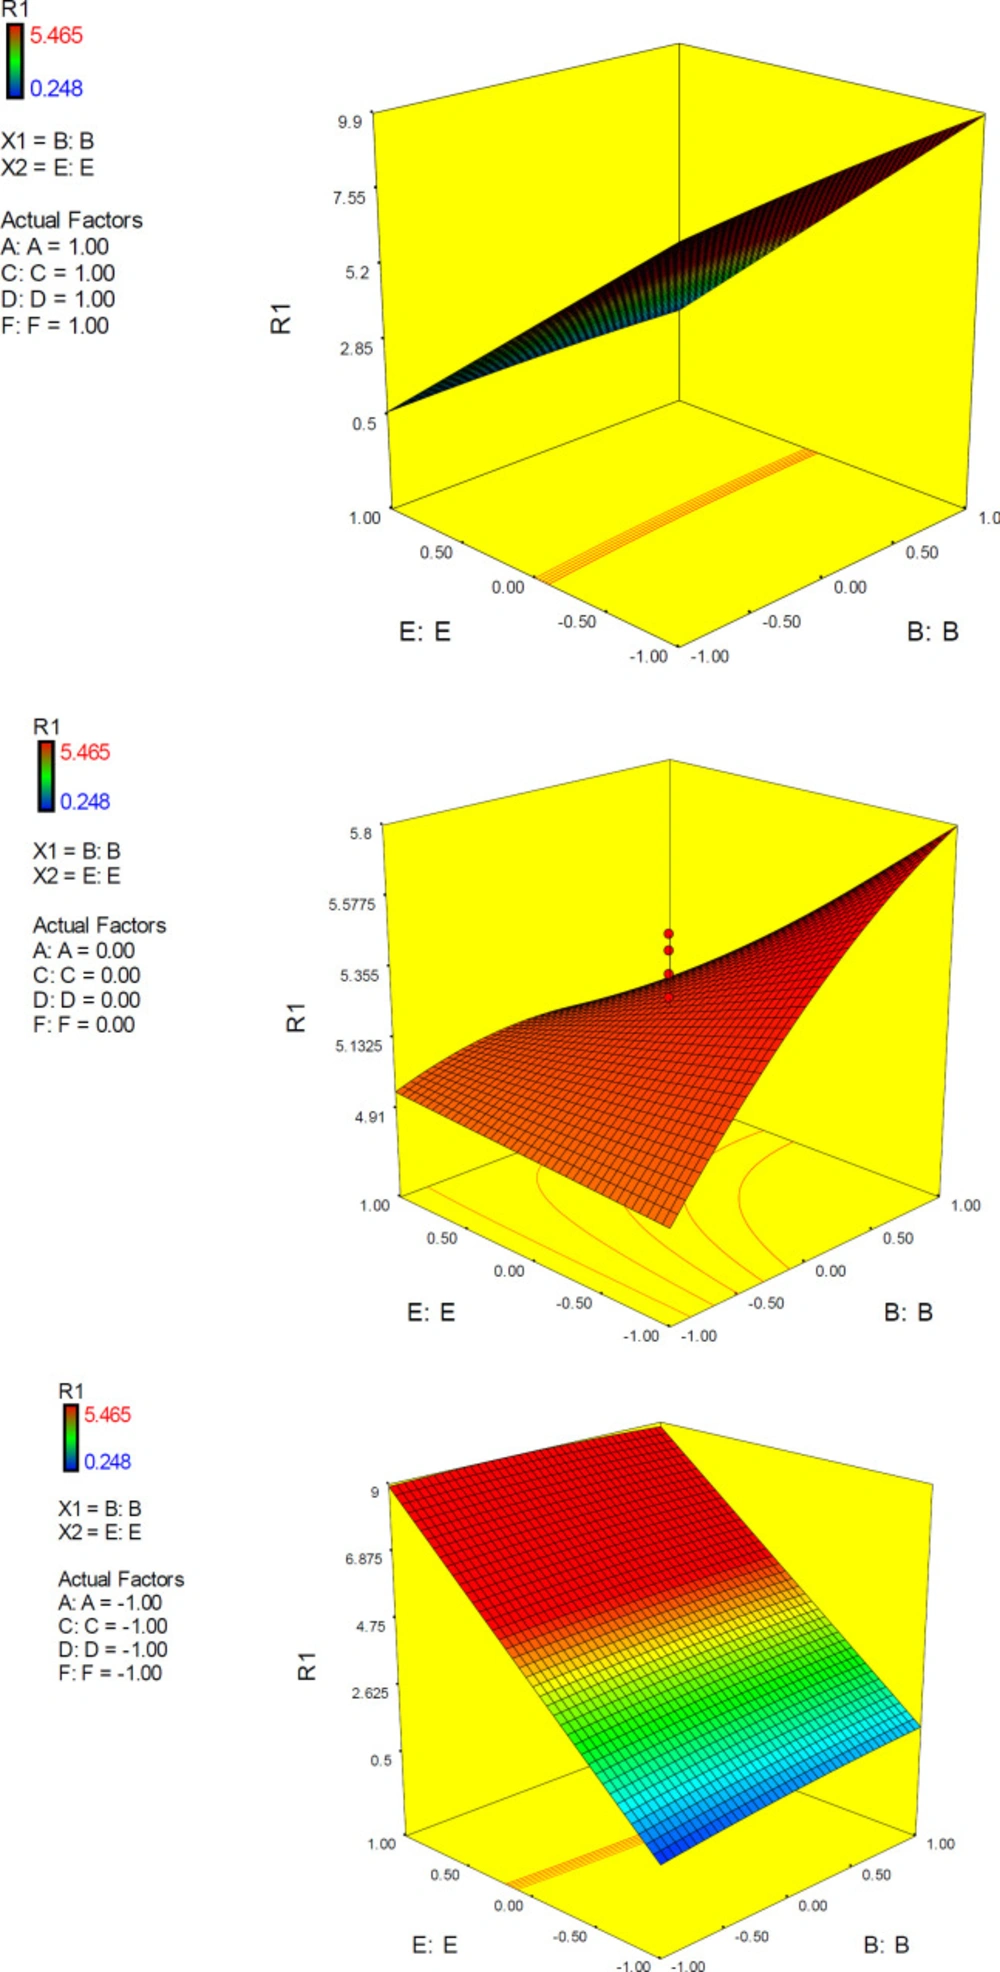
3D response plots were also developed to interpret the interactive EF effect on docking accuracy. As could be seen from the plots (
Figure 11), docking accuracy tended to increase at higher levels of factor E as the levels of other factors declined to lower levels. 3D plots obviously showed that when factor levels were held at their mid-levels, no desirable docking accuracy would be expected. 3D surface plots in lower levels of factors A, C, D and F showed that desirable docking accuracies could be attained at lower levels of factor E and any level of factor B.
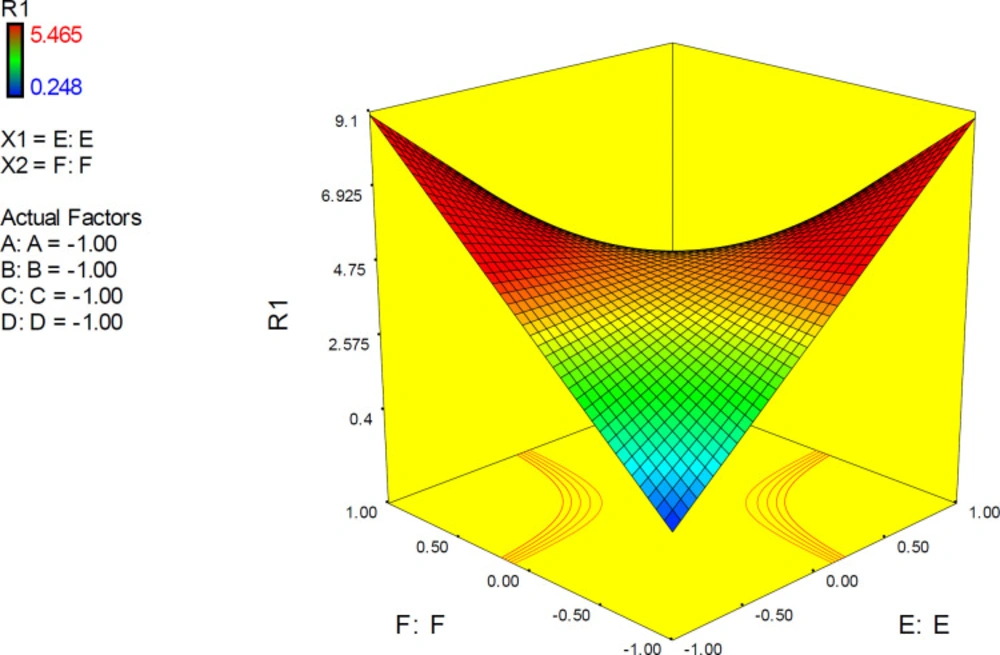
3D response plots were also applied to indicate the simultaneous effect of interactive term EF on docking accuracy (
Figure 11). It was found that responses to factor levels fitted a hyperbolic pattern with relative symmetric distribution and steep surfaces. This could be related to the highly significant effect of EF on the response (
p-value < 0.0001), which is not seriously dependent on the levels of other factors. As could be seen from the plots, more reliable results may be assumed at lower levels of both E and F or higher levels of both E and F. Such interaction pattern can be demonstrated that when higher resolution PDB conformation of AChE is used for docking of donepezil, it would be better to optimize the drug structure with PM3 method while the reverse is true when the lower resolution of AChE conformation is applied. This was also previously confirmed by the interaction plots.
Numerical optimization
All the optimization criteria for factors A, B, C, D, E, and F were set as before, and the goal for docking accuracy (ΔpK
i) was fixed at a minimum. On the basis of offered optimized solutions, maximum docking accuracy (minimum ΔpK
i) might be achievable via various conditions (
Table 7). However, choosing the best solution depends on the financial and time limitations.
In confirmation of ANOVA results, it was revealed that the most accurate predictions of AChE inhibition constant (minimum ΔpKi) could be envisaged when both of the factors F and E were set at their upper or lower levels.
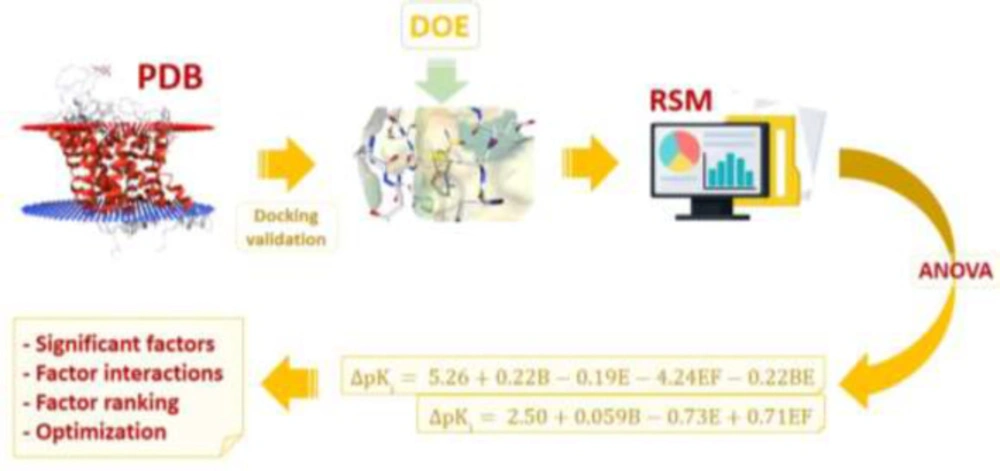
Hierarchical view of the multi-step strategy depicting the application of response surface method (RSM) for molecular docking simulations of CNS drugs citalopram and donepezil into the binding site of validated physiological targets (Serotonin transporter and acetylcholinesterase) retrieved from Brookhaven protein data bank (PDB); Subsequent to target identification, the first step included docking validation for evaluating AutoDock4.2 capability in binding pose prediction. Design of experiments (DOE) for docking trials was performed by Box-Behnken method for six determinant factors; (A) torsion degrees for ligands, (B) grid spacing, (C) quaternion degrees for ligands, (D) No. translation, (E) drug optimization method and (F) target flexibility. Outputs of designed docking trials (Accuracy of target inhibition constant or Δpki) were subjected to analysis of variance (ANOVA) to extract statistical indices and acquire polynomial equation models describing Δpki in association with methodological factors. The final step was dedicated to prioritizing individual and interactive factor effects and numerical optimization to propose enhanced docking simulations
Schematic 3D representation of AutoDock4.2 validation results with key interactive residues of the target, Green stick: Crystallographic pose and Orange stick: Docked pose; Left: Citalopram-AChE complex (PDB code: 5I73, RMSD: 0.82 Å) and Right: Donepezil-SERT complex (PDB code: 4EY7, RMSD: 0.46 Å).
Cubic scheme of Box-Behnken design
Best (Brown stick) and worst (Yellow stick) binding poses of citalopram within different induced fit models of the serotonin transporter (SERT) along with interacted H-bonds; (a) 5I6X (3.14 Å), Ser439, ΔpKi 2.298-2.536; (b) 5I71 (3.15 Å), Ser439, ΔpKi 2.330-2.697; (c) 5I73 (3.24 Å), Ser439 & Tyr95, ΔpKi 3.850-4.111
Schematic representation of AutoGrid box and grid points with the larger gray sphere indicating a typical probe atom for the corresponding grid point
Interaction plot for AutoDock estimated inhibition constants of citalopram-serotonin transporter (SERT) complex representing higher pairwise interaction between factors E (Drug optimization method) and F (Target flexibility) at lower levels of other factors; Red line is indicative of the effect of drug optimization method (F) within a SERT 3D structure with PDB code 5I6X and the black line represents the effect of drug optimization method (F) within a SERT 3D structure with PDB code 5I73; R1: ΔpKi, (A) Torsion degrees for drug, (B) Grid spacing (Å), (C) Quaternion degrees for drug, (D) Translation (Å), (E) Drug optimization method, (F) Target flexibility
3D surface plot representing the effect of interactive term EF of polynomial quadratic model for AutoDock4.2 driven inhibition constants of citalopram-serotonin transporter (SERT) complex; docking accuracy increased at higher levels of factor E as the levels of other factors declined to lower levels. R1: ΔpKi (Docking accuracy), (A) Torsion degrees for drug, (B) Grid spacing (Å), (C) Quaternion degrees for drug, (D) Translation (Å), (E) Drug optimization method, (F) Target flexibility
Interaction plot for AutoDock estimated inhibition constants of donepezil-AChE complex representing higher pairwise interaction between factors E (Drug optimization method) and F (Target flexibility) at upper levels of other factors; Red line is indicative of the effect of drug optimization method (F) within a SERT 3D structure with PDB code 4M0E and the black line represents the effect of drug optimization method (F) within an AChE 3D structure with PDB code 4EY7; R1: ΔpKi, (A) Torsion degrees for drug, (B) Grid spacing (Å), (C) Quaternion degrees for drug, (D) Translation (Å), (E) Drug optimization method, F: Target flexibility
The one-factor plot of AutoDock estimated inhibition constants of donepezil-AChE complex representing the higher effect of factors E (Drug optimization method) at upper levels of other factors; R1: ΔpKi (Docking accuracy), (A) Torsion degrees for drug, (B) Grid spacing (Å), (C) Quaternion degrees for drug, (D) Translation (Å), (E) Drug optimization method, (F) Target flexibility
3D surface plot representing the effect of interactive term BE of polynomial quadratic model for AutoDock4.2 driven inhibition constants of donepezil-AChE complex; R1: ΔpKi (Docking accuracy), (A) Torsion degrees for drug, (B) Grid spacing (Å), (C) Quaternion degrees for drug, (D) Translation (Å), (E) Drug optimization method, (F) Target flexibility
3D surface plot representing the effect of interactive term EF of polynomial quadratic model for AutoDock4.2 driven inhibition constants of donepezil-AChE complex; docking accuracy increased at higher levels of factor E as the levels of other factors declined to lower levels. (A) Torsion degrees for drug, (B) Grid spacing (Å), (C) Quaternion degrees for drug, (D) Translation (Å), (E) Drug optimization method, (F) Target flexibility
| Factors understudy | Factor levels |
|---|
| Low: Actual (Coded) | Medium: Actual (Coded) | High: Actual (Coded) |
|---|
| A: Torsion degrees for drug | 5 (-1) | 20 (0) | 50 (+1) |
| B: Grid spacing (Å) | 0.3 (-1) | 0.375 (0) | 0.5 (+1) |
| C: Quaternion degrees for drug | 5 (-1) | 20 (0) | 50 (+1) |
| D: Translation (Å) | 0.2 (-1) | 0.3 (0) | 0.5 (+1) |
| E: Drug optimization method | AM1 (-1) | Cognate ligand (0) | PM3 (+1) |
| F: Target flexibility | Lowest resolution (Å) PDB code (-1) | Medium resolution (Å) PDB code (0) | Highest resolution (Å) PDB code (+1) |
| Drug/No. | PDB ID | Resolution ofPDB structure(Å) | Number of GA runs | No. of conformationsin top-ranked cluster | MaximumNo. of energy eval. | RMSD from Reference (Å) |
|---|
| Citalopram | | | | | | |
| 1 | 5I6X | 3.14 | 50 | 49 | 2.5 × 10⁶ | 1.58 |
| 2 | 5I71 | 3.15 | 50 | 49 | 2.5 × 10⁶ | 0.90 |
| 3 | 5I73 | 3.24 | 50 | 50 | 2.5 × 10⁶ | 0.82 |
| Donepezil | | | | | | |
| 1 | 4M0E | 2.00 | 50 | 50 | 2.5 × 10⁶ | 0.55 |
| 2 | 5HF9 | 2.20 | 50 | 50 | 2.5 × 10⁶ | 1.92 |
| 3 | 4EY7 | 2.35 | 50 | 47 | 2.5 × 10⁶ | 0.46 |
| Source | Sum of squares | df | Mean square | F-value | P-value |
|---|
| Model | 19.41 | 11 | 1.76 | 301.22 | <0.0001 |
| B | 0.082 | 1 | 0.082 | 14.02 | 0.0005 |
| E | 12.91 | 1 | 12.91 | 2204.33 | <0.0001 |
| EF | 5.59 | 1 | 5.59 | 954.33 | <0.0001 |
| Residual | 0.25 | 42 | 5.858E-003 | | |
| Lack of fit | 0.15 | 25 | 6.160E-003 | 1.14 | 0.3987 |
| Pure error | 0.092 | 17 | 5.415E-003 | | |
| Cor Total | 19.66 | 53 | | | |
| No. optimized solution | Factor levels |
|---|
| A | B | C | D | E | F | ΔpKi |
|---|
| 1 | -0.33 | -0.96 | -0.85 | 0.14 | 1.00 | -1.00 | 0.925 |
| 2 | 0.42 | -0.79 | -0.67 | -0.50 | 1.00 | -1.00 | 0.933 |
| 3 | -0.25 | -0.73 | -0.57 | -0.85 | 1.00 | -1.00 | 0.934 |
| 4 | 0.42 | -0.40 | -0.90 | -0.85 | 1.00 | -1.00 | 0.938 |
| 5 | -0.97 | -0.41 | -0.78 | 0.04 | 1.00 | -1.00 | 0.960 |
| 6 | -0.85 | -0.93 | 0.67 | -0.27 | 1.00 | -1.00 | 0.968 |
| 7 | -0.69 | -0.94 | -0.36 | 0.84 | 1.00 | -1.00 | 0.987 |
| 8 | -0.32 | -0.40 | -0.04 | -0.73 | 1.00 | -1.00 | 0.996 |
| 9 | -0.70 | -0.50 | 0.28 | -0.32 | 1.00 | -1.00 | 0.999 |
| Source | Sum of squares | df | Mean square | F-value | P-value |
|---|
| Model | 248.19 | 20 | 12.41 | 234.38 | <0.0001 |
| B | 1.19 | 1 | 1.19 | 22.42 | <0.0001 |
| E | 0.91 | 1 | 0.91 | 17.18 | 0.0002 |
| BE | 0.39 | 1 | 0.39 | 7.42 | 0.0102 |
| EF | 189.12 | 1 | 189.12 | 3571.88 | <0.0001 |
| Residual | 1.75 | 33 | 0.053 | | |
| Lack of fit | 1.08 | 16 | 0.068 | 1.74 | 0.1336 |
| Pure error | 0.66 | 17 | 0.039 | | |
| Cor Total | 249.94 | 53 | | | |
| No. Optimized solution | Factor levels |
|---|
| A | B | C | D | E | F | ΔpKi |
|---|
| 1 | -0.45 | -0.99 | 0.93 | -0.97 | 1.00 | 1.00 | 0.152 |
| 2 | 0.99 | -1.00 | -0.90 | 0.99 | -1.00 | -1.00 | 0.160 |
| 3 | -0.06 | -0.86 | 1.00 | -0.91 | 1.00 | 1.00 | 0.161 |
| 4 | -0.08 | -0.49 | 1.00 | -1.00 | 1.00 | 1.00 | 0.187 |
| 5 | -0.11 | -0.89 | 0.98 | -0.96 | -1.00 | -1.00 | 0.185 |