Optimization of spherical agglomeration process
Preliminary trials
Several preliminary trials were made to find suitable conditions for the preparation of SA of glimepiride with good shape and yield (
Table 1).
First, DCM was tried as the good solvent, water as the poor, and CHCl3 as the bridging liquid. Different volumes of DCM and water were used, but no drug agglomeration occurred, and only milky white emulsion droplets were formed.
Upon increasing the weight of the drug used and fixing the volumes of DCM and water, unstable emulsion droplets were formed, with no drug agglomeration. Increasing the volume of CHCl3 or switching to toluene (as a bridging liquid) did not affect the results.
Using CCl4 and benzene as bridging liquids gave more stable emulsion droplets, but no drug agglomeration occurred.
DMF was then tried as a good solvent instead of DCM, while the other variables were kept constant. Upon the addition of water, the drug started to precipitate in the form of SA. Fine droplets were observed immediately, suggesting the diffusion of the good solvent out and the poor solvent into the emulsion droplets. Using CCl4 or benzene as bridging liquids in this case helped bridge the drug particles together, which led to the drug agglomeration into a more perfect spherical shape.
An agitation speed of 200 rpm was then tried during the agglomeration process, but the agglomerates formed were irregular in shape. When the agitation speed of 900 rpm was tried, the agglomerates formed were split into smaller ones due to the high agitation speed.
When the temperature of the medium was increased to 40 ºC, the agglomeration process was not efficient. This might be due to increased drug solubility in DMF at a higher temperature.
Physicochemical evaluation of the prepared spherical agglomerates
Yield percent and drug content
Effect of adding Aerosil in the drug solution
After optimizing the agglomeration process, a poor yield of SA was detected. A high rate of collision and coalescence of droplets in the premature stage was accused for such poor yield. The separated solid particles adhered to the wall of the vessel and/or to the blades of the stirrer. Adding Aerosil to the drug solution before emulsion formation greatly enhanced the final yield of the product to 90% or more (
Table 3). This could be reasonable, since Aerosil acted as a dispersing agent, where it could prevent the coalescence of droplets. The produced SAs were compact and did not adhere to the wall of the vessel (
32). Increasing the Aerosil amount to reach the drug to-Aerosil ratio 1:2 did not further enhance the yield. This was probably due to the increased viscosity of the dispersed phase. The produced larger droplets coalesce more easily causing a drop in the final yield.
Effect of adding hydrophilic polymers in the aqueous phase
The addition of hydrophilic polymers assisted the role of Aerosil in increasing the yield of intact SA with a different mechanism (
Table 3). These water-soluble polymers were thought to act as stabilizers for the formed emulsion. They acted by protecting the adjacent droplets from fusion and coalescence, thereby contributing to imparting sphericity and strength to the formed agglomerates (
33,
34).
Effect of adding different carriers in the drug solution
All tested carriers were added to the drug solution at a concentration of 0.5% w/v. A further increase in concentration caused the disaggregation of particles (
Table 2). These carriers were thought to modify the crystal habit of aggregates by adsorbing onto their growing surface (
35). The yield of SA prepared with different polymers (namely SAPVA, SAHPC, SAPVP), carriers (namely SAps, SApf, SAst, SAac, SAgl and SAcp) or a carrier-polymer combination (having the same abbreviations as the respective carrier and polymer) ranged from 90-96%.
The glimepiride assay in all the prepared systems showed ≈ 90% to 97% content, assuming a minimal drug loss during the dispensation procedures (
Table 3).
Kinetic analysis of the dissolution data
The data obtained from the dissolution experiments were treated statistically according to the linear regression analysis. They were fitted to zero order, first order and Higuchi diffusion model. Kinetic treatment of data was then performed for the order of the best fit (
Table 4).
Effect of different hydrophilic polymers in the aqueous phase on the dissolution t1/2
As shown in
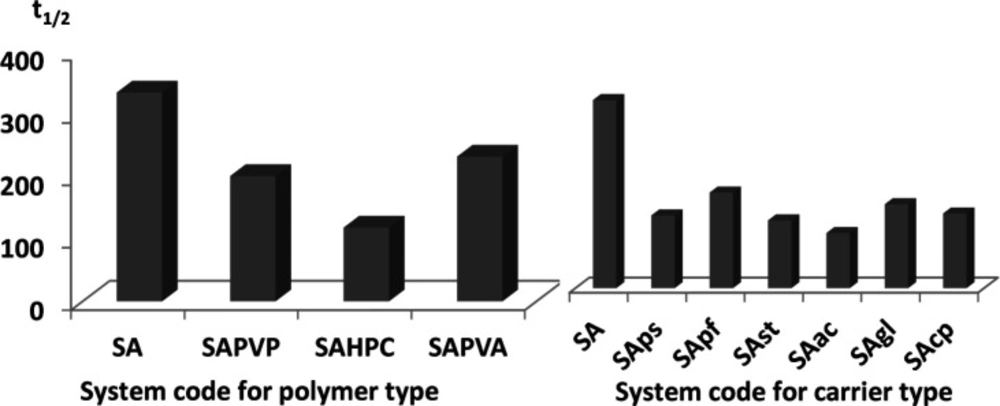
Figure 1 and
Table 4, SA alone did not greatly influence the value of t
1/2 (334 min) when compared to the drug alone (381 min). However, introducing water soluble polymers in the aqueous phase of the emulsion caused a slight enhancement in glimepiride dissolution. Half-life values ranged from 118 min to 231 min for the three tested polymers, indicating similar efficiency in emulsion stabilization (
Figure 1).
Effect of different carriers added to the drug solution on the dissolution t1/2
The introduction of carriers within the drug solution during emulsification had a great effect on dissolution enhancement. In fact, t
1/2 dropped to more than half of the original value in case of pure drug (381 min) for all tested carriers (
Figure 1) (
Table 4).
For partially soluble carriers, the best enhancement was attained with Starlac followed by PreGelSt and then Pearlitol flash. The superiority of Starlac could be attributed to its spherical shape that could tailor the crystal habit of the drug to a perfect spherical geometry during the progress of agglomeration. Moreover, its adsorption on the aggregated drug crystals promoted their wetting and amorphisation.
For water-insoluble carriers, the use of Ac-Di-Sol resulted in the least recorded t
1/2 followed by CP and then Glycolys
®. This result could be interpreted on the basis of the strong swelling capacity of Ac-Di-Sol and CP (
36,
37). Their ability to drag a large volume of the dissolution medium could strongly wet the agglomerates; thus, enabling their dissolution at a much higher rate.
Effect of carriers in the presence of different hydrophilic polymers with respect to their effect on the dissolution t1/2
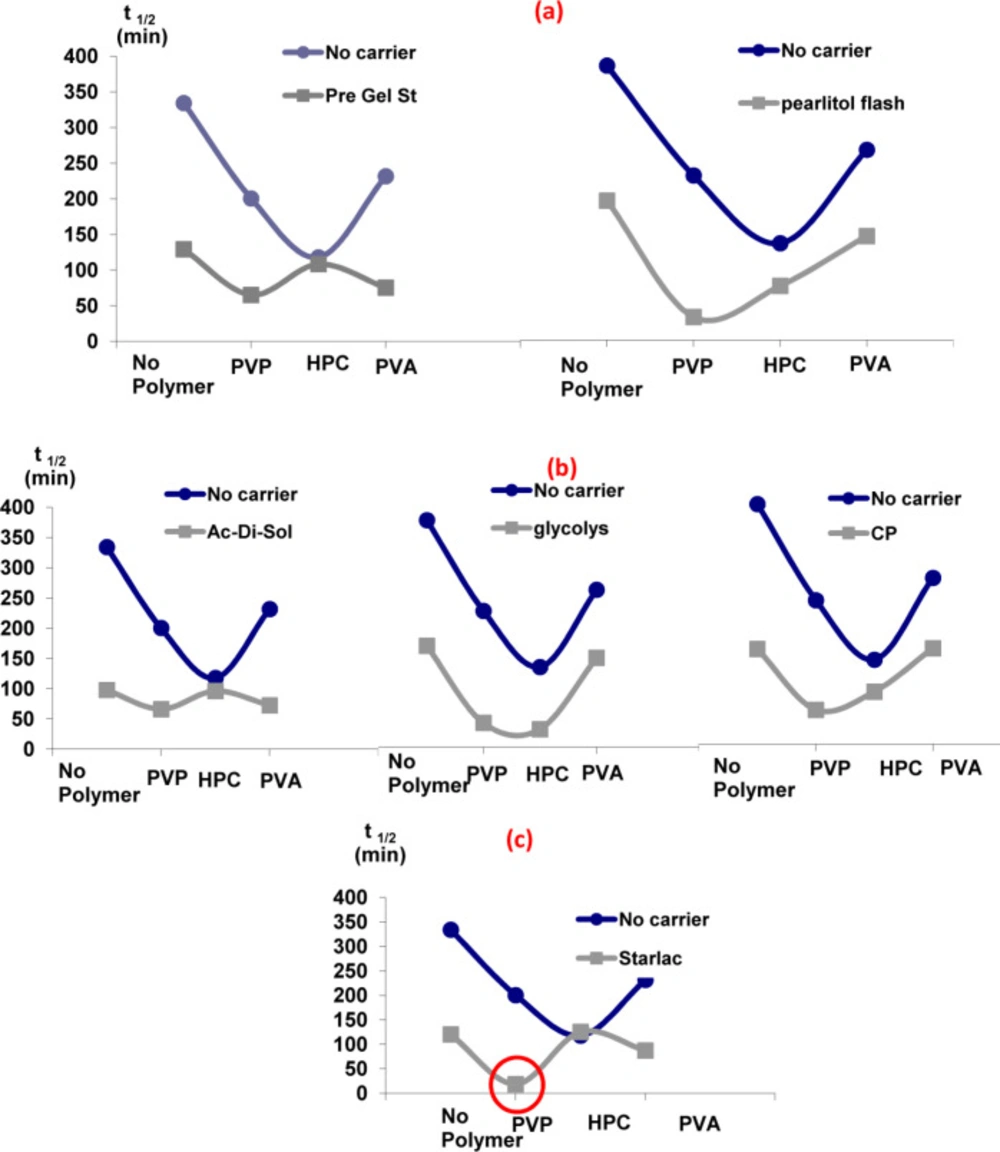
It is obvious from
Figure 2 that the addition of carriers in the drug solution along with hydrophilic polymers in the aqueous phase was the optimum choice. A sharp drop in t
1/2 was detected for all carrier-polymer combinations relative to their analogues devoid of carriers. The probable adsorption of carriers onto the surface of SA could modify and reorganize their crystal habit to a final amorphous form (
15). Therefore, it can be concluded that such synergistic combination provided a good medium for the separation of perfect spherically shaped agglomerates with a high wetting power and, accordingly, improved the dissolution rate
Comparison of spherical agglomerates prepared with different polymers and carriers with respect to their effect on the dissolution t1/2
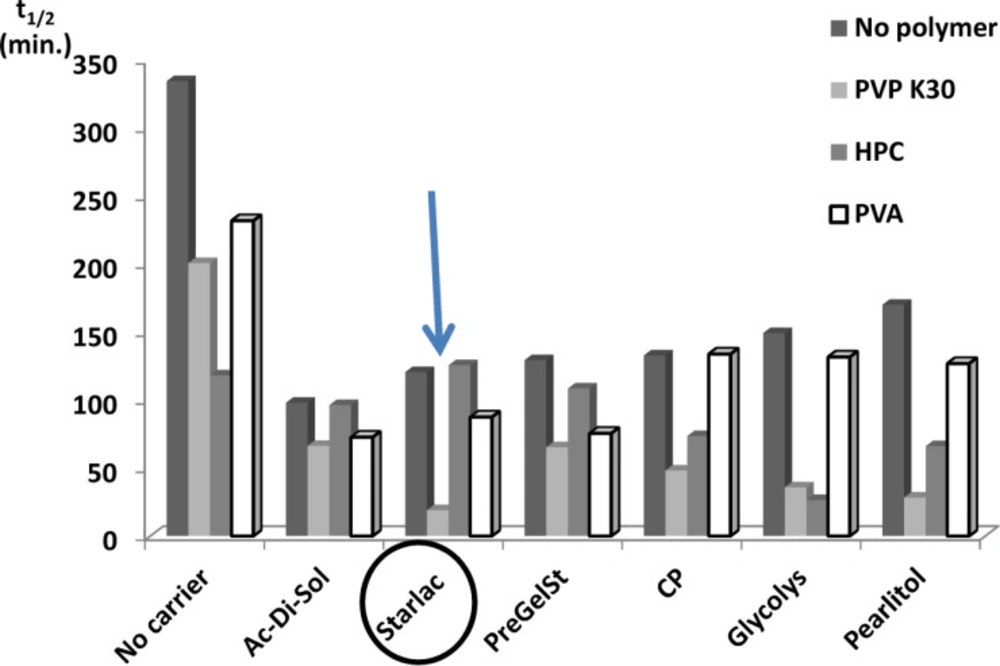
Figure 3 illustrates the superiority of SA prepared with PVP (least t
1/2) for all tested carriers. This could be attributed to higher emulsifying and film-forming ability than other testing polymers. PVP might efficiently decrease the surface tension between phases and thus imparted a temporary physical stability to the formed quasi emulsion. In this way it contributed to the spheronization and amorphisation of the agglomerates through stabilization of the spherical droplets of the emulsion (
38). Amorphous spherical particles showed higher dissolution rate than the untreated drug crystals.
Systems with the least values for the dissolution half-life (SAPVPps, SAPVPpf, SAPVPst, SAPVPac, SAPVPgl, SAPVPcp, SAHPCpf, SAHPCgl) were considered optimum and were selected for further investigation.
Micromeritics of optimized spherical agglomerates
Angle of repose
Table 5 shows that glimepiride (with a distinct crystalline nature) exhibited very poor flowability (Ɵ ≈ 47). The angle of repose for SAPVPgl and SAPVPcp were about 28.057 and 28.854, respectively. For SAHPCgl and SAPVPst, it reached 24.781 and 24.749, respectively. All four agglomerates were considered to have excellent flowability according to the USP standards (
27,
28). Spheronization and amorphisation of particles were the main reason for these results. The difference in values among different SAs could be interpreted by the variation in their surface roughness due to the different adsorbed carriers on their surfaces.
Hausner’s ratio and Carr’s index
It was remarkable that all prepared agglomerates possessed much lower values of tapped densities than that of the pure drug (
Table 5). This might be the result of increasing the interparticulate porosity of SA after acquiring the spherical shape during agglomeration.
Hausner’s ratio and Carr’s index for pure glimepiride were 2.16 and 27%, respectively, which indicated a very poor flowability. The prepared agglomerates showed lower values, indicating the improvement of flow properties. SAPVPst possessed the least values among all tested agglomerates and could be considered as an optimized formula (
29,
30). It could finally be concluded that the decrease in the values of the angle of repose, Hausner’s ratio and Carr’s index for the prepared agglomerates relative to the pure drug had a significant indication of the improved flow properties of such systems. This might be due to the large and spherical shape of agglomerates obtained. On the contrary, the fine irregular shapes of drug particles tended to have high surface-to-mass ratios than coarser particles. They might produce irregular flow properties due to differences in interparticulate contact areas.
Packability determination
The results obtained in
Table 6 explain the packability of the prepared agglomerates when compared with that of the pure drug. The treatment of tapping was done according to Kawakita and Ludde’s equation (
31). The plot of n/C versus n was linear, where 1/a is the slope that indicated compactibility and 1/ab was the intercept that indicated the cohesivity of systems. It was found that the values of the slope (1/a) for the prepared agglomerates increased with respect to the drug, indicating increased compactibility of such agglomerates,
i.e. the agglomerates were closely packed together. As a result, the values of parameter (a) as obtained from the reciprocal of the slope of the line decreased for all the tested agglomerates.
On the other hand, the values of the intercept (1/b) decreased for the treated agglomerates with respect to the drug, indicating decreased cohesivity of such agglomerates. Accordingly, parameter (b) as obtained from the reciprocal of the intercept of the line represented the velocity of the flow of agglomerates. The values of parameter (b) obtained increased for all the tested carriers except for SAPVPac, which was slightly lower than that of the drug.
The decreased (a) values and increased (b) values suggested enhanced packability of the prepared agglomerates when compared to the pure drug. This might be explained by the large size and sphericity of the agglomerates formed. During tapping, the smaller particles went into the voids between the larger ones; hence, giving better packability to the systems (
26,
39).
SAPVPst agglomerates showed optimum flowability and packability results as compared to other systems, so they were selected for particle size determination.
Particle size determination
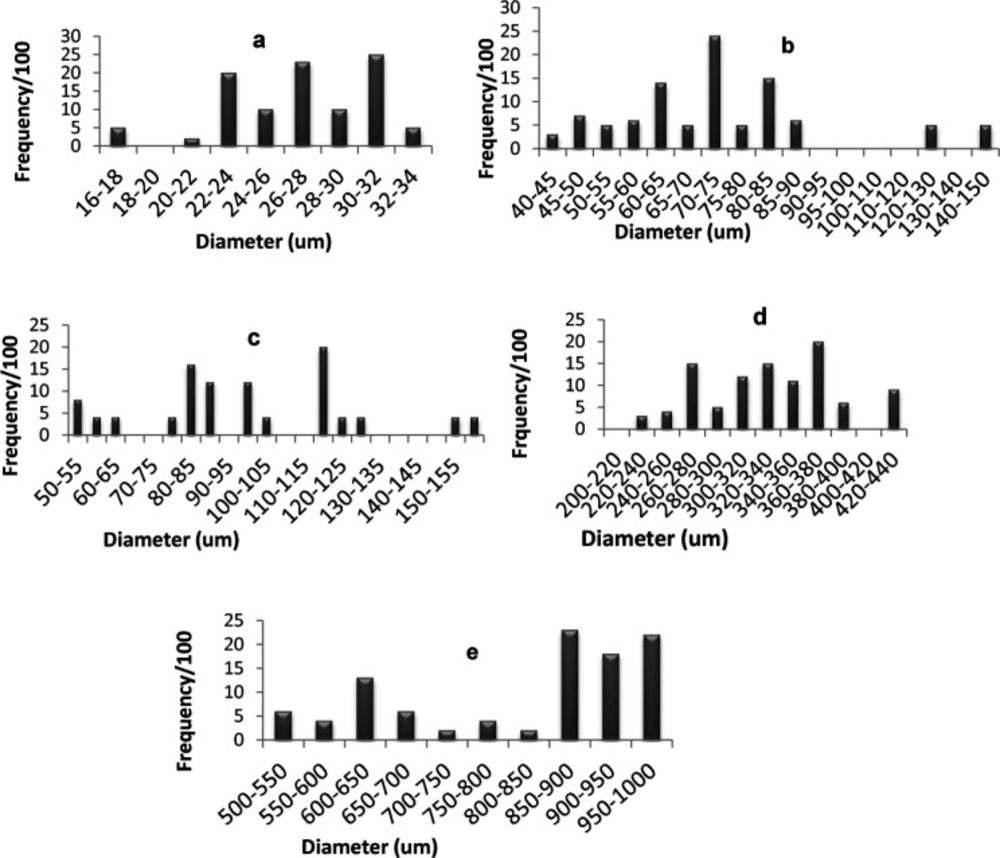
Figure 4 shows the percentage frequency at each particle size range for optimized SAs and the components used in their preparation. The average diameter of glimepiride particles was around 26.93 µm, Starlac about 74.92 µm, PVP K30 332.89 µm, and the formed SAPVPst agglomerates around 821.2 µm. It is, thus, obvious that the size of the prepared agglomerates was higher than all of their individual components. Furthermore a non homogeneous distribution of particles around the mean was illustrated as particles were skewed towards the large size range (850-1000 µm) (
Figure 5e).
For SAPVPst, a horizontal and a vertical diameter were measured for each particle, and their ratio was close to 1, indicating high spheronization of the formed agglomerates (
40,
41).
Physicochemical characterization of the optimized system
It is obvious that Starlac performance was superior when PVP K30 was present in the agglomeration medium, in terms of the highest dissolution profile and the least recorded t1/2 reaching a minimum of 19 min. That was why further characterization was performed on the optimum agglomerates containing both Starlac and PVP K30.
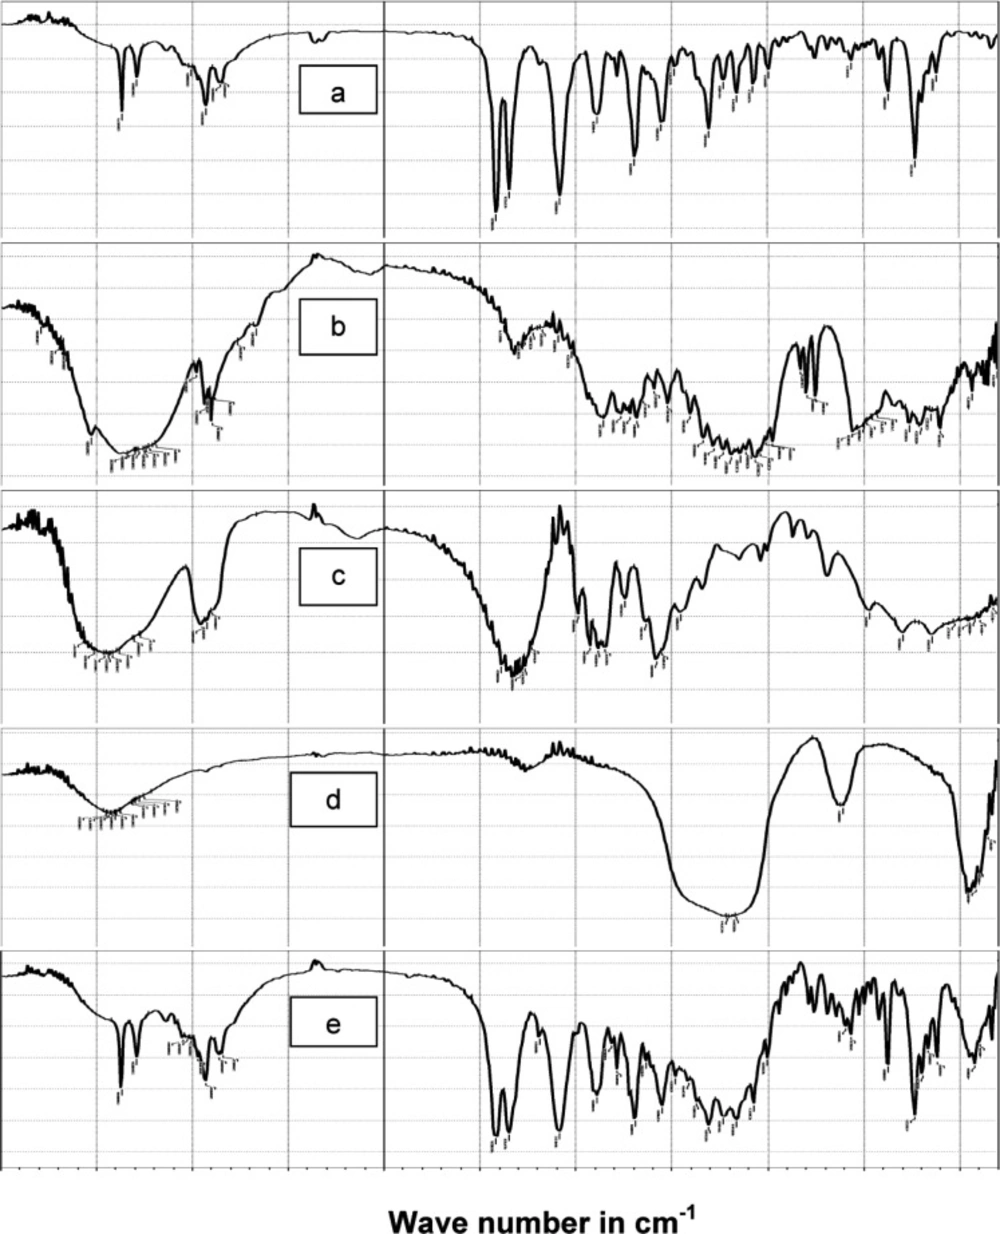
FT-IR analysis
In order to test for possible interaction between the drug and the other components in SAPVPst, each component was studied alone for the presence of characteristic peaks and then compared with the peaks appearing in SAPVPst combining all ingredients.
Figure 5 shows that: (a) Pure glimepiride displayed two peaks characteristic of N-H stretching vibration at 3367 and 3290 cm
-1 and two bands of c=o stretching at 1708 and& 1674 cm
-1. (b) Starlac showed several broad bands of OH stretching at 3190 to 3334 cm
-1 and characteristic bands of CH aliphatic at 2899 and 2933 cm
-1. (c) PVP K30 showed several broad bands of OH stretching at 3271 to 3572 cm
-1 along with a broad band stretching of CH aliphatic at 2895, 2926, 2954 cm
-1. A characteristic C=O stretching peak was also seen at 1643 cm
-1. (d) Aerosil showed broad bands of OH stretching at 3375 to 3452 cm
-1. (e) SAPVPst exhibited all the characteristic bands of the drug at the same position. Matching between the IR spectra of the pure drug and SAPVPst revealed no sign of chemical interaction either in the region of stretching vibration or in the fingerprint region.
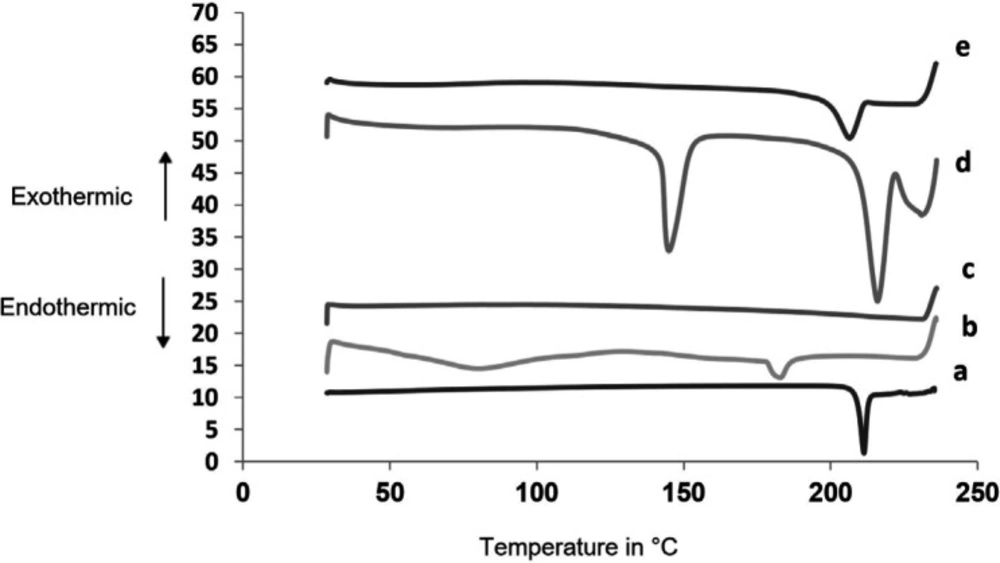
Differential Scanning Colorimetry (DSC)
Figure 6 shows thermograms for SAPVPst and its component excipients. Glimepiride exhibited a well defined melting peak at 215.3 °C indicating its crystalline nature. PVP K30 had two endothermic peaks at 80.23 °C and 183.2 °C. Starlac showed two characteristic endotherms at 215.83 °C and 144.89 °C. Aerosil 200 showed no sharp endotherms. The peak characteristic of SAPVPst was much less in intensity than that of glimepiride, indicating the loss of the strong crystalline nature of the drug within the SA.
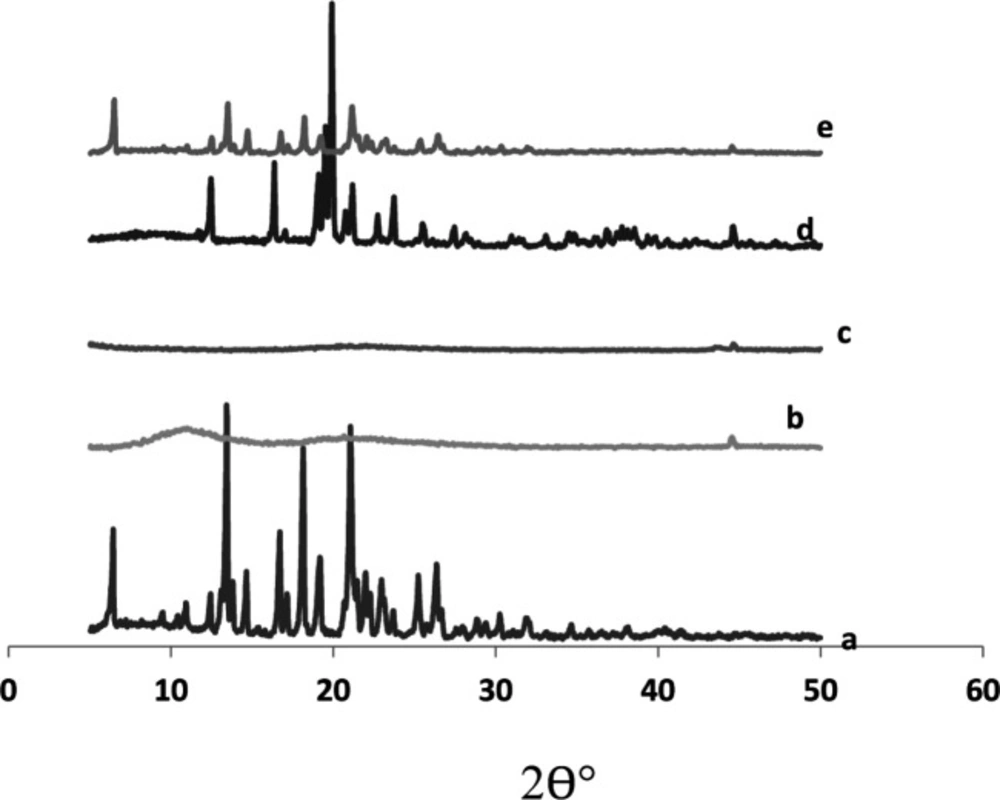
X-ray powder diffraction
The X-ray diffractogram of glimepiride exhibited sharp and intense peaks at 2 θ° equivalent to: 18.10°,19.12°, 22.00°, 25.21°, 26.32°, besides a series of smaller peaks at 6.35°, 14.62°, 17.02°, 22.82°, and 23.64° as shown in
Figure 7. The above pattern clearly showed the strong crystal habit of the pure drug.
Starlac showed an intense peak at 2 θ° equivalent to 19.87°, besides some small peaks at 12.48°, 16.33°, 21.14°, and 23.72°. This pattern could suggest the crystalline nature of this excipient.
PVP K30 exhibited two short broad peaks at 10.98° and 20.62°, besides a small sharp one at 44.52°. Aerosil 200 showed a short broad peak at 22.03° and two short sharp peaks at 43.48° and 44.6°. The diffractogram of such excipients suggested their amorphous structures with respect to Starlac. A remarkable decrease in peak intensities characteristic of the drug were observed in the X-ray diffractogram of SAPVPst. Some peaks characteristic to Starlac were also seen, but at much lower intensity. SAPVPst were, thus, successful in converting the strong crystalline nature of the drug into an amorphous structure.
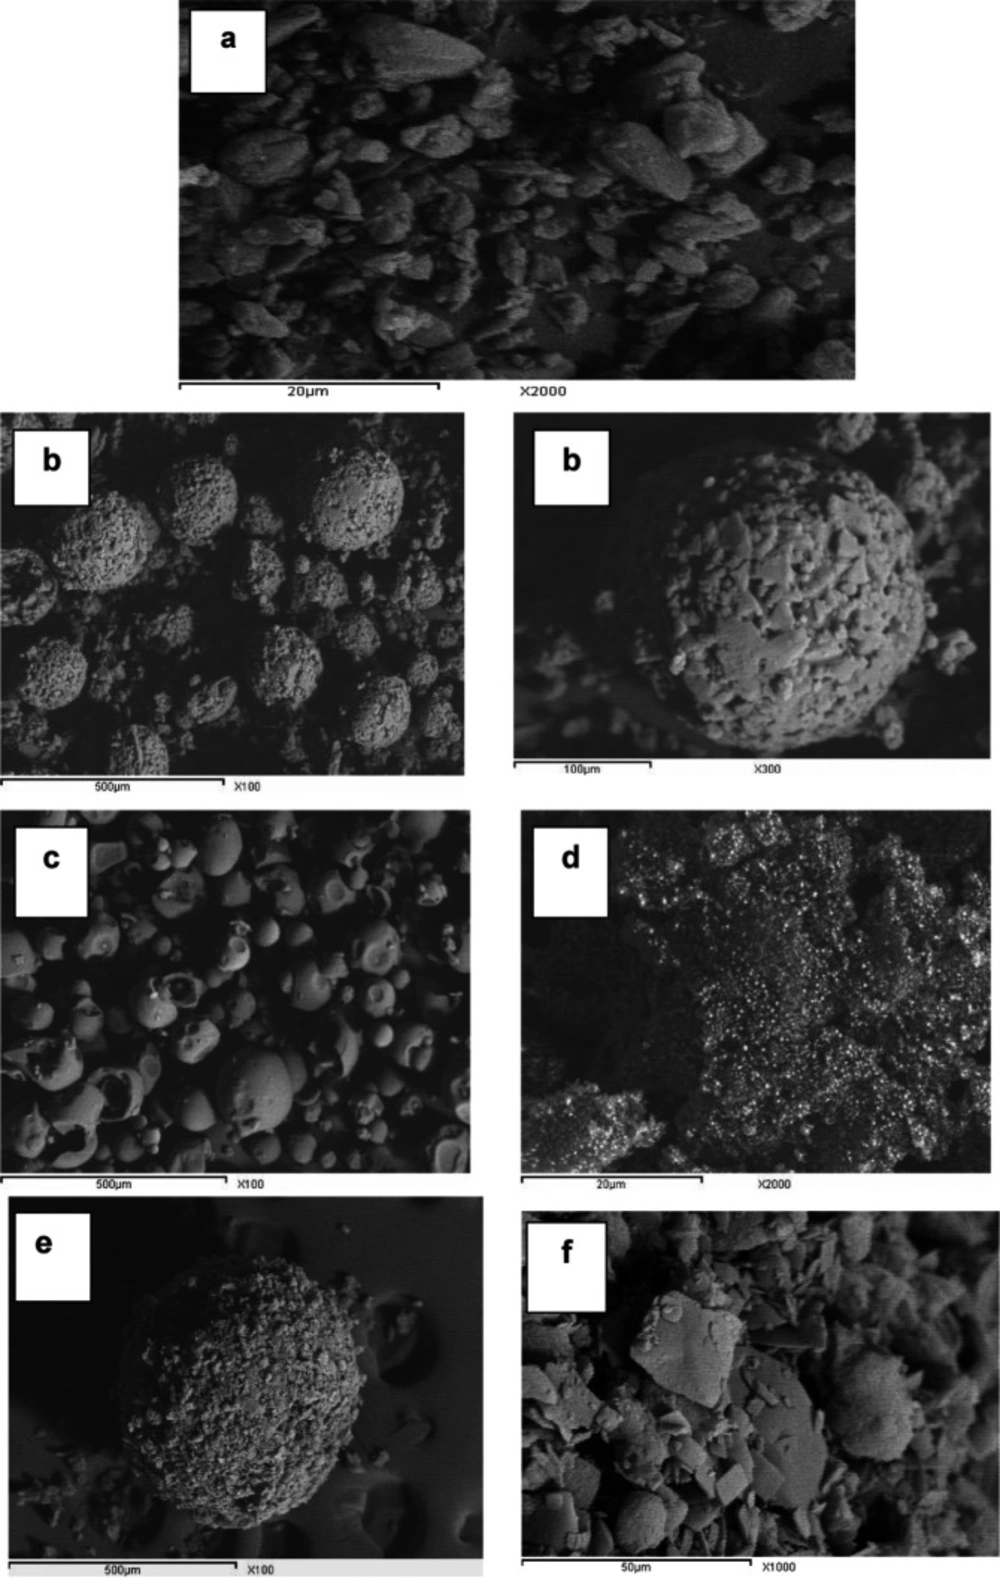
Scanning electron microscopy (SEM)
The surface topography of glimepiride platelets illustrates the strong crystal habit of the drug with distinct sharp edges (
Figure 8); Starlac particles were globular in shape with irregular surface similar to lactose globules (which constitute the larger percentage of such carrier). PVP K30 appeared as large smooth spheres. Aerosil 200 appeared as fine particles. The prepared SAPVPst agglomerates were much larger in size compared with the single components, perfectly spherical with a distinct rough surface. Higher magnification of agglomerate surfaces showed the aggregation of drug platelets together with occasional small spherical patches that could be due to the surface adsorption of the Starlac particles.
Effect of adding different polymers or carriers on the dissolution t1/2 of glimepiride from respective spherical agglomerates
Effect of adding carriers in the drug solution in the presence of different hydrophilic polymers in the aqueous phase with respect to their effect on the dissolution t1/2 (a) water-soluble to partially water-soluble carriers, (b) water-insoluble carriers, (c) optimized carrier
Comparison of spherical agglomerates containing different hydrophilic polymers and carriers with respect to their effect on t1/2
Histogram showing particle size distribution for (a) glimepiride, (b) Starlac, (c) Aerosil 200, (d) PVP K 30, (e) spherical agglomerates SAPVPst
Comparison of FTIR spectra of (a) pure glimepiride, (b) Starlac, (c) PVP K30, (d) Aerosil 200, (e) SAPVPst
DSC thermograms for (a) pure glimepiride, (b) PVP K30, (c) Aerosil 200, (d) Starlac, (e) SAPVPst
X-ray diffraction patterns of (a) pure glimepiride, (b) PVP K30, (c) Aerosil 200, (d) Starlac, (e) SAPVPst
SEM of (a) pure glimepiride, (b) Starlac at 100x, 300x, (c) PVP K30 at 100x, (d) Aerosil 200 at 2000x, (e) SAPVPst whole spheres at 100x, (f) SAPVPst surface at 10000x
| Systemcode | Weight of glimepiride (mg) | Good solvent | Volume of poor solvent [water] (mL) | Bridging liquid | Agitation Speed(rpm) | Temperature(ºC) |
|---|
| Type | Volume (mL) | Type | Volume (mL) |
|---|
| S1 | 50 | DCM | 5 | 10 | CHCl3 | 0.25 | 500 | 25 |
| S2 | 50 | DCM | 3 | 10 | CHCl3 | 0.25 | 500 | 25 |
| S3 | 50 | DCM | 2 | 10 | CHCl3 | 0.25 | 500 | 25 |
| S4 | 50 | DCM | 2 | 7 | CHCl3 | 0.25 | 500 | 25 |
| S5 | 50 | DCM | 2 | 5 | CHCl3 | 0.25 | 500 | 25 |
| S6 | 50 | DCM | 2 | 4 | CHCl3 | 0.25 | 500 | 25 |
| S7 | 100 | DCM | 2 | 4 | CHCl3 | 0.25 | 500 | 25 |
| S8 | 150 | DCM | 2 | 4 | CHCl3 | 0.25 | 500 | 25 |
| S9 | 150 | DCM | 2 | 4 | CHCl3 | 0.5 | 500 | 25 |
| S10 | 150 | DCM | 2 | 4 | CHCl3 | 0.85 | 500 | 25 |
| S11 | 150 | DCM | 2 | 4 | Toluene | 0.5 | 500 | 25 |
| S12 | 150 | DCM | 2 | 4 | Toluene | 0.85 | 500 | 25 |
| S13 | 150 | DCM | 2 | 4 | CCl4 | 0.5 | 500 | 25 |
| S14 | 150 | DCM | 2 | 4 | CCl4 | 0.85 | 500 | 25 |
| S15 | 150 | DCM | 2 | 4 | Benzene | 0.5 | 500 | 25 |
| S16 | 150 | DCM | 2 | 4 | Benzene | 0.85 | 500 | 25 |
| S17 | 150 | DMF | 2 | 4 | CCl4 | 0.5 | 500 | 25 |
| S18 | 150 | DMF | 2 | 4 | CCl4 | 0.85 | 500 | 25 |
| S19 | 150 | DMF | 2 | 4 | Benzene | 0.5 | 500 | 25 |
| S20 | 150 | DMF | 2 | 4 | Benzene | 0.85 | 500 | 25 |
| S21 | 150 | DMF | 2 | 4 | Benzene | 0.85 | 200 | 25 |
| S22 | 150 | DMF | 2 | 4 | Benzene | 0.85 | 900 | 25 |
| S23 | 150 | DMF | 2 | 4 | Benzene | 0.85 | 500 | 40 |
| ***S24 | 150 | DMF | 2 | 4 | Benzene | 0.85 | 500 | 40 |
| System code | Poor Solvent | Excipients added to the drug solution |
|---|
| Additive | Volume (mL) | Aerosil 200 (mg) | Carrier |
|---|
| Type | w/v (%) |
|---|
| SA | - | 4 | 150 | - | - |
| SA" | - | 4 | 300 | - | - |
| SAPVA | PVA | 4 | 150 | - | - |
| SAHPC | HPC | 4 | 150 | - | - |
| SAPVP | PVP K30 | 4 | 150 | - | - |
| SAps | - | 4 | 150 | PreGelSt | 0.5 |
| SApf | - | 4 | 150 | Pearlitol flash | 0.5 |
| SAst | - | 4 | 150 | Starlac | 0.5 |
| SAac | - | 4 | 150 | Ac-Di-Sol | 0.5 |
| SAgl | - | 4 | 150 | Glycolys® | 0.5 |
| SAcp | - | 4 | 150 | CP | 0.5 |
| SAPVAps | PVA | 4 | 150 | PreGelSt | 0.5 |
| SAPVAps" | PVA | 4 | 150 | PreGelSt | 0.75 |
| SAPVApf | PVA | 4 | 150 | Pearlitol flash | 0.5 |
| SAPVAst | PVA | 4 | 150 | Starlac | 0.5 |
| SAPVAac | PVA | 4 | 150 | Ac-Di-Sol | 0.5 |
| SAPVAgl | PVA | 4 | 150 | Glycolys® | 0.5 |
| SAPVAcp | PVA | 4 | 150 | CP | 0.5 |
| SAHPCps | HPC | 4 | 150 | PreGelSt | 0.5 |
| SAHPCpf | HPC | 4 | 150 | Pearlitol flash | 0.5 |
| SAHPCst | HPC | 4 | 150 | Starlac | 0.5 |
| SAHPCac | HPC | 4 | 150 | Ac-Di-Sol | 0.5 |
| SAHPCgl | HPC | 4 | 150 | Glycolys® | 0.5 |
| SAHPCcp | HPC | 4 | 150 | CP | 0.5 |
| SAPVPps | PVP K30 | 4 | 150 | PreGelSt | 0.5 |
| SAPVPpf | PVP K30 | 4 | 150 | Pearlitol flash | 0.5 |
| SAPVPst | PVP K30 | 4 | 150 | Starlac | 0.5 |
| SAPVPac | PVP K30 | 4 | 150 | Ac-Di-Sol | 0.5 |
| SAPVPgl | PVP K30 | 4 | 150 | Glycolys® | 0.5 |
| SAPVPcp | PVP K30 | 4 | 150 | CP | 0.5 |
| System Code | Drug Content (w/w%) ± SD | Yield(w/w%) ± SD |
|---|
| SA | 92.07 ± 1.05 | 90.23 ± 1.77 |
| SAPVP | 92.83 ± 1.17 | 92.14 ± 2.09 |
| SAHPC | 93.63 ± 1.2 | 89.54 ± 1.51 |
| SAPVA | 93.64 ± 1.13 | 90.96 ± 1.04 |
| SAps | 91.16 ± 2.54 | 93.65 ± 1.72 |
| SAPVPps | 92.54 ± 1.55 | 95.27 ± 1.9 |
| SAHPCps | 93.36 ± 1.84 | 90.01 ± 1.11 |
| SAPVAps | 95.67 ± 1.68 | 91.36 ± 2.56 |
| SApf | 92.73 ± 1.83 | 95.25 ± 2.45 |
| SAPVPpf | 93.64 ± 1.5 | 93.87 ± 1.75 |
| SAHPCpf | 92.04 ± 1.18 | 95.21 ± 2.33 |
| SAPVApf | 93.56 ± 1.34 | 91.47 ± 1.48 |
| SAst | 93.02 ± 1.98 | 95.37 ± 2.24 |
| SAPVPst | 92.20 ± 1.8 | 92.89 ± 1.7 |
| SAHPCst | 93.87 ± 1.33 | 89.99 ± 1.84 |
| SAPVAst | 94.91 ± 1.28 | 91.08 ± 1.1 |
| SAac | 93.49 ± 1.38 | 90.56 ± 1.44 |
| SAPVPac | 93.87 ± 1.26 | 96.58 ± 1.61 |
| SAHPCac | 94.25 ± 1.75 | 92.07 ± 2.83 |
| SAPVAac | 94.59 ± 1.09 | 90.43 ± 1.2 |
| SAgl | 92.92 ± 1.21 | 94.21 ± 2.02 |
| SAPVPgl | 94.31 ± 1.56 | 92.00 ± 1.18 |
| SAHPCgl | 90.02 ± 1.62 | 96.78 ± 1.74 |
| SAPVAgl | 94.39 ± 1.89 | 94.24 ± 2.09 |
| SAcp | 96.90 ± 1.1 | 90.23 ± 1.62 |
| SAPVPcp | 92.49 ± 1.54 | 92.47 ± 1.12 |
| SAHPCcp | 95.13 ± 1.6 | 94.27 ± 1.7 |
| SAPVAcp | 88.98 ± 1.09 | 89.99 ± 2.01 |
| SystemCode | Order of Release | K# | Half-life (min) |
|---|
| SA | first | 2.0727 10-3 | 334.34 |
| SAPVP | first | 3.454510-3 | 200.60 |
| SAHPC | zero | 0.16 | 118.00 |
| SAPVA | first | 2.99 10-3 | 231.77 |
| SAps | zero | 0.18 | 129.29 |
| SAPVPps | zero | 0.25 | 65.24 |
| SAHPCps | diffusion | 3.41 | 108.44 |
| SAPVAps | diffusion | 2.84 | 75.45 |
| SApf | zero | 0.12 | 169.92 |
| SAPVPpf | zero | 0.26 | 28.24 |
| SAHPCpf | first | 0.01 | 66.00 |
| SAPVApf | diffusion | 3.49 | 126.80 |
| SAac | diffusion | 3.36 | 97.92 |
| SAPVPac | zero | 0.21 | 66.26 |
| SAHPCac | diffusion | 2.55 | 96.26 |
| SAPVAac | zero | 0.21 | 72.64 |
| SAgl | zero | 0.16 | 149.11 |
| SAPVPgl | zero | 0.23 | 35.73 |
| SAHPCgl | diffusion | 4.47 | 26.49 |
| SAPVAgl | zero | 0.19 | 131.52 |
| SAcp | zero | 0.19 | 132.74 |
| SAPVPcp | zero | 0.21 | 48.17 |
| SAHPCcp | zero | 0.23 | 73.44 |
| SAPVAcp | zero | 0.19 | 133.74 |
| SAst | zero | 0.18 | 120.43 |
| SAPVPst | diffusion | 6.27 | 18.92 |
| SAHPCst | first | 5.52 10-3 | 125.54 |
| SAPVAst | zero | 0.29 | 87.41 |
| Drug | zero | 0.08 | 381.19 |
| SystemCode | Bulk Density (g/cm3) | Tapped Density (g/cm3) | Angle of repose | Hausner's Ratio | Carr's Index |
|---|
| Value (º) | Flow Indication | Value | Flow Indication | (%) | Flow Indication |
|---|
| Pure glimepiride | 0.375 | 0.811 | 47.124 | Poor | 2.162 | V.V.poor | 27.027 | Poor |
| SAPVPps | 0.322 | 0.361 | 31.591 | Good | 1.121 | Good | 12.048 | Good |
| SAPVPpf | 0.341 | 0.411 | 35.251 | Good | 1.205 | Fair | 13.698 | Good |
| SAPVPst | 0.312 | 0.319 | 24.749 | Excellent | 1.021 | Excellent | 10.638 | Excellent |
| SAPVPac | 0.337 | 0.428 | 39.941 | Fair | 1.271 | Passable | 21.348 | Passable |
| SAPVPgl | 0.315 | 0.344 | 28.057 | Excellent | 1.091 | Excellent | 11.494 | Excellent |
| SAPVPcp | 0.326 | 0.357 | 28.854 | Excellent | 1.095 | Excellent | 11.904 | Excellent |
| SAHPCpf | 0.315 | 0.375 | 32.415 | Good | 1.187 | Good | 15.789 | Good |
| SAHPCgl | 0.322 | 0.348 | 24.781 | Excellent | 1.081 | Excellent | 11.627 | Excellent |
| System | (a)-Valuecompactibility constant | (b)-Valuevelocityconstant |
|---|
| Pure glimepiride | 1.561 | 0.000521 |
| SAPVPps | 0.275 | 0.001411 |
| SAPVPpf | 0.199 | 0.000833 |
| SAPVPst | 0.041 | 0.001181 |
| SAPVPac | 0.625 | 0.000502 |
| SAPVPgl | 0.156 | 0.001111 |
| SAPVPcp | 0.237 | 0.000801 |
| SAHPCpf | 0.493 | 0.000526 |
| SAHPCgl | 0.111 | 0.001681 |