Preparation and optimization of carvacrol-loaded BSA nanoparticle
BSA nanoparticles were prepared by desolvation method (
17-
18). Briefly, after dissolving 50 mg of BSA in 1 ml of distilled water and adjustment of pH to 8.5, tween 80 (0.5%) was added to the solution and stirred at 500 rpm for 30 min. Twenty-five milligrams of carvacrol were dissolved in 4 mL of ethanol and gradually dropped into the aforementioned solutions. After the desolvation process, for particle cross-linking, 12 μL of 8% aqueous glutaraldehyde solution was added and stirred at 500 rpm at room temperature for 24 h. The nanoparticles were purified by centrifugation at 9,000 rpm for 30 min at 25 °C and the supernatant collected. The free BSA was measured in the supernatant by BCA (Bicinchoninic acid) protein assay method (Thermo scientific, USA). After ethanol precipitation of albumin, an ultraviolet (UV) spectrophotometer (Biochrom WPA Biowave II, UK) was used to measure the free carvacrol level in the supernatant. The absorbance of the supernatant was determined at 275 nm (carvacrol maximum absorbance) (
20).
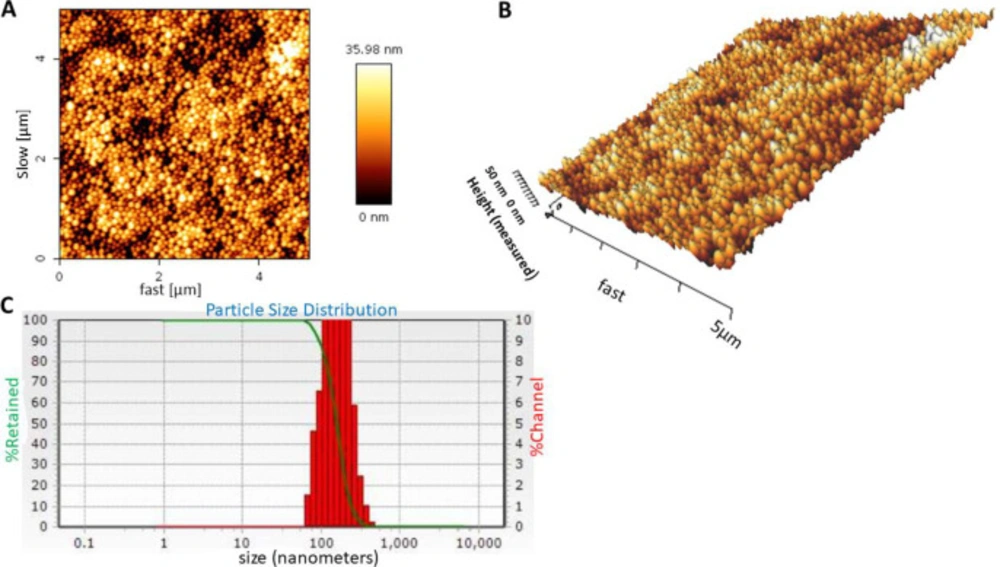
Particle size, zeta potential, and morphology of the nanoparticles were assessed using size analyzer, zeta analyzer, and atomic-force microscopy (AFM), respectively. The nanoparticles were dispersed in distilled water (pH 7.4) and their average size and zeta potential was evaluated by dynamic light scattering (DLS) (NANO-flex, Microtrac) and zeta analyzer (ZETA-check, Microtrac) instruments, respectively. A drop of nanoparticle sample was deposited on a slide, air dried and then scanned with atomic force microscopy (Agilent Technologies, Model 5500, Keysight technologies) for morphology and topography assessment of the nanoparticles. Measurements were performed in contact mode and CSE17 cantilever was used.
The encapsulation efficiency (EE), loading capacity (LC), and nanoparticles yield (Y
np) were calculated by the following Equations (
17,
21):
Arthritis induction and treatments
Thirty-five female Sprague Dawley rats (180-200 g) were kept under standard conditions. The rats were divided into five groups; each consists of seven animals. AIA was induced by a single subcutaneous injection of complete Freund’s adjuvant (CFA) containing 10 mg/mL of heat-killed Mycobacterium (H37 Ra) (0.1 mL) at the base of the rat tails, according to the previous studies (
22-
24).
A group of rats were injected with normal saline and received PBS intraperitoneally (IP) (normal). The arthritic groups were treated IP with 50 µL of a) olive oil as vehicle (untreated group), b) one-hundred milligram carvacrol/mL olive oil, c) two-hundred seventy-five milligram BSA nanoparticle/mL olive oil and d) three-hundred seventy-five milligram carvacrol-loaded BSA nanoparticle/mL olive oil every 3 days from the beginning of the arthritis induction. The rats were sacrificed on day 28 of arthritis induction and sera, lymph nodes and inflamed tissues were collected for further experiments.
AIA clinical score and body weight monitoring
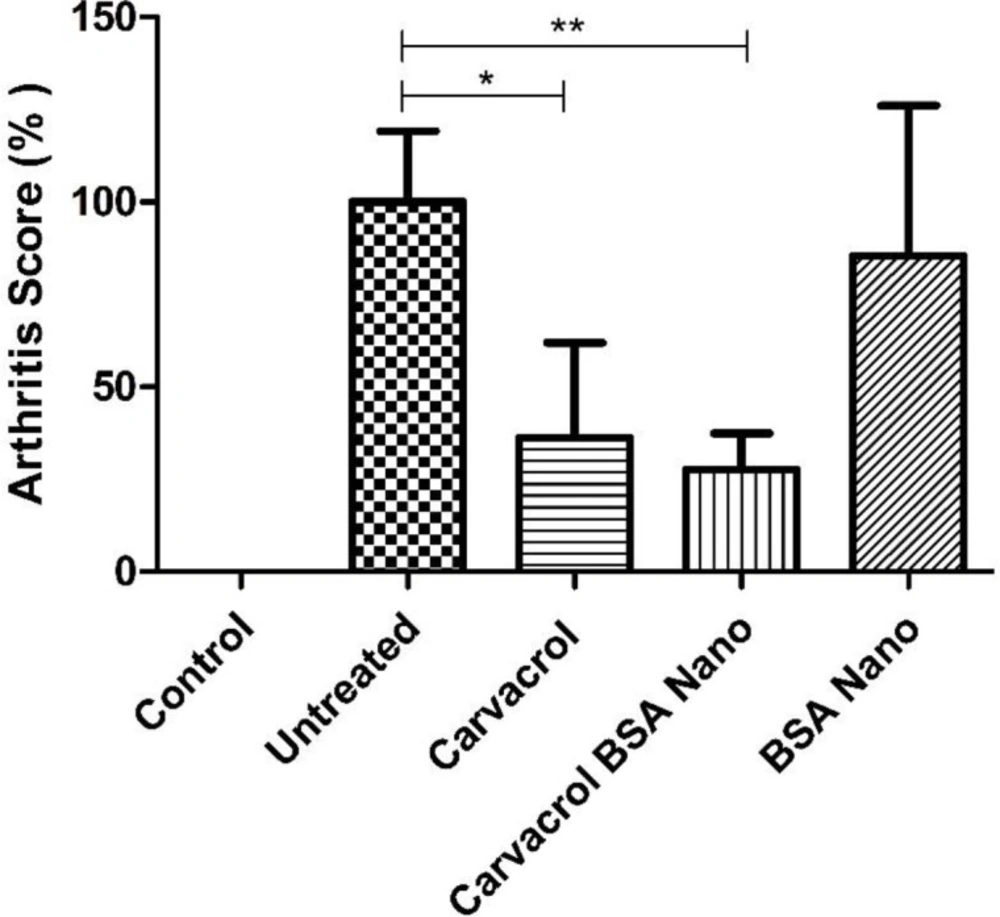
The clinical signs and weight of the rats in each group were assessed daily. An arthritis scoring system with maximum score of 16 was used to determine the severity of arthritis as the following. The level of arthritic inflammation of each paw was graded from 0 to 4 based on degree of erythema, swelling and joints deformation: 0 = normal; 1 = slight swelling or erythema of one toe or finger; 2 = swelling and erythema of two toes or fingers; 3 = severe swelling and erythema of the wrist or ankle; 4 = complete swelling and erythema of toes or fingers, joint deformity and lack of flexibility.
Erythrocyte sedimentation rate (ESR) evaluation
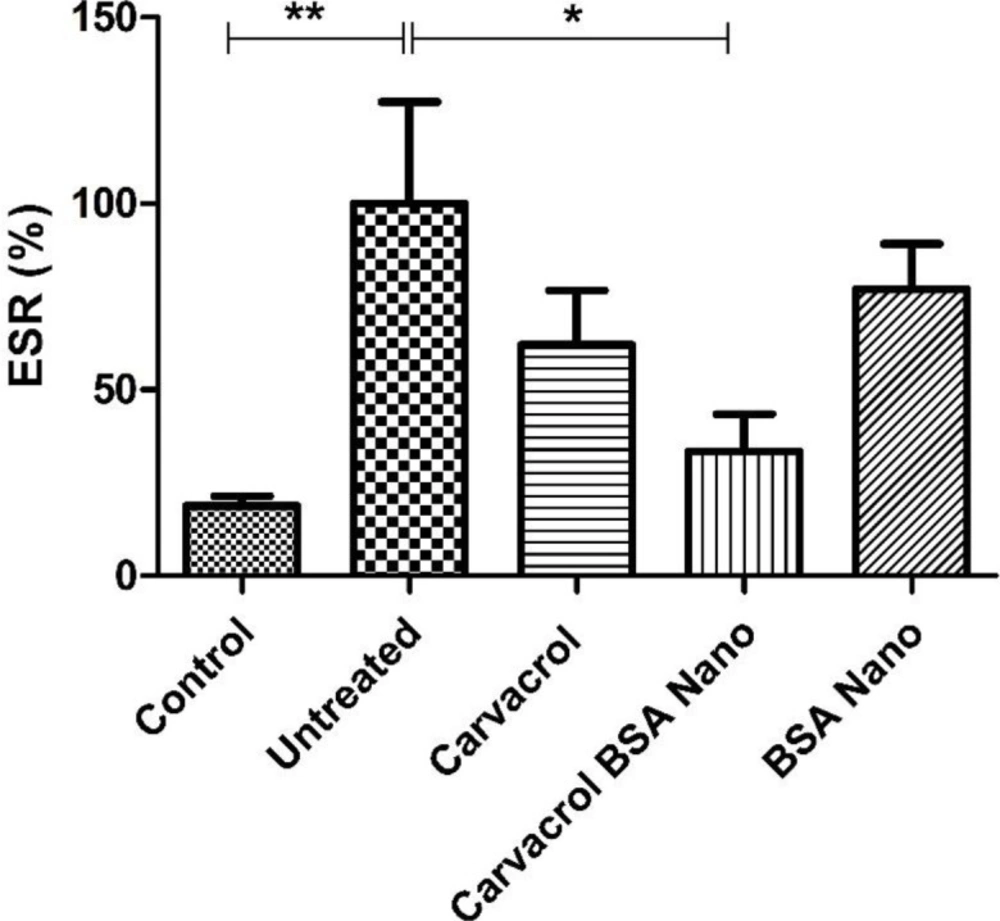
The level of ESR as an indicative of inflammation was determined by capillary tube test (micro-ESR). Briefly heparinized capillary tubes were filled with the citrated venous blood up to the 10-cm mark (0.2 mL of blood). The tubes were kept vertical and read after 1 h for the sedimented red cell level.
Determination of nitric oxide (NO) concentration
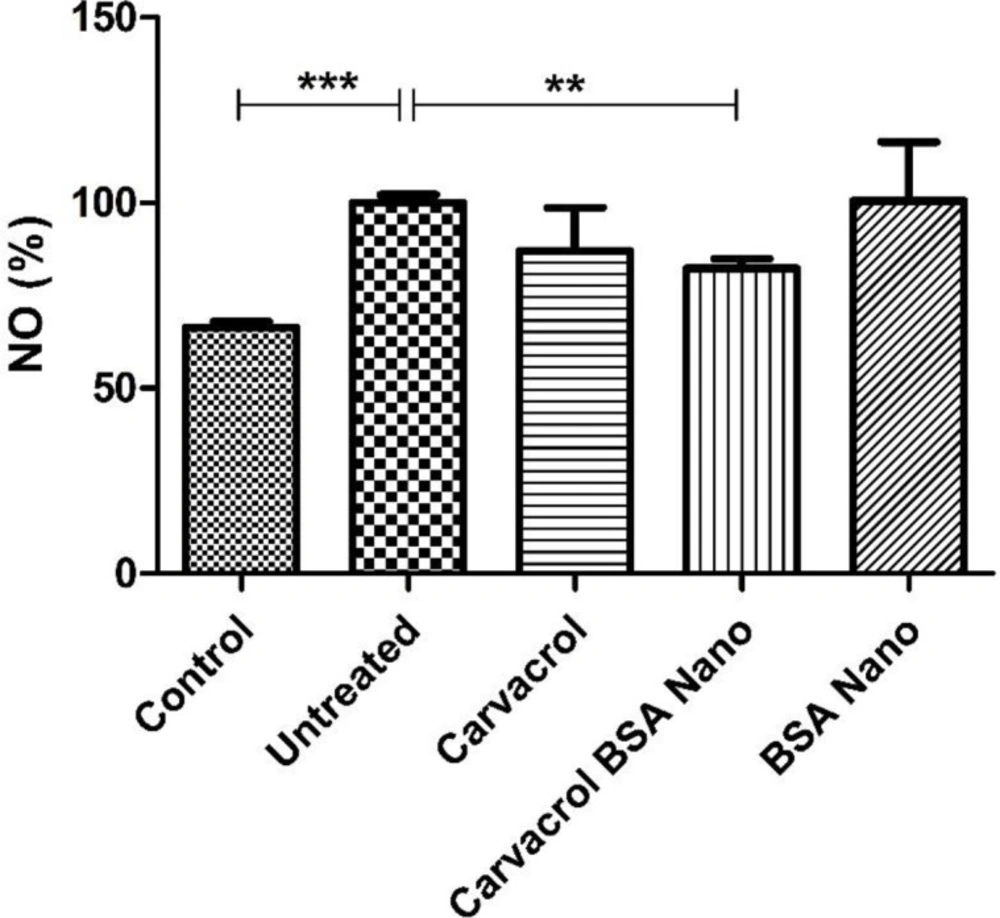
NO production was measured using the colorimetric method of Griess in inflamed tissue extracts (
25). Eighty microliters of the tissue extracts were mixed with an equal volume of Griess reagent and incubated for 10 min at room temperature. The OD of reaction product was measured at 550 nm and nitrite concentrations calculated by comparing the OD values for the test samples to a standard curve generated by serial dilution of sodium nitrite.
Real-time PCR analysis of inflammatory cytokines
RNA from the inguinal lymph node cells was prepared using Parstous RNA extraction kit according to manufacturer instructions. Concentration and purity of RNA samples were checked using a Picodrop system (Picodrop, Hinxton, UK) and gel electrophoresis. Then, 10 μL of RNA from each condition were reverse-transcribed to cDNA using high-capacity cDNA reverse transcription kit in the presence of reverse transcriptase, dNTP mix, and random hexamer at 37 °C for 120 min. For analysis of TNF-α and IL-1β, real-time PCR was performed in a final volume of 20 μL containing 2 μL cDNA, 10 μL SYBR Premix Ex Taq II, 0.8 μL forward primer (10 pM), 0.8 μL reverse primer (10 pM), 0.4 μL ROX reference dye2, and 6 μL double-distilled water. The primers used were: β-actin [forward], 5-GCAAATGCTTCTAGGCGGAC-3; β-actin [reverse], 5-AAGAAAGGGTGTAAAA-CGCAGC-3; TNFα [forward], 5-TCAGCCTCTTCTCAT-TCCTGC-3; TNFα [reverse], 5-TTGGTGGTTTGCTACGACGTG-3; IL-1β [forward],50-GACAGAACATAAGCCAAC-3; and, IL-1β [reverse], 5-CACAGGACAGGTATAGAT-3; IL-17 [forward], 5-CTACCTCAACCGTTCCACTT-3; and, IL-17 [reverse], 5-ACTTCTCAGGCTCCCTCTTC-3. Real-time PCR was performed in an Applied Biosystems StepOne system (Foster City, CA). PCR conditions were as follows: one cycle at 95 °C for 30 sec, followed by 40 cycles at 95 °C for five sec, 59 °C for 18 sec, and 72 °C for 30 sec. β-actin served as an endogenous control and results of target mRNA levels were normalized against β-actin mRNA in each sample.
Cytokine assay
The levels of TNF-α and IL-1β cytokines in the rats’ sera and inflamed tissue extracts were measured by enzyme-linked immunosorbent assay (ELISA) kits with the sensitivity of 16 and 39 pg/mL, respectively (eBioscience, USA). The collected inflamed tissues were weighed and immediately homogenized using a TissueLyser device (Qiagen, Hilden, Germany) in 1 mL of ice-cold homogenization buffer (Tris, 10 mol/L; NaCl, 50 mmol/L; MgCl2, 2.5 mmol/L, pH 7.4) containing protease inhibitor (PMSF, 1 mM). The tissue homogenates were centrifuged at 15000 × g for 40 min at 4 °C, and then the supernatant was collected and stored at −80 °C until used. ELISA assay was performed as described by the manufacturer. Briefly, 96-well micro plates were coated an overnight with 100 μL capture antibody at 4 °C. The plates were blocked, and different standards and samples (100 μL/well) were added to the appropriate wells and incubated an overnight at 4 °C. Kit-provided detection antibody (100 μL) was added to wells and the plate incubated for 1 h at room temperature. After washing, 100 μL of streptavidin-HRP (30 min), 100 μL of tetramethylbenzidine (TMB) substrate (15 min), and then 50 μL of stop solution (1 M phosphoric acid) was added. The absorbance of reaction was measured using a microplate reader (Biotek, Nevada, USA) at 450 nm with a background subtraction at 570 nm.
Statistical analysis
The data were expressed as mean ± SD unless otherwise specified. Significant differences between the groups were evaluated using Prism software (GraphPad, San Diego, USA) containing appropriate statistical tests e.g., one-way ANOVA, and a Student’s t-test. A p-value < 0.05 was considered significant.