Functional effects of LAW on CAT (kinetics studies)
To study the impact of LAW on the function of CAT, the UV-vis spectrophotometer was applied. At first, the kinetic parameters of CAT were determined by assaying enzyme in the presence of incremental amounts of H
2O
2 (10-70 mM) and appropriate concentration of CAT (4 nM). The rate of decomposition of substrate by CAT was evaluated at 240 nm and reduction in H
2O
2 absorption per unit time that was considered as enzyme function at 25 °C. Based on our previous studies, BLC activity was increased with raising the substrate concentration from 10 to 55.5 mM. Addition of higher concentration of H
2O
2 (more than 55.5 mM) significantly reduced enzyme activity due to inhibitory effect of substrate(
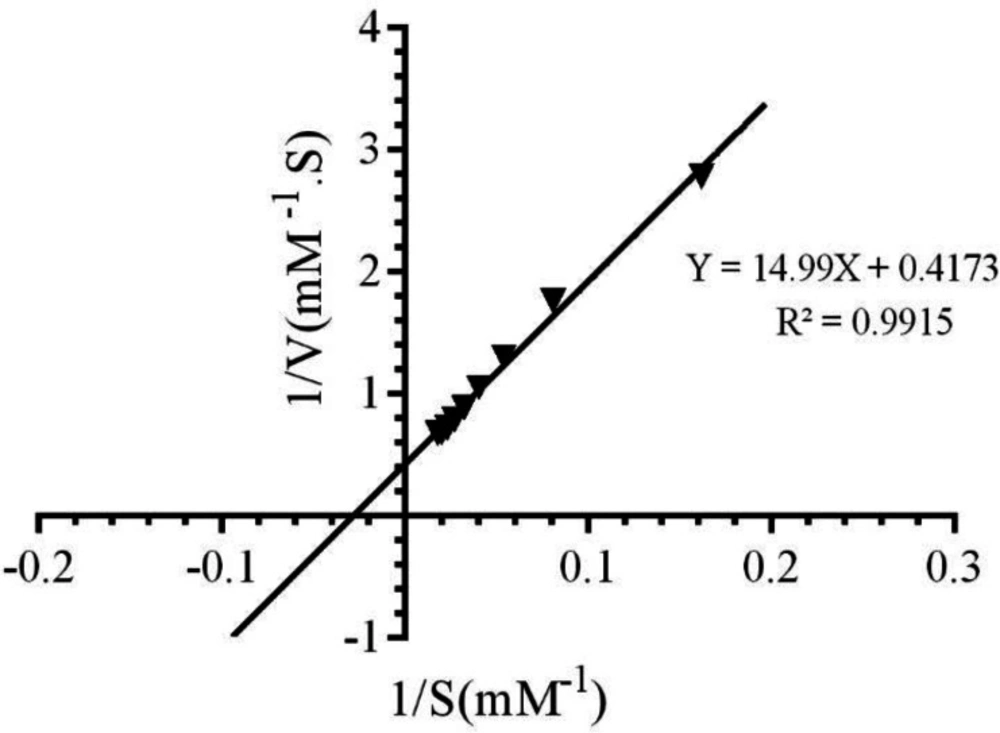
21). Different kinetic parameters of CAT have been calculated by Lineweaver-Burk plot, as it is shown in
Figure 2 and equation 1.
(1)
The values of Km, Michaelis-Menthen constant, and Vmax for the free enzyme were obtained as 35.92 mM and 2.39 mM.S-1, respectively. Also, the value of Kcat, catalytic constant was determined as 5.9 × 10⁵ s-1, using equation (2):
(2)
where, [Et] incorporates the total CAT concentration.
To identify the alterations in the function of CAT by LAW, the enzyme activity was evaluated in the presence of increasing concentrations of LAW (1.42, 2.84, 5.68, 11.36 and 17.04 μM) and optimum concentration of H
2O
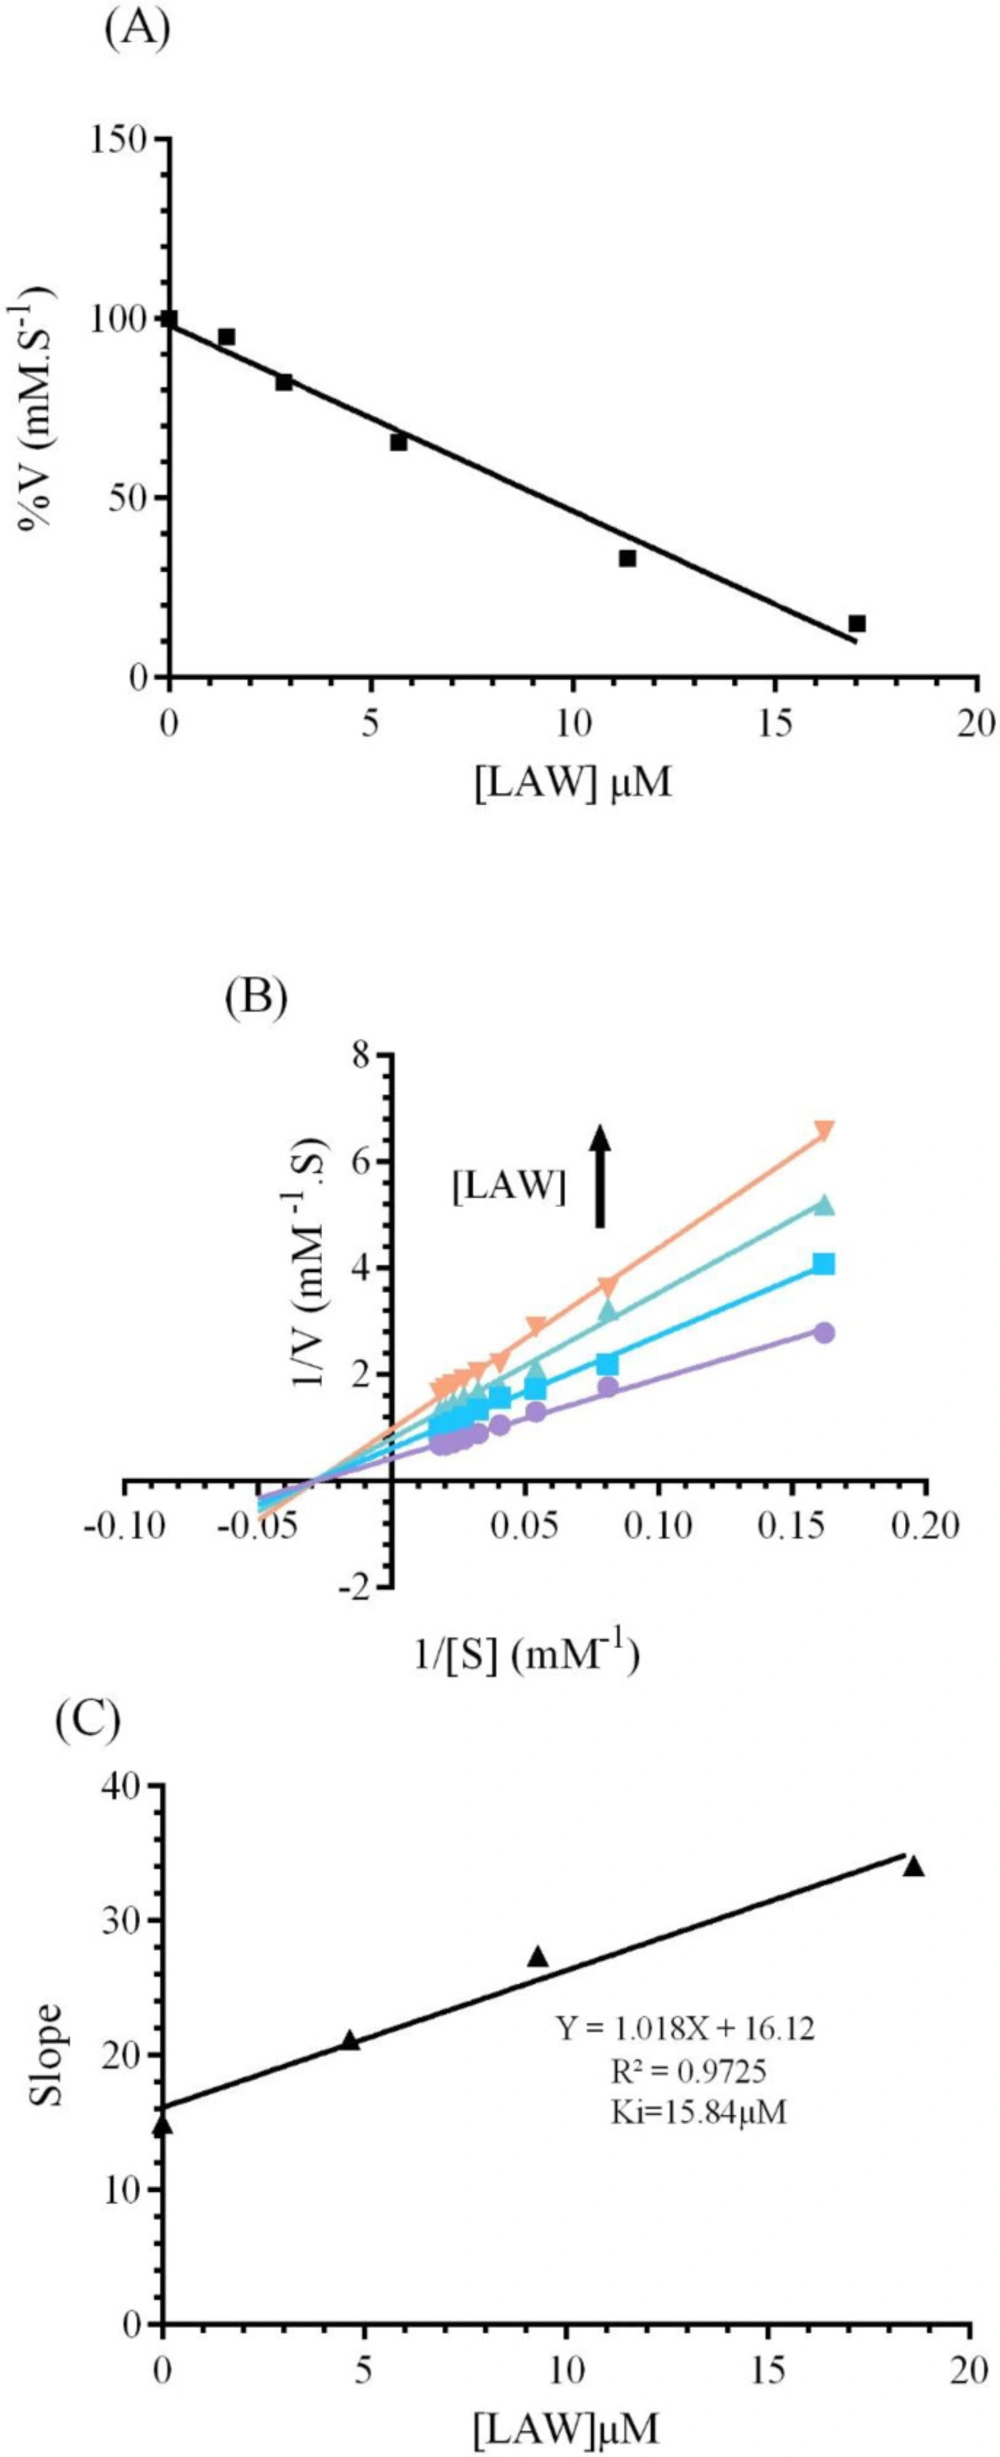
2 (55.5 μM). The results of this experiment showed that an increase in the concentrations of LAW cause a significant decrease in the enzyme activity. The value of IC
50, was approximated 9.3 μM using
Figure 3A.
Three different types of reversible inhibitory mechanism for the enzyme have been defined: (a); competitive inhibition in which the inhibitor and free enzyme connect to each other through enzyme active site (b); noncompetitive inhibition in which inhibitor connects to both the free enzyme at a site that is different from the substrate binding site and the enzyme–substrate complex and (c); uncompetitive inhibition in which inhibitor can bind reversibly to the enzyme–substrate complex to yield anticompetitive inhibition (
24).To realize the inhibitory mechanism of CAT by LAW, alterations in the enzyme activity were measured after forming the complex with different concentrations of LAW (4.6, 9.3 and 18.6 µM). The Lineweaver–Burk plots were drawn (
Figure 3B). The kinetic parameters (
Km and
Vm) were computed using Lineweaver-Burk plots and compared with kinetic parameters of native enzyme(
25). With increasing the concentration of LAW, the
Km (35.92) didn’t show significant alteration in the presence of LAW, whereas values of
Vmax of the enzyme decreased from 2.39 mM.s
-1 for free BLC to 1.64mM.s
-1 ,1.26mM.s
-1and 1.036mM.s
-1 for the enzyme in the presence of incremental concentration of LAW (4.6, 9.3 and 18.6 µM). As a result, LAW acts as a non-competitive inhibitor for catalase. The
Ki value was obtained from the equation (3) and (
Figure 3c) as 15.77µM.
(3)
Fluorescence spectroscopy
The fluorescence spectroscopy was performed to predict the changes in the protein structure through interaction with various ligands. It gives valuable information around structural changes, binding mode, quenching mechanism, and binding constants (
22).Fluorescence quenching is the reduction of fluorescence intensity of a fluorophore which results from some processes such as molecular rearrangements, energy transfer and etc (
26). Bovine liver catalase consists of four polypeptide subunit, which each subunit contains 6tryptophan (Trp) and twenty Tyr residues (
2,
11).Three aromatic residues (tyrosine, tryptophan, and phenyl alanine) of BCL lead to intrinsic fluorescence emission. In this experiment, the 280 nm as an excitation wavelength has been used to measure the fluorescence quenching mechanisms of CAT(
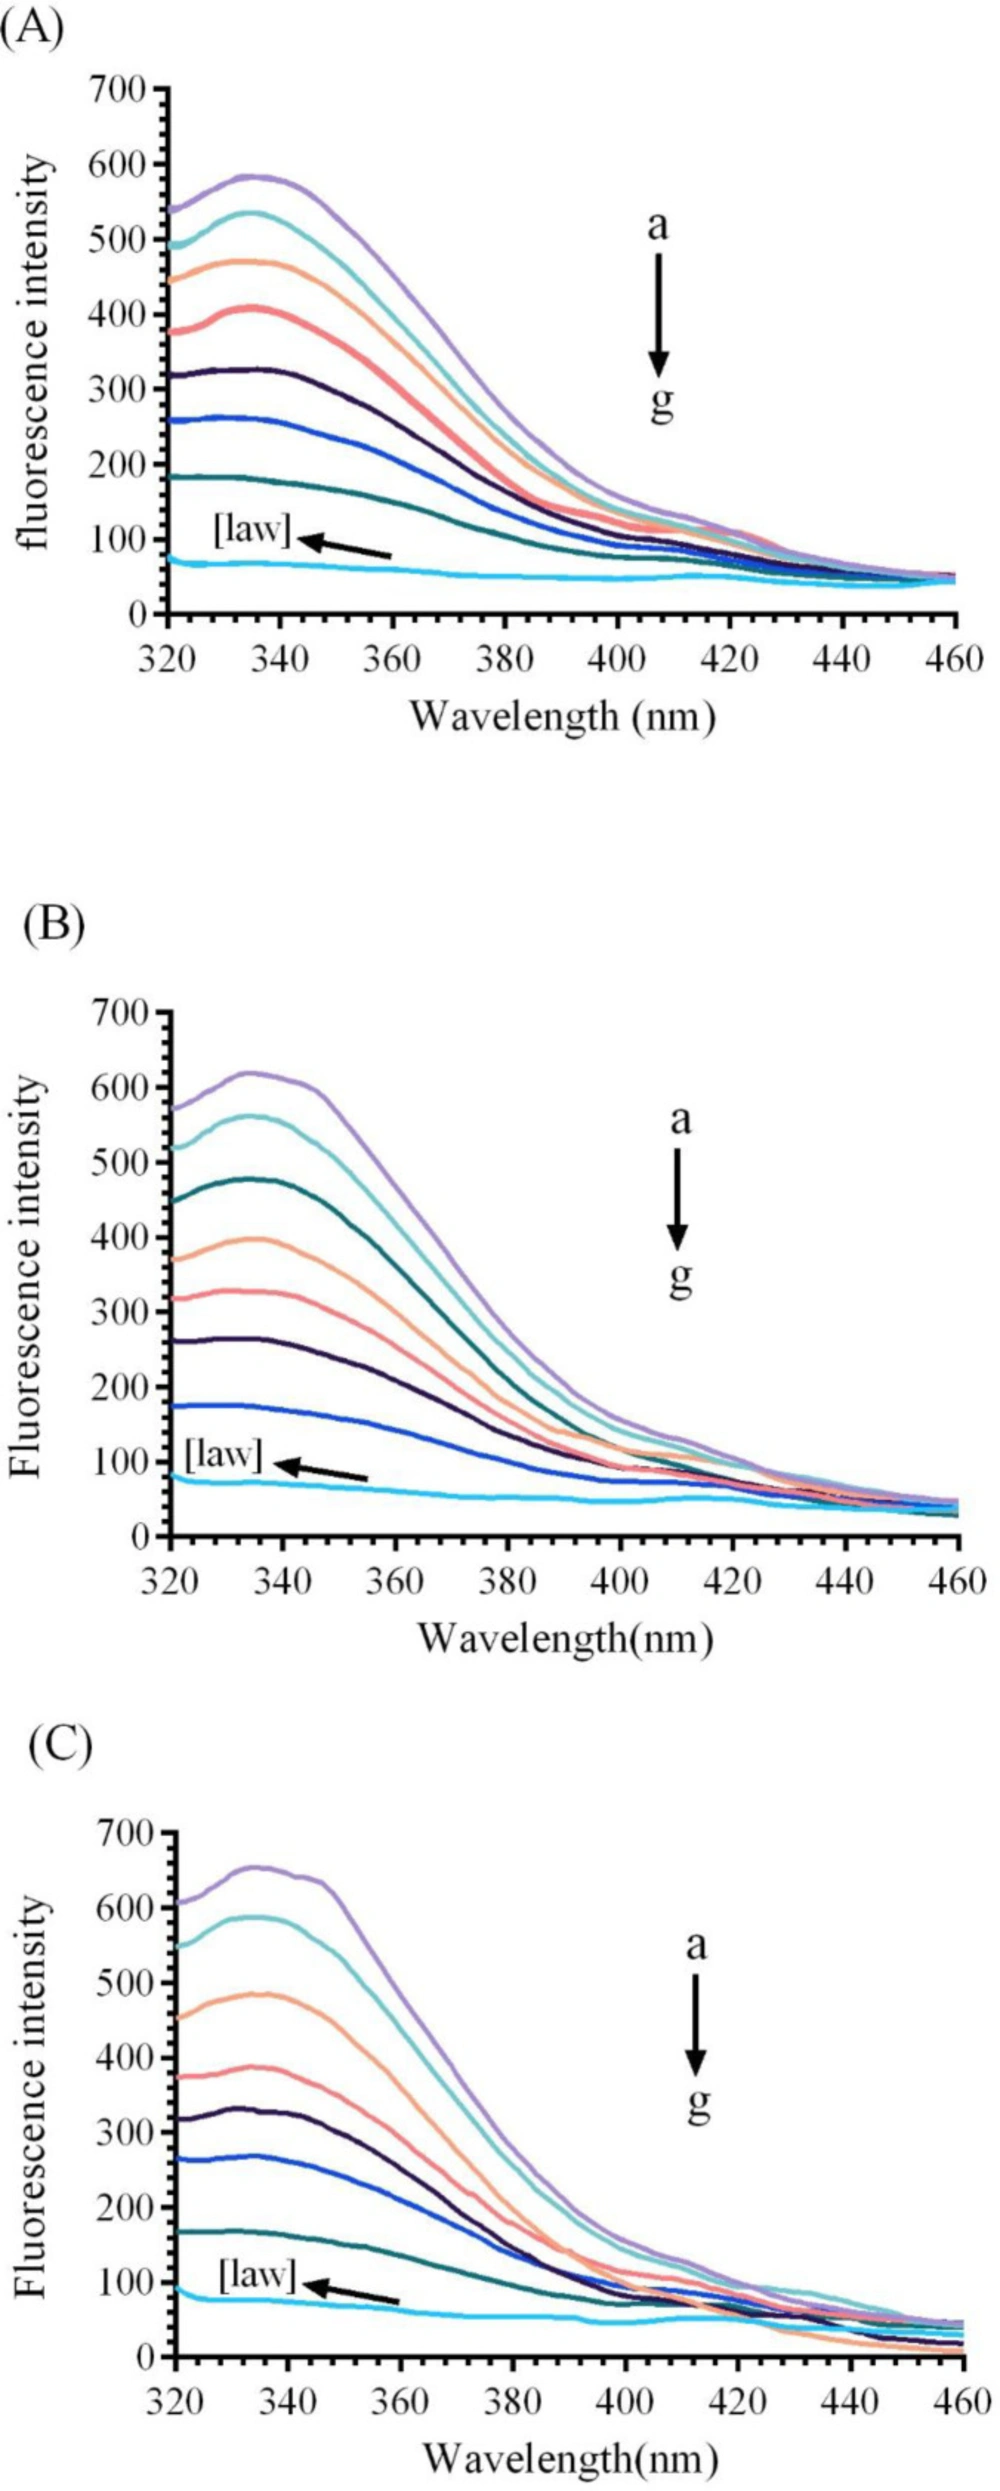
21). Native enzyme shows a fluorescence emissions peak at 338 nm. As it can be observed in
Figure 4, the fluorescence spectrum of the CAT gradually reduces with increasing the concentrations of LAW (0.47, 4.7, 11.8, 14.2, 23.6 and 37.8µM) at 25, 30, and 37 °C.
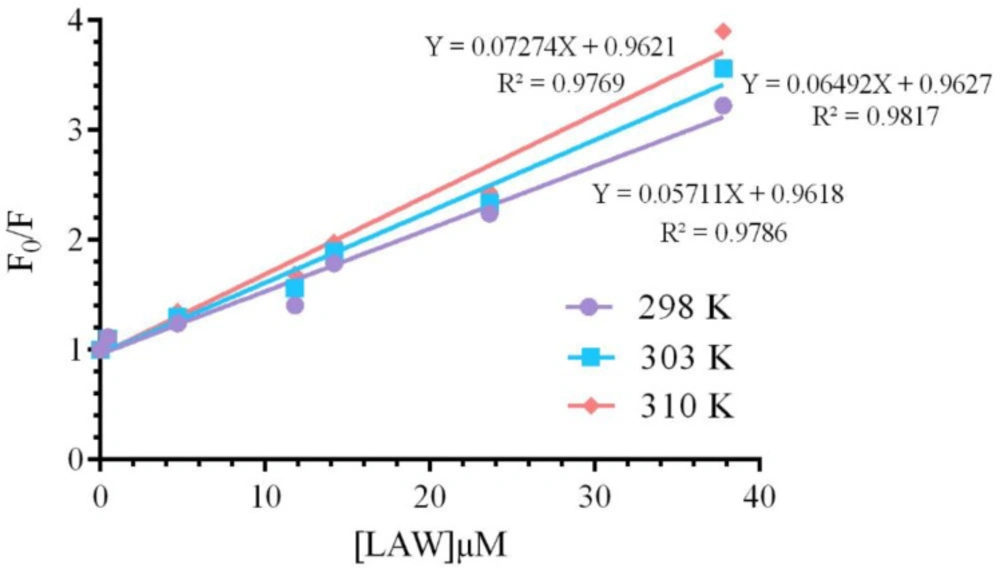
Static and dynamic quenching, as two distinct quenching mechanisms, derive from the dependence of ligand-biomolecule interaction process on temperature. In static quenching, enhancing temperature leads to reduce the bimolecular quenching constant, but in dynamic quenching, enhancing temperature cause increase in the value of quenching constants (
27). To confirm the quenching mechanism of CAT in the presence of LAW, Stern-Volmer equation (
4) was used;
(4)
where,
F and
F0 are the fluorescence intensities of enzyme with and without the quencher (LAW), respectively,
[Q] is the total concentration of the quencher (LAW),
KSV is the Stern–Volmer quenching constant (
28).The
KSV value was calculated applying the
F0/F vs. [Q] plot (
Figure 5) at two different temperatures and are listed in
Table 1. These data indicated that the values of
KSV increase with raising temperature, so the quenching mechanism is dynamic.
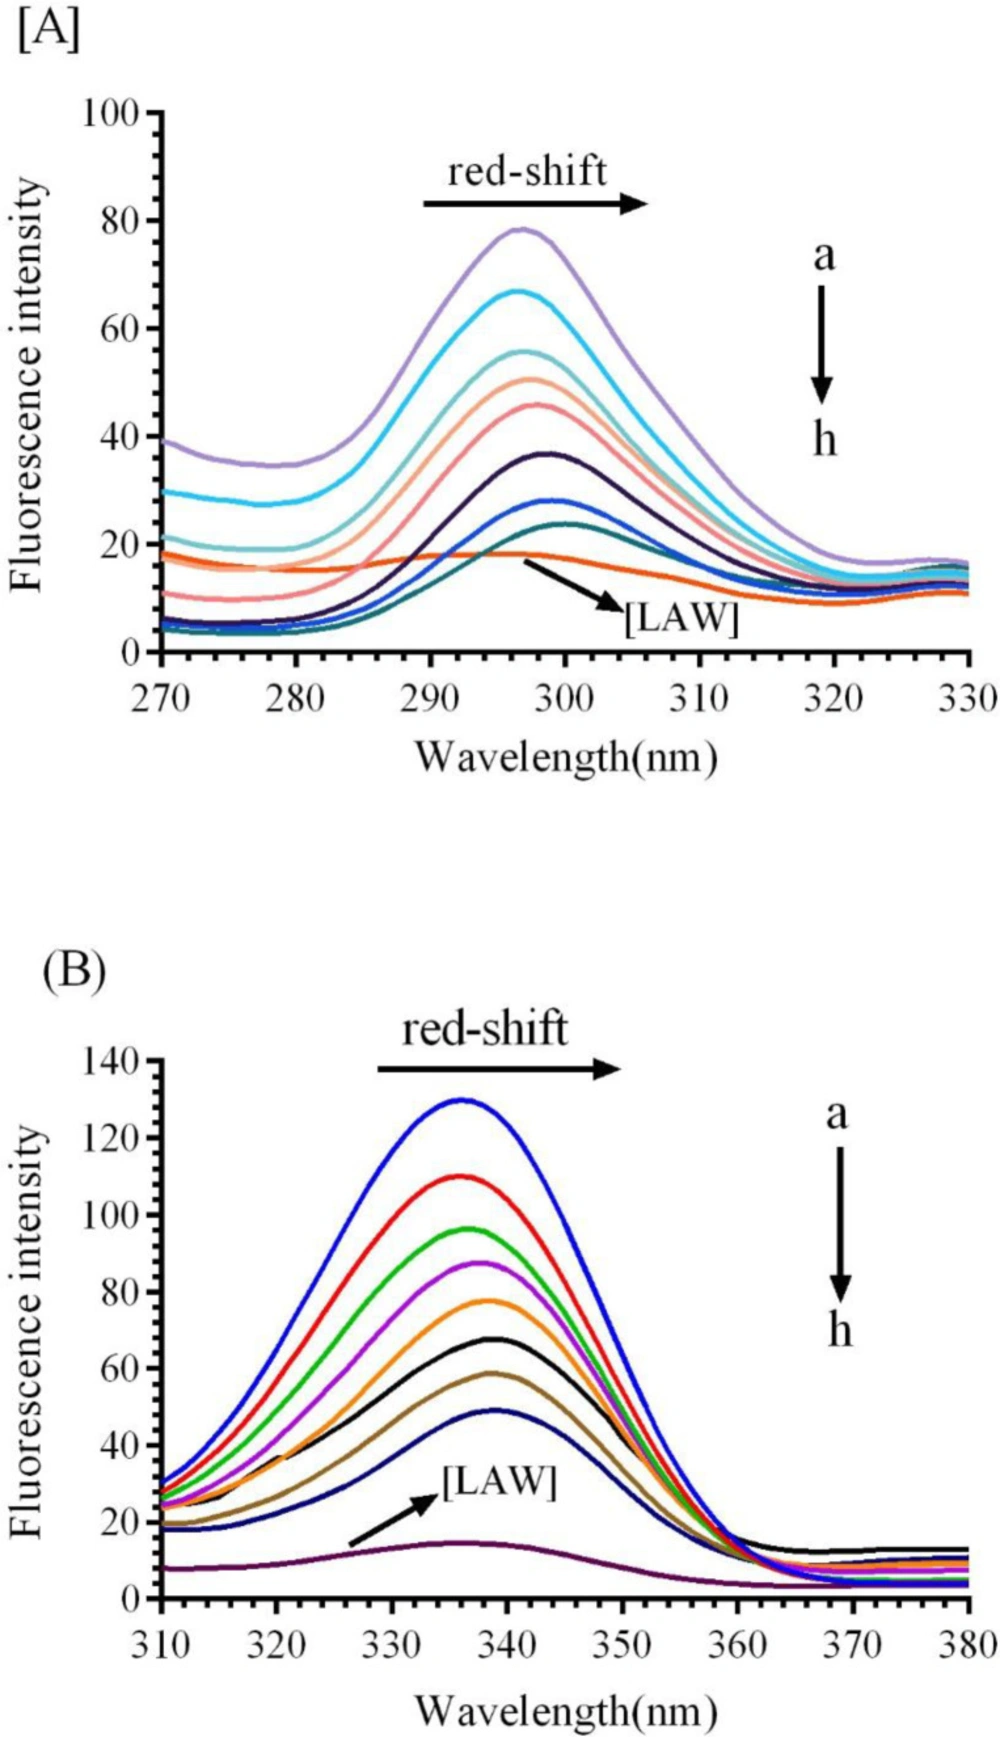
Synchronous fluorescence study
Synchronous fluorescence was applied to notify significant report about the microenvironment of CAT fluorophore groups (Trp and Tyr). In synchronous fluorescence, the spectra of molecules are taken from simultaneously scanning the excitation and emission spectra, when the wavelength intervals (∆λ) maintained at 15 nm and 60 nm for Tyr and Trp, respectively (
29).Additional concentrations of LAW lead to gradual reduce in the fluorescence intensity of BLC indicating complex formation between BLC and LAW. As shown in
Figure 6, different concentrations of LAW induce a clear red shift in ∆λ=60 nm and very small red shift in ∆λ=15 nm in comparison with the native CAT, implying that the Trp and Tyr are located in a polar environment.
Thermodynamic parameters and binding studies
The number of binding sites (n) and binding constant (Ka), were obtained from the equation 5;
(5)
The binding constant
Ka and the number of binding sites
“n”, were calculated by using the plot
vs. log [Q] (
Figure 7) and the results were listed in
Table 1.
Ka and
“n” were determined by using the intercept and slope values, respectively. The number of binding sites at both temperatures (25, 30 and 37 °C) was determined approximately equal to 1 (
n≈ 1), describing that one molecule of LAW can bind to one molecule of catalase and CAT has only one binding site for LAW. The
Ka was enhanced by increasing the temperature, originated from an endothermic interaction between the CAT and LAW. The
Ka value was ≈10
3, illustrating that there is a strong binding force between LAW and CAT(
30). There is diverse mode of interaction between proteins and ligands such as electrostatic interactions, hydrogen bonds, hydrophobic forces, and van der Waals (
11).Utilizing the thermodynamic parameters including enthalpy change (ΔH), entropy change (ΔS), and free energy change (ΔG), binding forces was estimated(
31):1) ∆H ˂ 0 and ∆S > 0 imply that electrostatic forces is more important, 2) ∆H ˂ 0 and ∆S ˂ 0 illustrate hydrogen bonding to play the main role in the interaction, 3) ∆H ˃ 0 and ∆S ˃ 0 suggest hydrophobic bounding is dominant and 4) ∆H ˃ 0 and ∆S ˂ 0 indicate van der Waals forces are main (
21,
32). van’t Hoff and the following equations (6 to 8) were used to calculate the changes in enthalpy (ΔH), Gibbs free energy(ΔG), and entropy (ΔS), respectively (
10). All of thermodynamic parameters are given in
Table 1.
(6)
(7)
(8)
The positive values, obtained from enthalpy changes (∆H) and the entropy changes (∆S) reflected that the hydrophobic boundings play a major role in the arrangement of the LAW-CAT complex and the negative quantity of ΔG illustrated that interaction of LAW with CAT is a spontaneous process (
3,
21,
33).
UV-vis spectroscopic studies
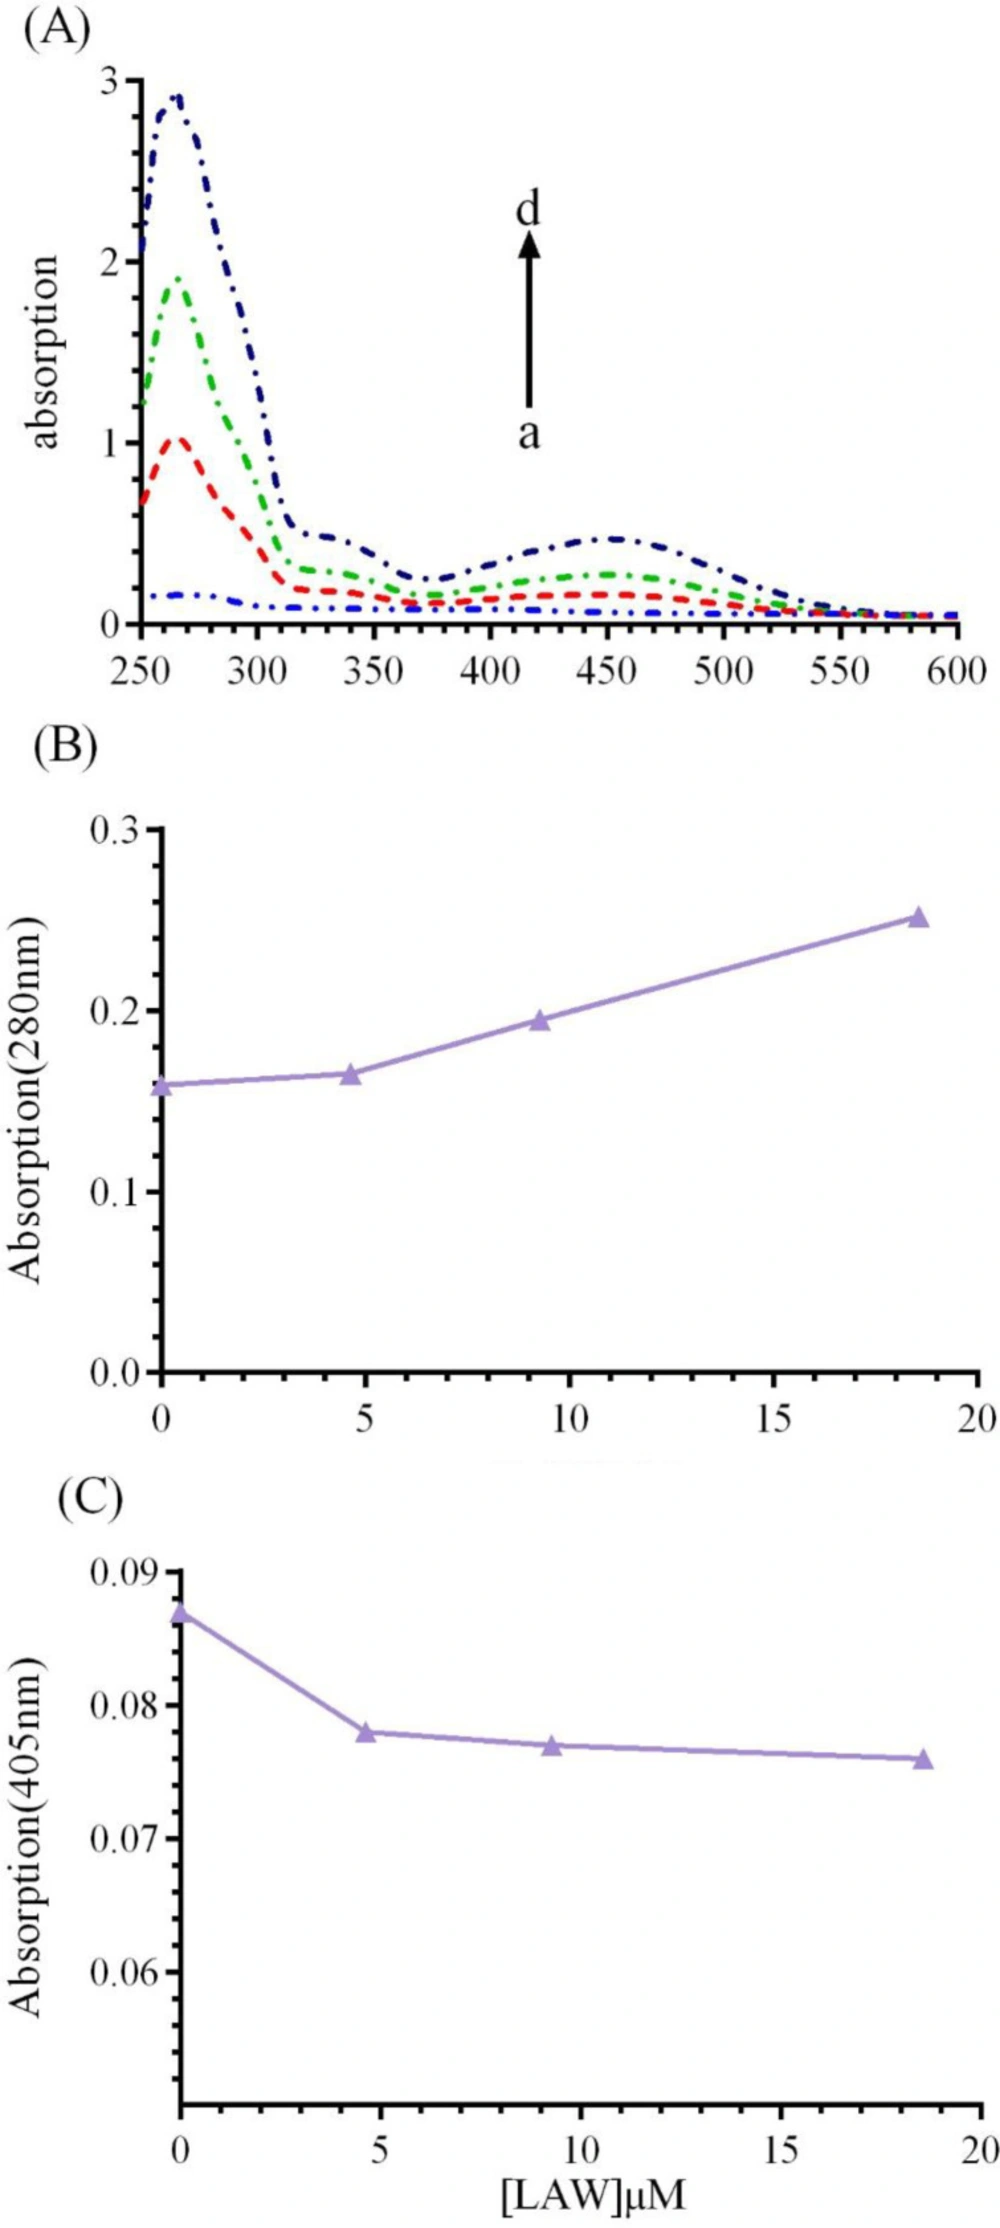
UV-vis absorption study can be applied to explore the structural change of BLC upon interaction with LAW. BLC, like most of heme proteins has two principal absorption area: (1) an absorption band at 280 nm, which is resulted from the aromatic residues including tryptophan (Trp), phenylalanine (Phe), and tyrosine (Tyr) (
8,
30) and (
2) Soret absorption band around 405 nm, which corresponding to π→π* transfer of electrons in the heme group(
11).UV-vis spectra of CAT (1 μM) were monitored in the presence of growing concentrations of LAW (4.6, 9.3 and 18.6 µM) at 298 K (
Figure 8). The results indicated that with raising the concentration of LAW, the maximum absorption intensities at 280 nm and 405 nm were enhanced and weakly decreased, respectively. Raising the absorbance at 280 nm shows that the interaction between CAT and LAW leads to change in Trp position and protein conformation. Weak change in the absorbance intensity at 405 nm illustrates a minor structural perturbation in the active site of the CAT.
ATR-FTIR spectroscopy
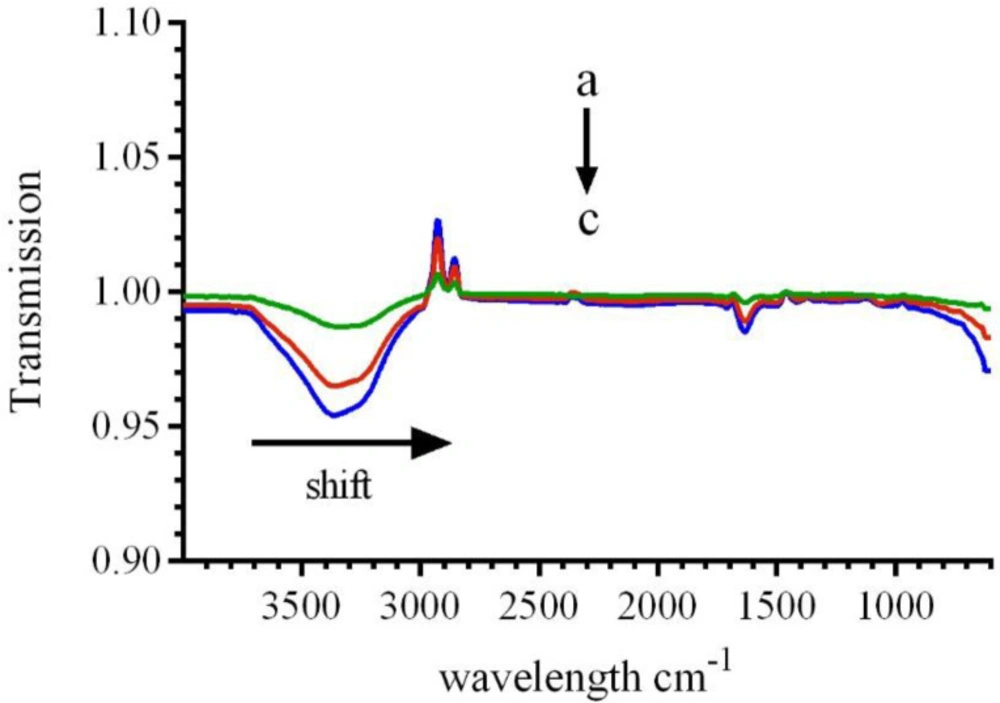
In order to prove the changes in the secondary structure of the CAT, FT-IR spectroscopic analyses were conducted. The FT-IR spectra of catalase demonstrated three amid bonds (I, II and III). Among the several binding groups of CAT, the amide I in the range of 1600–1700 cm
−1(generally caused by C=O stretching vibration), is more sensitive to conformational variations and is mostly applied to analyze the secondary conformation of the proteins. The absorbance intensity of the amide II band in the range of 1500–1600 cm
−1 (resulted from C-N stretch vibration combined with N-H bending mode) has been illustrated to be related to the amount of the enzyme-ligand complex. As shown in
Figure 9, addition of various concentrations of LAW leads to change in FT-IR spectra of BLC. A shift in amide I from 1637.5 cm
−1 (for free CAT) to 1635.5cm
−1 and 1632.6 for additional concentrations of LAW (9.4 and 23.6 µM), respectively, and reducing the intensity demonstrated the change of the secondary structure and loss of CAT functionality. The amide II, which is located at 1537.2 cm
−1had no position shifts, while the intensities were decreased significantly in the LAW-BLC complex, which indicated the reason of maintaining the certain activity of the enzyme. Previous studies have demonstrated that a shift in amide I bands is resulted from various secondary con formational elements: 1620–1645 cm
−1from β-sheet, 1645–1652 cm
−1for random coils, 1652–1662 cm
−1from α-helix, and 1662– 1690 cm
−1for turns. So LAW mainly changes the secondary structure of β-sheets in BLC structure (
27,
34,
35).
Molecular docking studies
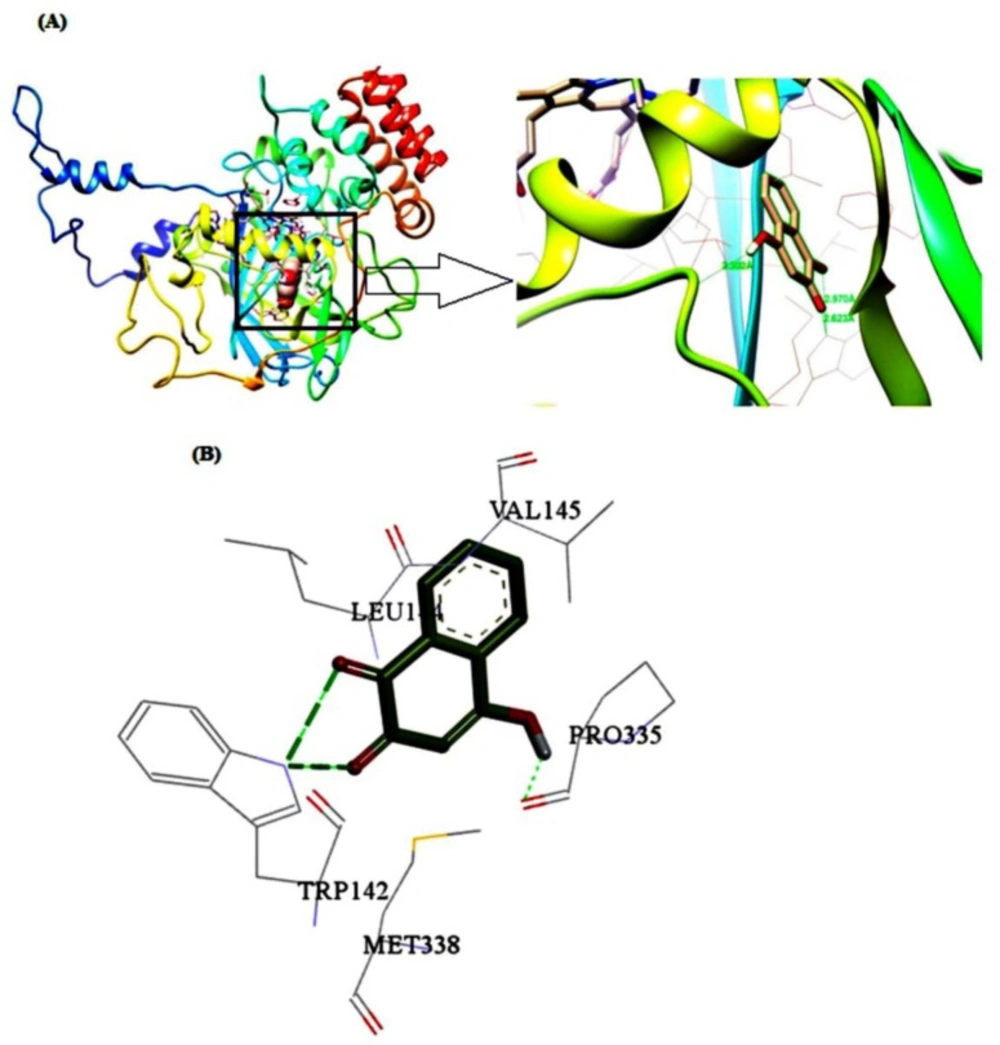
To identify the details of the best binding sites and dominant interaction of the ligand-macromolecule complex, the molecular docking computation was carried out based on the minimum energy. According to the obtained results, CAT has one binding site for LAW which is located close to the heme group and between the β-barrel, helical domain and wrapping domain of CAT (
Figure 10). Five residues including Trp142, Leu144, Val145, Pro335, and Met338 are involved in the interaction of BLC and LAW. These results are in agreement with synchronous fluorescence data discussed earlier. The driving forces in the interaction between BLC and LAW are composed of hydrophobic and hydrogen bondings, whereas the prior boundings are dominant. The hydrogen bonds were formed between Trp142 and Leu144 as an electron acceptor and electron donor, respectively. The quantity of lowest binding free energy was computed as -3.85 kcal mol
1 (
3,
12,
36). Different values of free energy, obtained from fluorescence and docking simulations may result from various factors such as rigidity of receptor, flexibility of ligand, and effect of buffer solution.
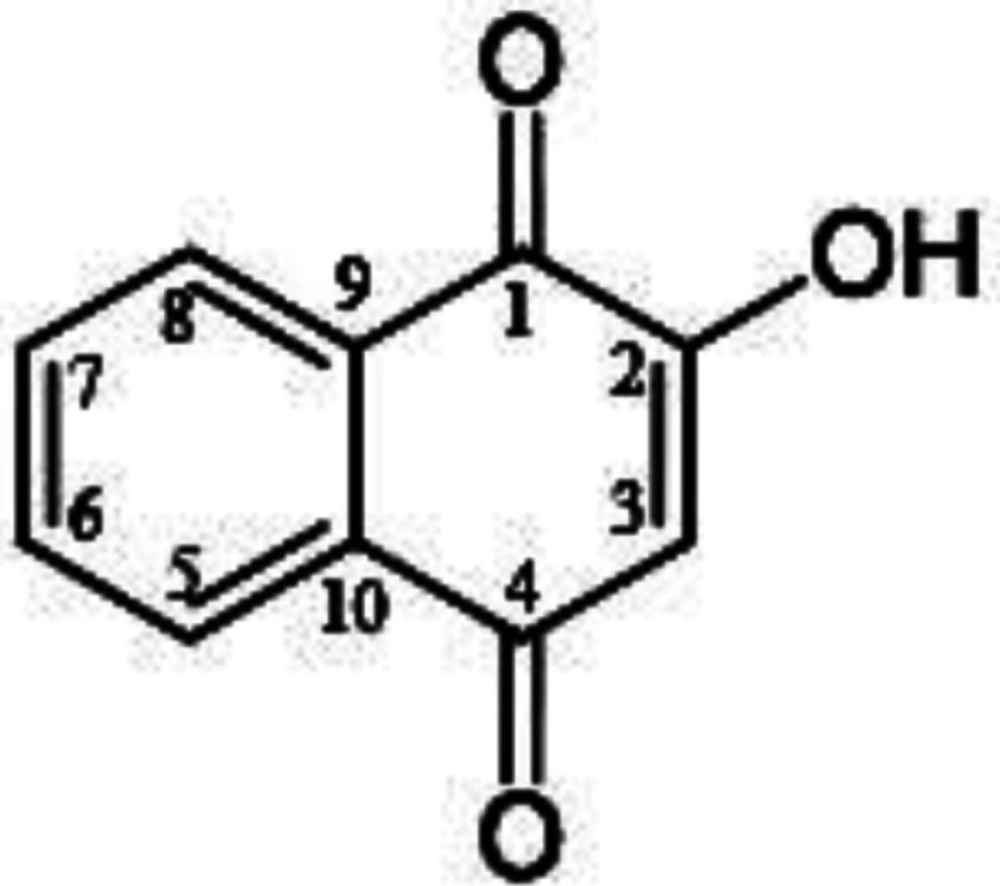
Chemical structure of lawsone (2-hydroxy-1,4-naphtoquinone).
Lineweaver-Burk plot of bovine liver catalase activity in the presence of different concentrations of H2O2 (10‐70mM) in 50 mM phosphate buffer, pH 7.0 at 298 K
(A) The effect of various concentrations of LAW (0, 1.4, 2.84, 5.68, 11.36 and 17.04 µM) on the activity of BLC (4 nm) in 50 mM phosphate buffer, pH 7 at 298 k. (B) Lineweaver-Burk plot of BLC (4 nm) with and without various concentrations of LAW: 0, 4.6, 9.3, 18.6 µM in 50 mM phosphate buffer, pH 7, 298 k. (C) Secondary plot of BLC activity using the slopes of the primary Lineweaver–Burk plots versus concentrations of LAW
Fluorescence emission spectra of bovine liver catalase (BLC) in the presence or absence of different concentrations of LAW at 280 nm excitation wavelength, BLC concentration: (0.7 µM); LAW concentrations:(a) 0, (b) 0.47, (c) 4.7, (d) 11.8, (e) 14.2, (f) 23.6 and (g) 37.8 µM, (h) only LAW, 0.7 µM, (A) 298 K, (B) 303 K, (C) 310 K
Stern- Volmer plots for the bovine liver catalase fluorescence quenching by LAW at 298, 303 and 310 K
Synchronous fluorescence spectra of BLC in the presence of incremental concentration of LAW (a) 0, (b) 0.47, (c) 4.7, (d) 9.4, (e) 11.8, (f) 14.2, (g) 23.6 and (h) 37.8µM, (i) enzyme free LAW (0.7 µM); (A) ∆λ=15 and (B) ∆λ=60 nm at 298k
The linear plot of Log F0-F/F vs. Log [LAW] for quenching of BLC in the presence of LAW at 298, 303 and 310 K
(A) UV-vis spectra of BCL (1μM) in the absence or presence of different concentrations of LAW; (a) 0, (b) 4.6, (c) 9.3 and (d) 18.6 µM in 50 mM phosphate buffer, pH 7, at 298 k, (B) LAW increases the absorption intensity of BLC at 280 nm, (C) LAW decreases the absorption intensity of BLC at 405 nm
FTIR spectra of BLC (0.7 µM) in the absence or presence of different concentrations of LAW; (a) 0, (b) 9.4, (c) 23.6 in 50 mM phosphate buffer, pH 7, at 298 k
Molecular docking models for BLC-LAW complex. (A) The structure of one subunit of BLC binding site for LAW. (B) Detailed illustration of the binding between BLC and LAW
| T (K) | n | KSV (×104M-1) | K (×103M-1) | ΔG kJmol-1 | ΔHkJmol-1 | ΔS JK-1mol-1 |
|---|
| 298 | 0.7 | 5.7 | 1.97 | -18.79 | 10.23 | 98.08 |
| 303 | 0.7 | 6.4 | 2.2 | -19.38 | | |
| 310 | 0.7 | 7.2 | 2.6 | -20.26 | | |

![The linear plot of Log F0-F/F vs. Log [LAW] for quenching of BLC in the presence of LAW at 298, 303 and 310 K](https://brieflands.com/journals/ijpr/articles/124434/figures/ijpr-19-383-g007-preview.webp)