Plant material and extraction
The roots of A. tenuifolia were collected from Qazvin province in June (2011), and identified by Dr. Yousef Ajani. A herbarium specimen (No. 1624) has been deposited in the Herbarium of Institute of Medicinal Plants, Jahade-Daneshgahi (ACECR), Karaj, Iran. The plant root was cleaned and dried in the shade under room temperature. The dried root powder (700 g) was percolated by distilled water three times for 72 h, and then the resulted extract was concentrated by rotary evaporator and dried in freeze dryer (15 g). The extract was used for further pharmacological investigation.
Isolation process of the main compounds by medium pressure liquid chromatography (MPLC)
The aqueous extract was further fractionated by hexane, ethyl acetate, and methanol solvents. The fractions obtained by washing were concentrated again using a rotary evaporator, and consequently dried in freeze dryer resulting hexane (0.8 g), ethyl acetate (1.9 g), and methanol fractions. The hexane fraction was submitted to a silica gel column on the MPLC chromatograph. The column was eluted by hexane-chloroform (5:5-8:2; flow rate: 2.5 mL/min; UV detector at 254 nm) to gain three main sub-fractions (A-C). The sub-fraction B (0.4 g) was subjected to silica gel column chromatography with a solvent system as hexane-ethyl acetate (19:1, 8:2) to give two compounds 1 and 2. The obtained compounds were then submitted to a sephadex LH20 CC and eluted with chloroform: methanol (5:5) to gain the pure compounds 1 (6 mg) and 2 (2.1 mg).
ß-Sitosterol [1]: 1H-NMR: (500 MHz, CDCl3): δH 0.68 (3H, s, H-18), 0.81 (3H, br s, H-26), 0.82 (3H, br s, H-27), 0.84 (3H, br s, H-24b), 0.92 (3H, d, J = 6.7 Hz, H-21), 1.01 (3H, s, H-19), 3.52 (1H, m, H-3), 5.35 (1H, m, H-6). 13C-NMR (125 MHz, CDCl3): δC (from C-1 to C-27) 37.3, 31.7, 71.8, 42.3, 140.8, 121.7, 31.9, 31.9, 50.2, 36.5, 21.1, 39.8, 42.3, 56.8, 24.3, 28.3, 56.1, 11.9, 19.8, 36.2, 18.8, 34.0, 26.1, 45.8, 29.2, 19.0, 19.4, 23.1 (C-24a), 12.0 (C-24b).
Prangol [2]:
1H (500 MHz, CDCl
3) and
13C- NMR (125 MHz, CDCl
3) of this compound are shown in
Table 1.
α-Amylase inhibitory activity
The α-amylase inhibition assay was performed by some modification in the method proposed by Giancarlo
et al. (
13). Fifty microliter of each plant extracts and 150 µL of starch solution as well as 10 µL of enzyme were mixed in a 96 well plate and incubated at 37 °C for 30 min. Subsequently, 20 µL of sodium hydroxide and 20 µL of color reagent were added and the closed plate placed into a 100 °C water bath. After 20 min, the reaction mixture was removed from the water bath and cooled, thereafter α-amylase activity was determined by measuring the absorbance of the mixture at 540 nm in Elisa stat fax 2100 (Awarness Technology Inc). The inhibition percentage of α-amylase was assessed by the following formula:
I α –Amylase %= 100× (ΔA control – ΔA sample) /ΔA control
ΔA control=A control test-A control blank
ΔA sample= A sample test-A sample blank
Statistical analysis was performed using the StatsDirect and Probit analysis. The results of this biological assay are summarized in
Table 2.
Isolation and incubation of islets
The islets were isolated from male adult Wistar rats (2-3 mouths; weight ~250 ± 25 g). All animal care was performed according to the animal welfare Act approved by Pharmaceutical Sciences Research Center Ethics Committee with code number of 90-04-151-16052. After they were anesthetized by injection of sodium pentobarbital (60 mg/kg), the pancreas was inflated by injecting of Krebs buffer into duodenal duct. Inflated pancreas was removed and cut into small pieces. collagenase enzyme was then added to pancreas at 37 °C for 10 min. All the tissues surrounding islets and fat were removed. Under the stereo microscope, islets of the similar size were isolated by hand picking using a sampler (
14). Various concentrations of the plant extract (1, 10, 100, 1000 and 10000 μg/mL) were dissolved in RPMI medium culture and exposed to the islets for 24 h at 37 °C with 0.5% CO
2.
Cell viability assay
Cell viability was measured by dimethylthiazol-2-y1-2,5-diphenyltetrazolium bromide (MTT) assay. After 24 h incubation with various doses of the plant extract, the medium was removed and 20 μL of MTT (0.5 mg/mL) was added and incubated for 3 h at 37 °C. The violet crystal was dissolved in dimethyl sulfoxide (DMSO) and remained for 30 min, and then the optical density was measured at 570 nm using an ELISA reader.
| Carbon | 13C-NMR | 1H-NMR |
|---|
| 2 | 161.3 | - |
| 3 | 112.8 | 6.22 (d, J= 9.5 Hz, 1H) |
| 4 | 139.2 | 8.14 (d, J= 9.5 Hz, 1H) |
| 5 | 148.5 | - |
| 6 | 114.1 | - |
| 7 | 158.0 | - |
| 8 | 94.6 | 7.08 (s, 1H) |
| 4a | 107.1 | - |
| 8a | 152.4 | - |
| 1' | - | - |
| 2' | 145.2 | 7.58 (d, J= 2.5 Hz, 1H) |
| 3' | 104.8 | 6.97 (d, J= 2.5 Hz, 1H) |
| 4' | - | - |
| 5' | - | - |
| 1" | 71.7 | 4.43 (dd, J= 9.5, 7.5 Hz, 1H)4.54 (dd, J= 9.5, 3 Hz, 1H) |
| 2" | 74.4 | 3.90 (dd, J= 7.5, 3 Hz, 1H) |
| 3" | 76.5 | - |
| 4" | 26.6 | 1.35 (s, 3H) |
| 5" | 25.1 | 1.30 (s, 3H) |
| Extract or Compounds | Conc. (mg/mL) | % AAI (Mean ± SD) | IC50 (mg/mL)* |
|---|
tenuifolia hexane extract
| 10 | 50.2 ± 1.0 | 10.4 ± 1.6 |
| 15 | 34.1 ± 1.3 |
| 20 | 10.8 ± 1.8 |
| 25 | 6.8 ± 1.9 |
| Acarbose | 10 | 67.3 ± 2.1 | 6.6 ± 2.1 |
| 15 | 69.2 ± 3.9 |
| 20 | 73.8 ± 1.9 |
| 25 | 82.1 ± 2.3 |
| β-Sitosterol | 10 | 25.5 ± 0.02 | 18.9 ± 2.1 |
| 15 | 28.7 ± 0.03 |
| 20 | 57.4 ± 0.02 |
| 25 | 59.4 ± 0.03 |
| Prangol | 10 | 6.0 ± 0.02 | > 200** |
| 15 | 6.3 ± 0.02 |
| 20 | 7.2 ± 0.01 |
| 25 | 7.4 ± 0.03 |
IC50 value is the concentration of sample required for 50% inhibition. Each value is expressed as mean ± SD (n = 3);
The IC50 value more than 200 shows almost no activity.
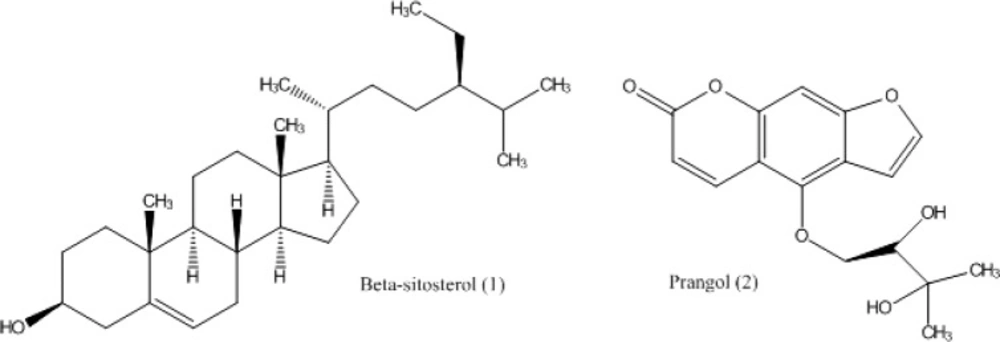
Chemical structures of the isolated compounds from A. tenuifolia.
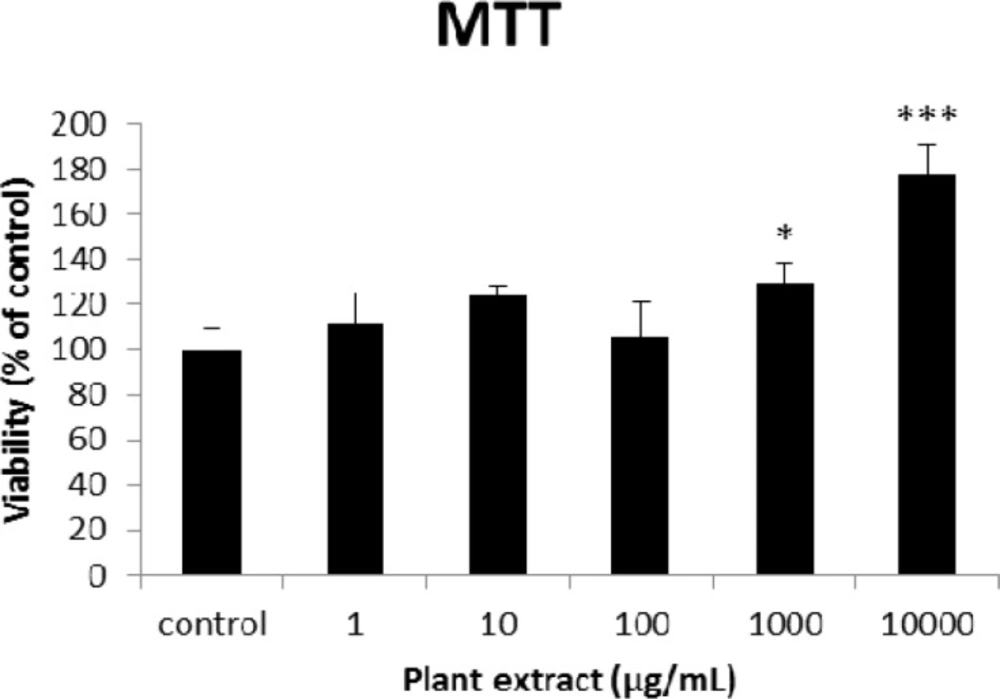
The results of MTT assay on different concentrations of the root extract of A. tenuifolia. Each group contained 10 rats’ pancreatic islets; * and *** mean significant increase of mitochondrial activity compared to the control group by p value < 0.05 and p value < 0.001; Control group contains islets that were not treated by extract
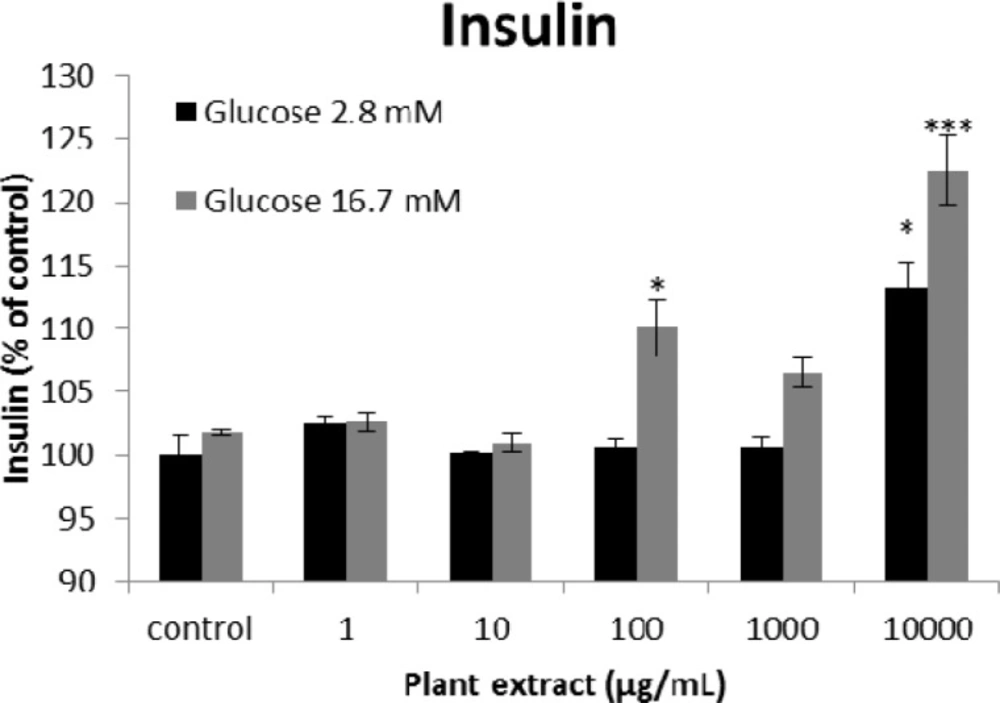
The results of insulin secretion from different groups of rats’ pancreatic islets treated with different concentrations of the root extract of A. tenuifolia. Each group contained two different sub-groups of 10 rats’ pancreatic islets that stimulated with 2.8 and 16.7 mM of glucose; * and *** mean significant increase of secretion compared to the control group by p value < 0.05 and p value < 0.001; Control group contains islets that were not treated by extract
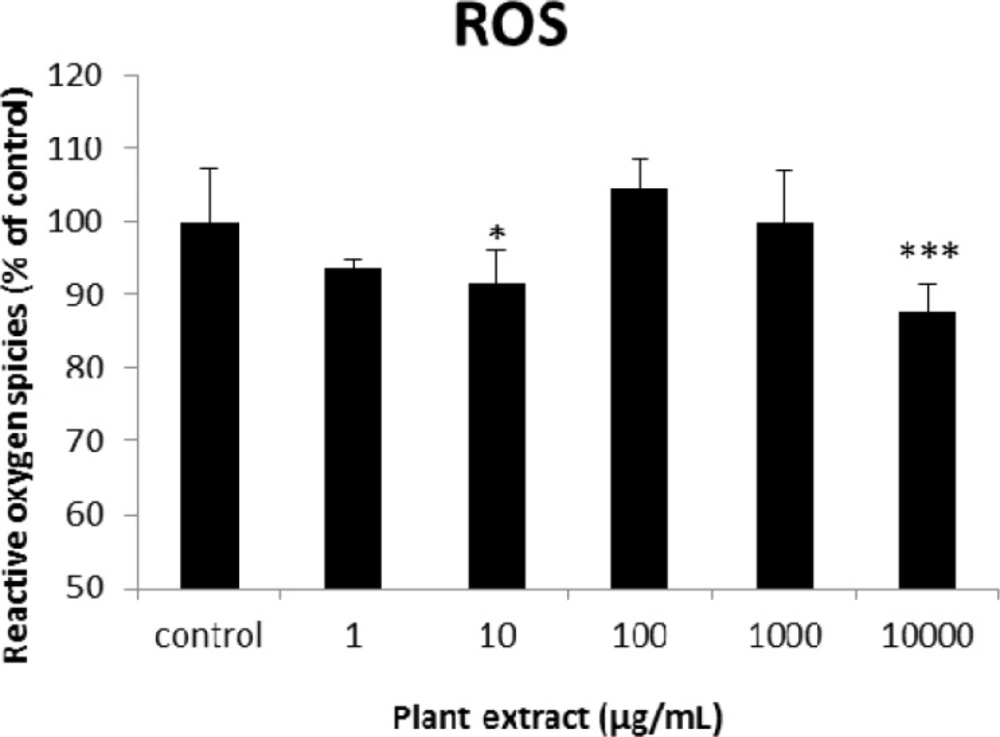
The results of cellular reactive oxygen species (ROS) measurement for groups of rats’ pancreatic islets treated with different concentrations of the root extract of A. tenuifolia. * and *** mean significant decrease of ROS generation percentage compared to the control group by p value < 0.05 and p value < 0.001; Control group contains islets that were not treated by extract
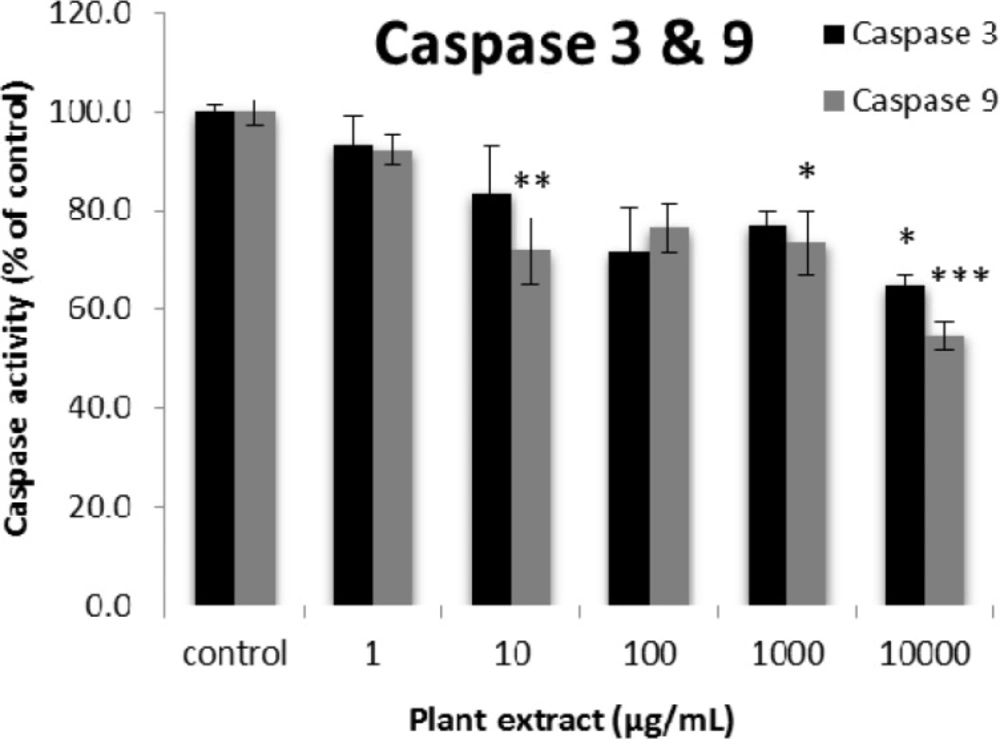
The results of caspase-3 and -9 activity percentages for groups of rats’ pancreatic islets treated with different concentrations of the root extract of A. tenuifolia. *, ** and *** mean significant decrease of caspase activity percentage compared to the control group by p value < 0.05, p value < 0.01 and p value < 0.001, respectively; Control group contains islets that were not treated by extract
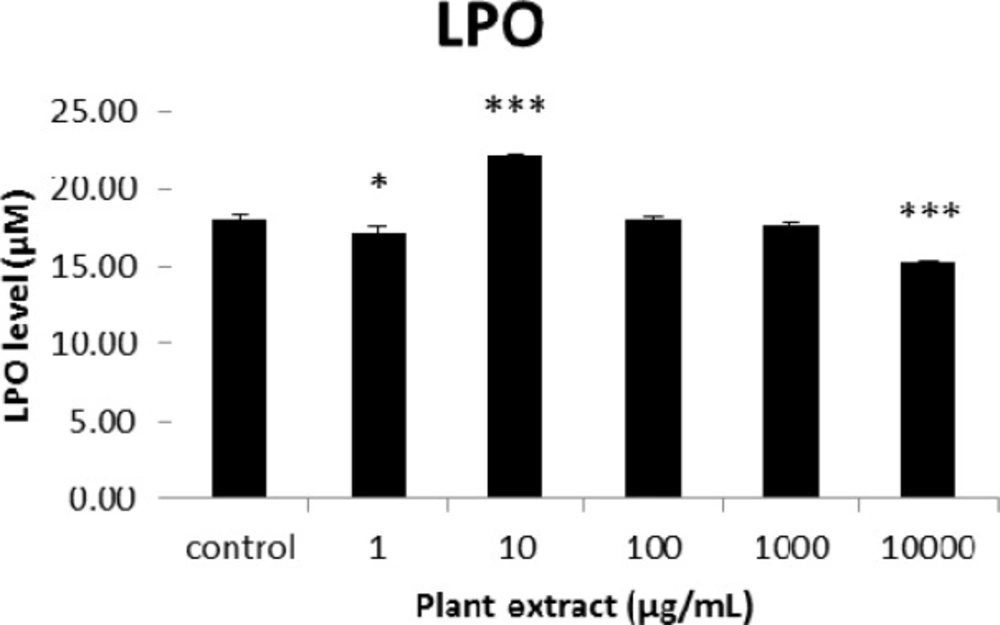
The results of cellular lipid peroxidation (LPO) measurement for groups of rats’ pancreatic islets treated with different concentrations of the root extract of A. tenuifolia. * and *** mean significant changing of LPO percentage compared to the control group by p value < 0.05 and p value < 0.001; Control group contains islets that were not treated by extract
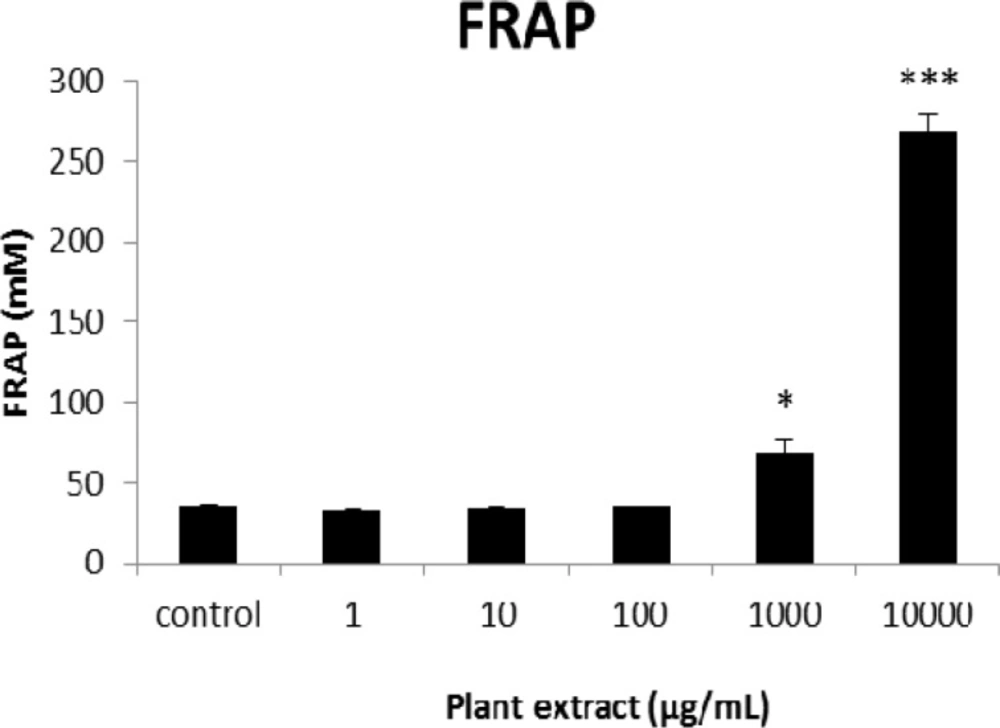
The results of FRAP assay for groups of rats’ pancreatic islets treated with different concentrations of the root extract of A. tenuifolia. * and *** mean significant increase of antioxidant capacity of cells compared to the control group by p value < 0.05 and p value < 0.001; Control group contains islets that were not treated by extract
Insulin secretion
The function of islets was assessed by insulin secretion in glucose static incubation. After exposing the islets with different concentrations of the plant extract for 24 h, the media and extract were removed from islets by washing twice with Krebs-HEPES buffer. Then, the islets were incubated with 2.8 mM glucose for 30 min. After that, islets were divided into two groups, the first were treated by 2.8 mM glucose (the basal dose) and the second by 16.7 mM glucose (stimulant dose) for 30 min at 37 °C. Islets were centrifuged and insulin assay in the supernatant was performed using rat insulin ELISA kit (
15).
Intracellular reactive oxygen species (ROS)
ROS were measured using 2ꞌ,7ꞌ-dichlorodihydrofluorescein diacetate (DCFH-DA). Islets were collected and washed three times and homogenized by extraction buffer. Afterwards, they were centrifuged and 10 μM of 2
ꞌ,7ꞌ-dichlorodihydrofluorescein (DCFH) was added to 162 μM supernatant. After 30 min incubation in 37 °C, the ELISA fluorimeter was used to measure absorbance every 1 min up to 60 min (
16).
Caspase activity analysis
Caspase-3 and -9 activities were determined by a colorimetric assay according to the manufacturerꞌs protocol. Briefly, cells were lysed in the supplied lysis buffer and were incubated 4 h with the supplied reaction buffer containing dithiothreitol and AC-DEVD-pNA (specific for caspase-3) and Ac-LEHD-pNA (specific for caspase-9) as substrates (Alexis Biochemicals Co.) at 37 °C. The reaction was measured by changes in absorbance at 405 nm using an ELISA reader. Enzyme activity was expressed as the fold increase in the proportion of apoptotic cells over that of non-treated control cells (
17).
Ferric reducing antioxidant power (FRAP) assay
The key solutions for performing FRAP assay were prepared as follows: a) Acetate buffer 300 mM, pH 3.6; b) 2,4,6-tripyridyl-striazine (TPTZ): 10 mM in 40 mM HCl; c) FeCl
3. 6H
2O:20 mM. The FRAP solution was prepared by mixing a, b and c in the ratio of 10:1:1 just before testing. The standard was FeSO
4.7H
2O: 0.1-1.5 mM in methanol. FRAP solution was mixed with 0.4 mL distilled water and certain concentration of the plant extract (80 μL) and incubated at 37 °C for 10 min. The absorbance of the reaction mixture was measured at 593 nm (
18).
Lipid peroxidation (LPO) assay
For the LPO assay, thiobarbituric acid reactive species (TBARS) were used according to the method described previously by Astaneie
et al. 2005 (
19).
All data obtained were expressed as Mean ± standard error mean (SEM) and compared using one way analysis of variance (ANOVA). The p <0.05 was considered statistically significant.