Structure of BBM
BBM: white amorphous powder. 1HNMR (500 MHz, CDCl3): δ 3.90 (m, JH, H-1), 2.25 (s, 3H, 2-Me), 6.26 (s,1H, H-5), 6.42 (d, 1H, J = 2 Hz, H-10), 6.83 (d, 1H, J = 8 Hz, H-13), 6.73 (dd, 1H, J = 8, 2Hz, H-14), 3.95 (m, 1H, H-1’), 2.60 (s, 3H, 2’-Me), 6.51 (s, 1H, H-5’), 5.98 (br, 1H, H-8’), 6.42 (dd, 1H, J = 8, 2Hz, H-10’), 6.62 (dd, 1H, J = 8, 2Hz, H-11’), 7.10 (dd, 1H, J = 8, 2Hz, H-13’), 7.30 (dd, 1H, J = 8, 2 Hz, H-14’), 3.75 (s, 3H, 6-OMe), 3.18 (s, 3H, 7-OMe), 3.58 (s, 3H, 6’-OMe); 13CNMR (CD3Cl3, 12Hz): δ 62.7 (C-1), 43.0 92-Me), 46.0 (c-3), 25.5 (C-4), 128.9 (C-4a), 105.8 (C-5), 152.c (C-6), 137.3 (C-7), 147.0 (C-8), 121.8 (C-8a), 38.1 (C-α), 134.0 (C-9), 115.9 (C-10), 144.6 (C-11), 148.2 (C-12), 115.7 (C-13), 123.9 (C-14), 64.0 (C-1’), 43.1 (2’-Me), 46.0 (C-3’), 25.5 (C-4”), 127.0 (C-4’a), 115.5 (C-5’), 150.3 (C-6’), 143.8 (C-7’), 120.3 (C-8’), 38.6 (C-α’), 132.7 (C-9’), 130.6 (C-10’), 12.1 (C-11’), 154.5 (C-12’), 121.7 (C-13’), 130.6 (C-14’), 56.2 (6-OMe), 60.9 (7-OMe), 55.9 (6’-OMe).
The
1HNMR and
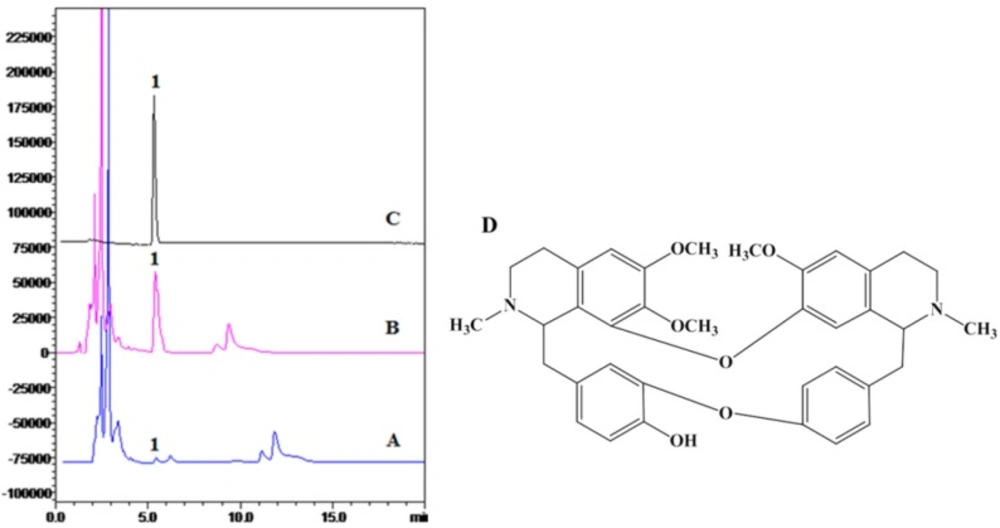
13CNMR spectra were equal to previous reports (31, 32). The HPLC analysis and structure of BBM were shown in
Figure 1.
Toxicity of BBM in zebrafish embryos
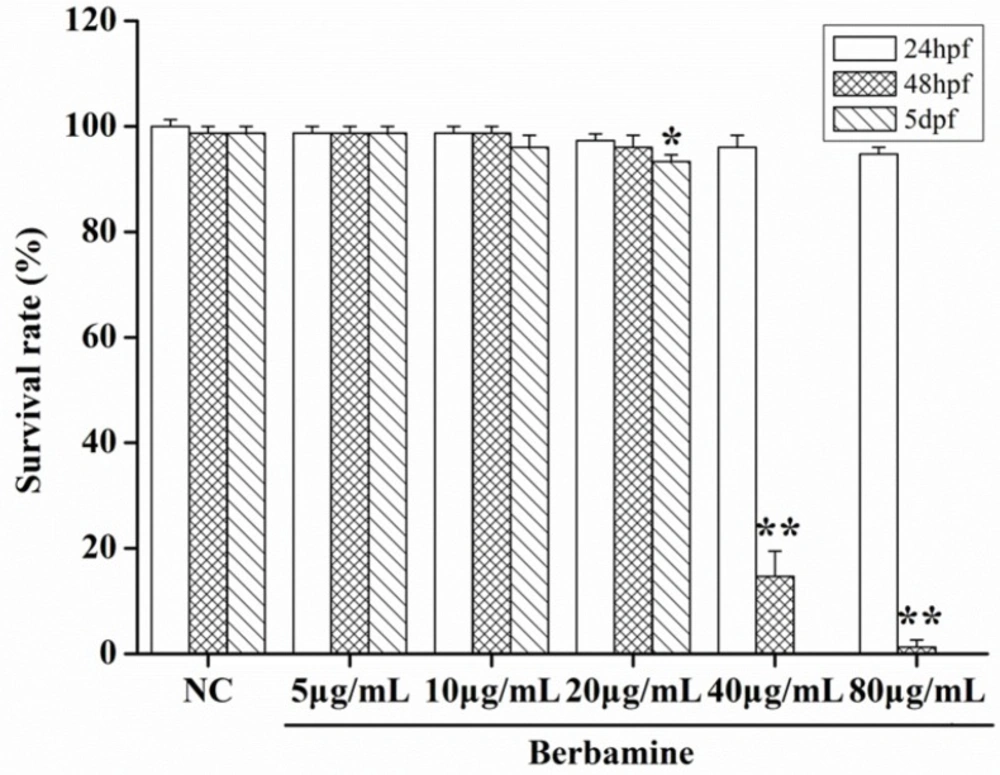
In order to determine the toxicity of BBM, we monitored the survival rate and heartbeat rate of zebrafish embryos exposed to BBM with different concentration at a certain time. As shown in
Figure 2, in the concentrations range from 5 μg/mL to 80 μg/mL, no death of embryos was observed within 24 hpf. The survival rates of embryos were hardly influenced when treated by BBM with the concentrations less than 20 μg/mL. However, when the dose of BBM exceeded 20 μg/mL, the mortality of zebrafish embryos was increased in a dose- and time-dependent manner (
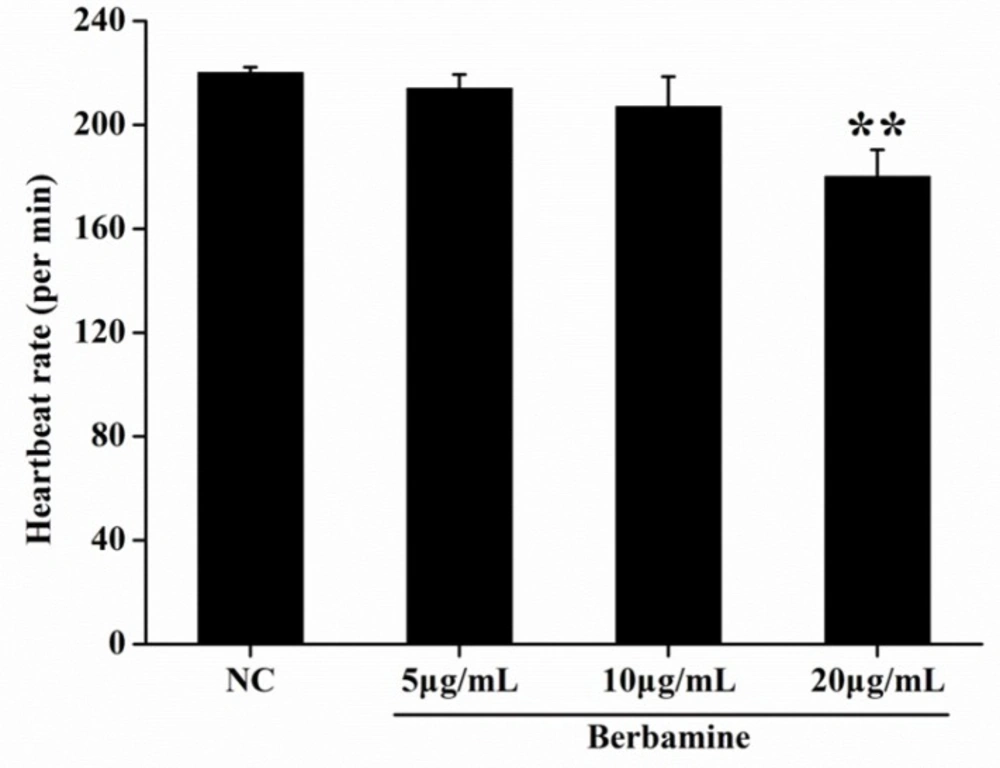
p <0.01). At 48 hpf, BBM at a dose of 40 μg/mL and 80 μg/mL showed remarkable adverse effects to zebrafish embryos including developmental malformation and, in some cases, spinal column curving. In the heartbeat test, at 5 dpf, BBM at a dose of 20 μg/mL conspicuously decreased the heartbeat rate of zebrafish embryos as compared with the NC group (
p <0.01,
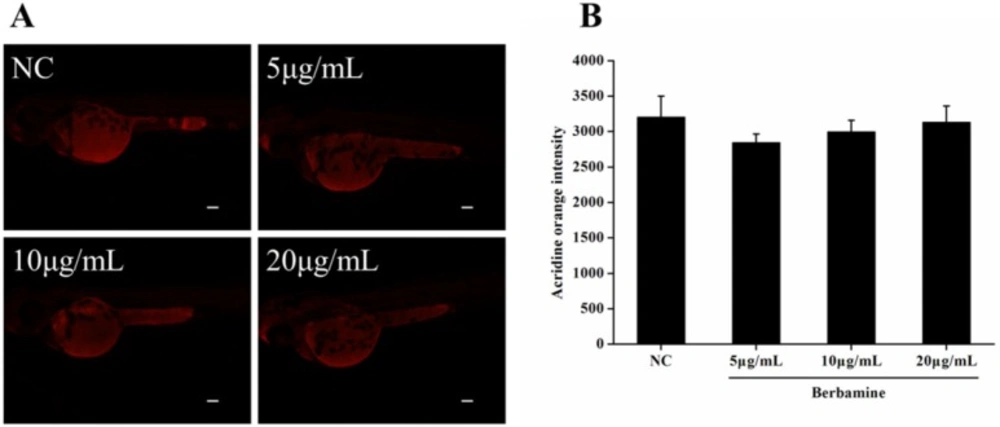
Figure 3). Acridine orange staining was conducted in the body of the zebrafish (
Figure 4A and 4B). The results indicated that there was no significant difference in fluorescence intensity of acridine orange between BBM-treated groups and NC group. These data suggested that less than 20 μg/mL of BBM was relatively safe, which could be used for the further experiments.
Vascular cholesterol accumulation in larval zebrafish
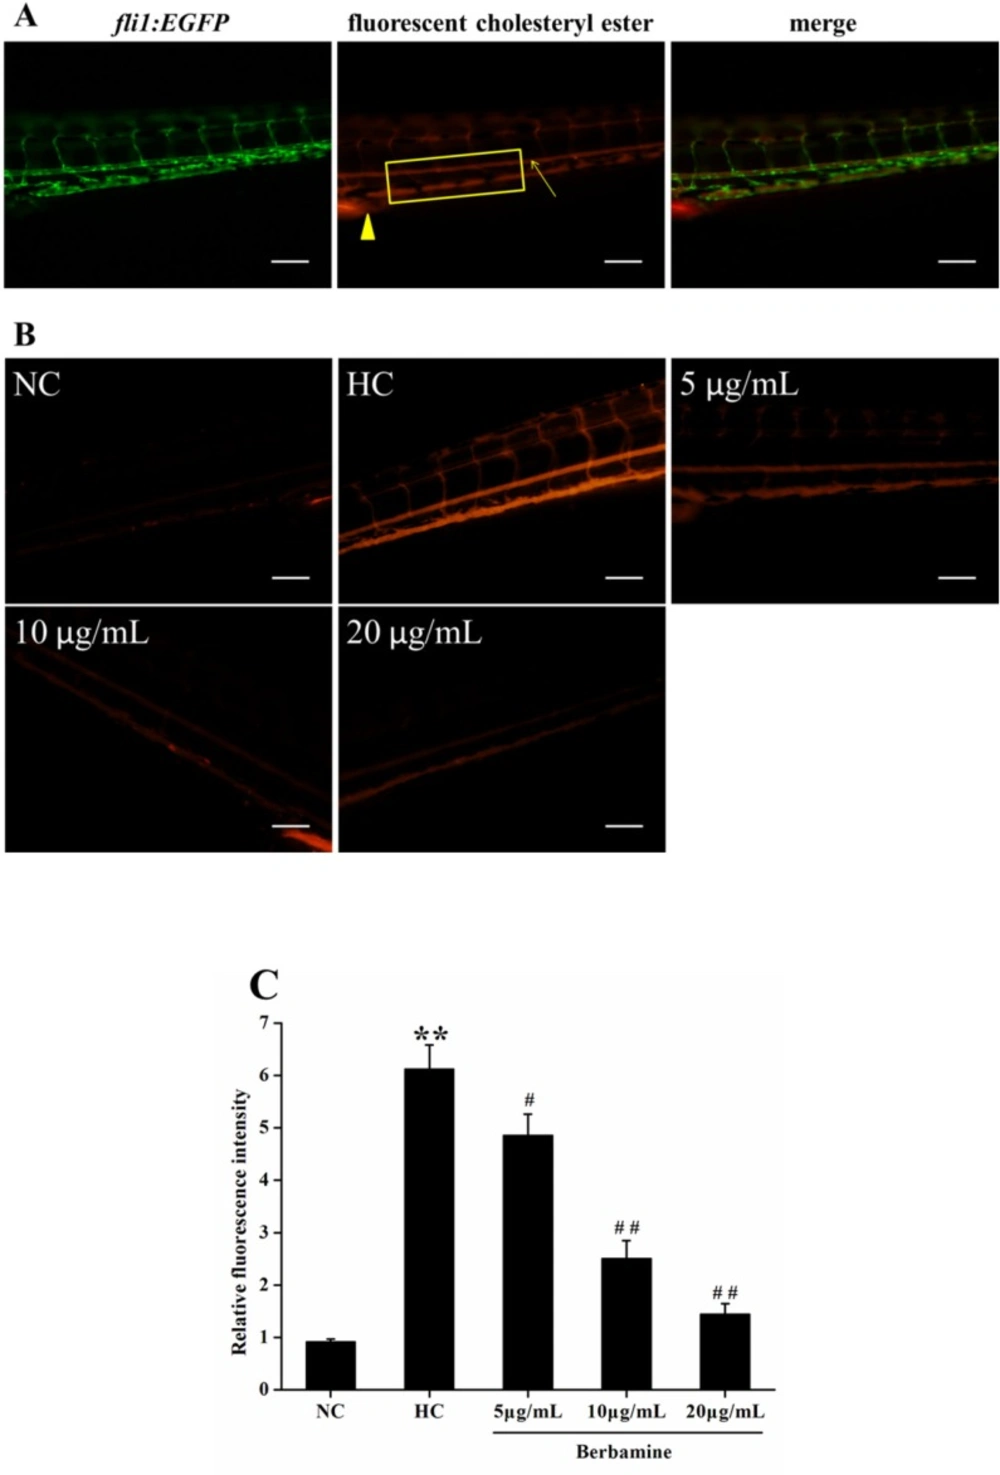
To explore the effect of BBM on vascular cholesterol accumulation in the caudal artery, live anesthetized zebrafish larvae were imaged using a fluorescence microscope. We also used
fli1:EGFP zebrafish, which constitutively expressed green fluorescent protein in vascular endothelial cell.
Figure 5A showed the fluorescent images of caudal artery (arrow). The caudal artery fluorescence intensity was significantly increased in fish fed with HC diet compared to NC group (
p <0.01), suggested HC feeding leads to a higher accumulation of cholersterol in zebrafish larvae. However, after treated with BBM for 10 days, BBM dose-dependently reduced the fluorescence intensity in the caudal artery as shown in
Figure 5B and 5C. As indicated in the histogram, 5 μg/mL and 10 μg/mL administration of BBM reduced the fluorescence intensity in the caudal artery by 21% (
p <0.05) and 59% (
p <0.01), respectively, compared with HC group. Especially, 20 μg/mL treatment of BBM made the fluorescence intensity decreased by 76% as compared to HC group (
p <0.01). It suggested that BBM could attenuate the accumulation of cholesterol in the blood of zebrafish larvae induced by HC diet.
Food intake and body weight of adult zebrafish
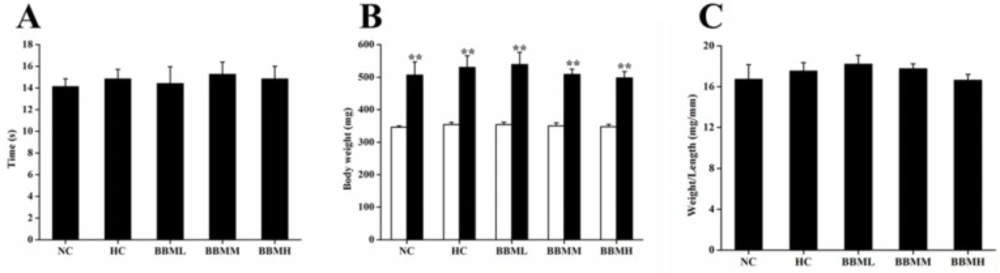
During the experimental period, all fish ate up each diet completely. And there was no remarkable difference in food intake (
Figure 6A). After 4 weeks feeding, body weight was significantly increased as compared to initial weight in each group (
p <0.01), no statistical difference among the groups was observed (
Figure 6B). The ratio of body weight to length among each group was also not significant (
Figure 6C).
Plasma and liver lipid levels in adult zebrafish
As shown in
Table 2, HC diet led to a significant increase (
p <0.01) in TC and LDL-c content in plasma compared to the zebrafish fed with control diet. After the administration of BBM, the levels of TC, TG and LDL-c in plasma were declined to different degrees. BBMM decreased the TC and LDL-c levels by 19% (
p <0.05) and 24% (
p <0.05), respectively. Among the three therapy groups, BBMH showed the highest lipids lowering activity which reduced the plasma levels of TC, TG and LDL-c by 37% (
p <0.01), 38% (
p <0.05) and 28% (
p <0.01), respectively. However, BBM had no effect on HDL-c level.
| Name | Primer Sequences (5’-3’) |
|---|
| HMGCR | R: tgcctgcttagtgcatgttc | F: ccagtcaggagtgtccaggt |
| LDLR | R: gggttgtcaaagtggatgct | F: attcacctgtaccgcctgac |
| MTP | R: ctctgtgctgccgatctttc | F: tgcagtaacatcagcccaga |
| CYP7A1a | R: gcagagtgttggcttgtgaa | F: gatcttcccagctctgatcg |
| GAPDH | R: gccatcaggtcacatacacg | F: gatacacggagcaccaggtt |
| Group | Plasma lipids profile
| Liver lipids profile |
|---|
| TC(mmol/L) | TG(mmol/L) | LDL-c(mmol/L) | HDL-c(mmol/L) | TC(ug/mga) | TG(ug/mg) |
|---|
| NC | 12.53±3.20 | 3.44±0.32 | 3.24±0.37 | 2.77±0.52 | 1.91±0.05 | 1.50±0.13 |
| HC | 35.39±0.47** | 3.79±0.54 | 5.70±0.38** | 3.61±0.62 | 3.19±0.10** | 2.07±0.20* |
| BBML | 35.06±0.78 | 3.91±0.33 | 5.76±0.49 | 3.88±0.16 | 3.11±0.11 | 2.19±0.12 |
| BBMM | 28.50±0.90# | 3.73±0.12 | 4.34±0.19# | 3.50±0.19 | 2.82±0.04# | 1.94±0.10 |
| BBMH | 22.21±2.53## | 2.36±0.21# | 4.09±0.19## | 3.53±0.55 | 2.36±0.15## | 1.57±0.14# |
ug/mg:liver cholesterol or triglyceride/liver weight.
p <0.05,
p <0.01 vs. NC group;
p <0.05,
p <0.01 vs. HC group.
HPLC analysis and structure of BBM. A: ethanol crude extract; B: chloroform extract; C: crystal compound of BBM fraction; D: structure of BBM. HPLC detection condition: Hypersil C18-ODS column (4.6 mm 200 mm, 5 μm); mobile phase, acetonitrile: 0.2% triethylamine = 82:18; flow rate, 1 mL/min; injection volume, 20 μL; wavelength of detection, 281 nm; temperature of column, 40 C
Survival rates after treatment with different concentrations of BBM in zebrafish embryos. NC: normal control; hpf: hours post-fertilization; dpf: days post-fertilization. Data were expressed as means ± SE, n = 50 in each group. * p<0.05, **p <0.01 vs. NC group
Effect of BBM on heartbeat rate at 5 dpf. The heartbeat was measured at 5 dpf, under the stereomicroscope. The number of atrial and ventricular contraction for 3 min was counted, and the results were represented as the average heartbeat rate (per min). NC: normal control. Data were shown as means ± SE, n = 10 in each group. **p <0.01 vs. NC group
Effect of BBM on cell death in zebrafish embryos. A: fluorescent images after acridine orange staining. B: acridine orange intensity of the larvae. NC: normal control. Data were expressed as means ± SE, n = 10 in each group. Scale bars: 100 μm
Effect of BBM on vascular cholesterol accumulation in zebrafish larvae. A: fluorescent images of fli1:EGFP zebrafish larvae. Arrow: caudal artery; triangle: cloaca. Fluorescence intensity was measured from the cloaca (outlined by rectangle). B: fluorescent images of the caudal artery from tested groups. Lateral views, dorsal is up. C: relative fluorescence intensity of the caudal artery. NC: normal control; HC: high-cholesterol. Values were means ± SE, n = 10 in each group. **p <0.01 vs. NC group; #p <0.05, ##p <0.01 vs. HC group. Scale bars: 100 μm
Effects of BBM on food intake and body weight in adult zebrafish. A: the duration of food intake between groups. B: white and black bars showed initial and final body weights, respectively. C: the ratio of body weight to length. NC: normal control; HC: high-cholesterol; BBML: berbamine at low dosage (0.05% w/w); BBMM: berbamine at medium dosage (0.1% w/w); BBMH: berbamine at high dosage (0.2% w/w). Values were means ± SE, n = 20 in each group, **p <0.01 vs. initial weight
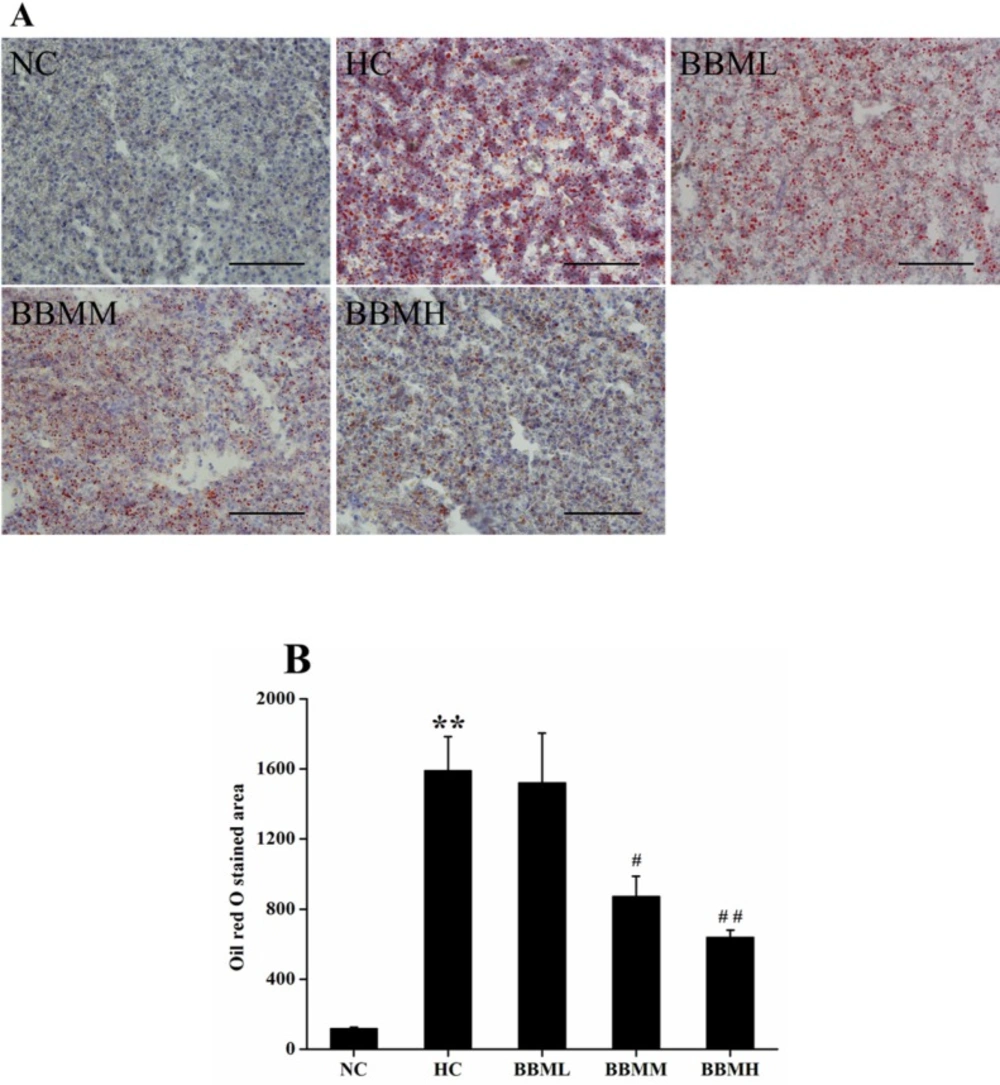
Histological analysis of hepatic tissue in zebrafish. A: images of Oil red O staining in liver. B: Oil red O staind area in the tested groups. NC: normal control; HC: high-cholesterol; BBML: berbamine at low dosage (0.05% w/w); BBMM: berbamine at medium dosage (0.1% w/w); BBMH: berbamine at high dosage (0.2% w/w). Data were shown as means ± SE, n = 10 in each group. **p <0.01 vs. NC group; #p <0.05, ##p <0.01 vs. HC group. Scale bars: 100 μm
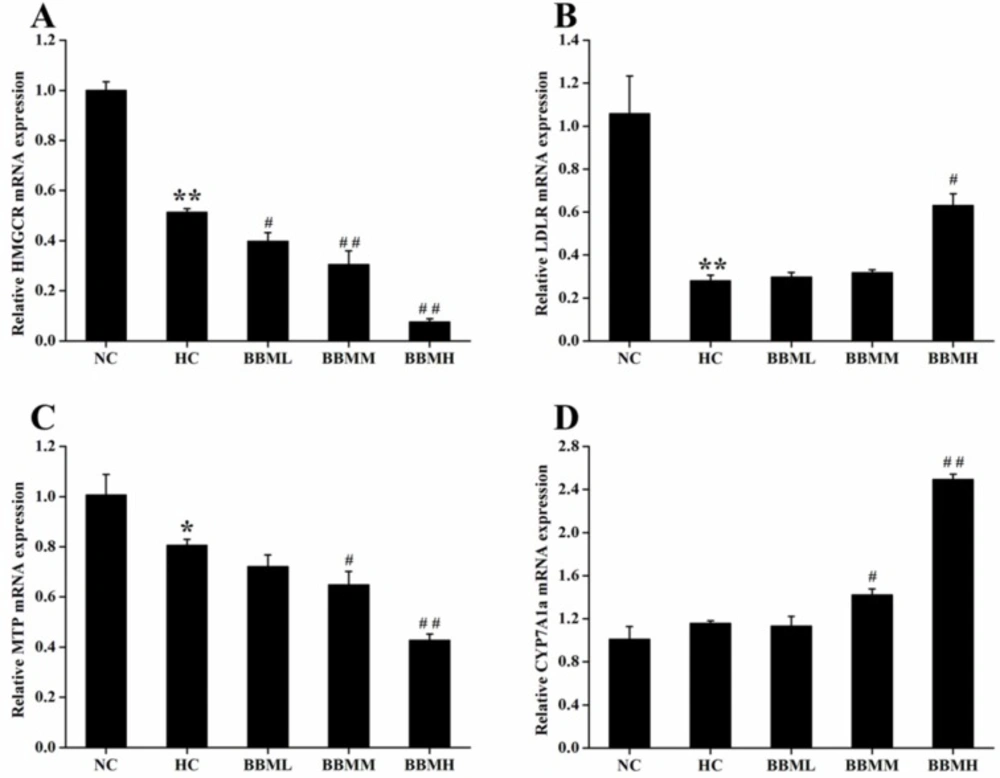
Effects of BBM on expression of genes involved in cholesterol metabolism in liver. A: HMGCR; B: LDLR; C: MTP; D: CYP7A1a. NC: normal control; HC: high-cholesterol; BBML: berbamine at low dosage (0.05% w/w); BBMM: berbamine at medium dosage (0.1% w/w); BBMH: berbamine at high dosage (0.2% w/w). Values were means ± SE, *p <0.05, **p <0.01 vs. NC group; #p <0.05, ##p <0.01 vs. HC group
In liver, the levels of TC and TG in HC group were significantly higher than those in NC group (p <0.01 or p <0.05). Compared to the HC group, BBM treatment dose-dependently reduced the TC and TG levels in hypercholesterolemic zebrafish. BBMM reduced the TC level in liver by 12% (p <0.05) and the high dosage of BBM decreased the TC and TG levels by 26% (p <0.01) and 24% (p <0.05), respectively. These data indicated the beneficial effects of BBM on plasma and liver lipid profiles in hypercholesterolemic zebrafish.
Histological analysis
In an effort to analyze the physiological impact of BBM on the fat accumulation in zebrafish liver, the liver sections were obtained from different groups followed by Oil red O staining (
Figure 7A). For quantitative analysis of the lipid content, the Oil red O stained area was measured by Nikon Elements-DR software (
Figure 7B). As shown in
Figure 7, histological analysis of hepatic tissue indicated that the zebrafish fed with control diet exhibit normal and non-pathological histochemical features, while the fish fed with HC diet demonstrate obviously lipid droplets and abnormal morphology. However, BBM-treated groups showed a reduced Oil red O stained area to a different degree. After 4 weeks treatment, the lipid content in BBMM and BBMH group was decreased by about 45% (
p <0.05) and 60% (
p <0.01), respectively, suggested a reduction in hepatic fat storage.
Expression of mRNA in liver of adult zebrafish
To determine the potential molecular mechanism by which BBM exerted its anti-hypercholesterolemic effect, the mRNA expression levels of genes associated with cholesterol metabolism in liver were investigated by quantitative real-time PCR.
As shown in
Figure 8A, HC diet induced significant decrease in HMGCR mRNA expression (
p <0.01). In comparison with the HC group, BBM treatment dose-dependently suppressed the HMGCR mRNA expression. All of the three groups inhibited the expression of HMGCR mRNA by 23% (
p<0.05), 41% (
p <0.01) and 85% (
p <0.01), respectively.
LDLR is a cell receptor and involves in the endocytosis of cholesterol. The histogram showed a 0.73-fold decrease (
p <0.01) of LDLR mRNA in the zebrafish fed with HC diet, possibly due to the high level of cholesterol in the plasma (
Figure 8B). However, BBM increased the mRNA level of LDLR, which was monotonously raised along with the increase of BBM dose. And BBMH made LDLR mRNA expression up-regulated by 1.25-fold (
p <0.05), as compared to the HC group.
MTP encodes an enzyme required for the assembly and secretion of lipoproteins. Results from
Figure 8C indicated that the expression of MTP mRNA in HC group was inhibited by 20% (
p <0.05) compared with the NC group and further reduced in BBM treated groups. Among the tested groups, BBMM and BBMH remarkably down-regulated the MTP mRNA level by 20% (
p <0.05) and 47% (
p <0.01), respectively, compared with HC group, which showed a dose-dependent relationship.
CYP7A1a is a key enzyme involves in the conversion of cholesterol to bile acids in liver of zebrafish. After BBM treatment, the expression of CYP7A1a mRNA was increased to different degrees as shown in
Figure 8D. As it indicated in the results, BBMM significantly improved the CYP7A1a mRNA expression by 23% (
p <0.05). Especially, BBMH caused the expression of CYP7A1a mRNA increased by 1.15 times (
p <0.01) compared with HC group and exhibited a beneficial activity to accelerate the excretion of bile acids.