Introduction
Acyclovir (ACV, Scheme 1) is a synthetic acyclic purine nucleoside analog derived from guanine. It is one of the most effective antiviral drugs against herpes simplex virus types 1 and 2, varicella-zoster virus, epstein-barr virus, cytomegalovirus, and human herpes virus 6 (1, 2). Many adverse reactions would occur if ACV were abused, such as neurotoxicity, urticaria, phlebophlogosis, diarrhea, cephalalgia, emesia and swoon. In some cases, renal failure patients can aggravate their condition (3–6). The situation of irrational drug use still exist as well as the urgency of pharmacokinetics study, so it is necessary to monitor the concentration of ACV in blood serum and urine after oral administration.
Several analytical methods including radioimmunoassay (RIA) (7), spectrophotometric methods (8), thin layer chromatography (TLC) (9), high-performance capillary electrophoresis (HPCE) (10), micellar electro kinetic chromatography (11), high performance liquid chromatography (HPLC) with different detectors (12-13), and flow injection-chemiluminescence (14) have been reported for ACV analysis.
Because of the electrochemical behavior of ACV, the electrochemical techniques have received a significant interest in the determination of ACV over other methods due to its simplicity, selectivity, and high sensitivity. However, the voltammetric response of ACV is not satisfactory at the bare electrodes for analytical application because of slow heterogeneous electron transfer, and the direct electrochemical oxidation of ACV takes place at high overpotential. Therefore, a chemically modified electrode (CME) (15-21) is an excellent approach to indication reduce the overpotential and increase the sensitivity problem by introducing a modifier.
The huge success of CMEs arises most often from the remarkable and sometimes unique properties of the modifiers. Carbon electrodes are widely used in electroanalysis due to their low background current, wide potential window, chemical inertness, low cost, and suitability for various sensing and detection applications. Among carbon electrodes, carbon paste electrode (CPE) has a particular importance. The ease and speed of preparation and of obtaining a new reproducible surface, very low background current (compared to graphite electrode), low cost, feasibility to incorporate different substances during the paste preparation, and porous surface are some advantages of CPEs over all other carbon electrodes (22). Therefore, over the past years, CPEs containing various modifier have been prepared and applied in determination of different analytes.
Nowadays, due to the unique properties of carbon nanotubes (CNTs) such as high thermal conductivity, high mechanical strength, high electrical conductivity, and high surface area and large ratio of surface area to volume, they have been widely used for the development of chemically modified electrodes (23-25). The modification of electrode substrates with multi-walled carbon nanotubes (MWCNTs) for use in analytical sensing have been documented to result in low detection limits, high sensitivities, reduction of over potentials and resistance to surface fouling (26-29). In comparison to the conventional CPEs, the carbon nanotube paste electrodes have shown a considerable enhancement in electrochemical signals leading to improvement of the detection limit in the voltammetric measurements.
Besides CNTs, nanosized metal particle modified electrodes have emerged as a promising alternative for the electroanalysis of organic and inorganic compounds. Metal nanoparticles modified electrodes may serve as a random array of microelectrodes (30). Metal nanoparticles have some distinct advantages such as higher mass transport, lower influence of the solution resistance, low detection limit, and better signal-to noise ratio over the conventional macro electrodes (31). Metals in the nanometer range provide three important functions for electroanalysis: the roughening of the conductive sensing interface, catalytic properties, and conductivity properties (32). Electrochemical studies have revealed that metal nanoparticles enhance electrode conductivity and surface area, facilitate the electron transfer, effective electroactive surface area and improve the detection limit of analyte (33). These properties make it as a candidate for sensor application.
Zinc oxide (ZnO) semiconductor, as a wide band gap (~3.37 eV) metal nanoparticles, has been established as a new class in the nanomaterials science owing to its high exciton binding energy, biocompatibility, good electrochemical activitiy, non-toxicity, high chemical/photochemical stability and high-electron communication (34, 35). The surface properties of ZnO nanomaterials such as surface-to-volume ratio, porosity, etc. could be easily tailored by controlling the morphology and size of ZnO nanocrystals (36). Nano-structured ZnO-based highly sensitive platform has been applied as electron mediator for the fabrication of electrochemical sensors to detect the hazardous chemicals at low level (37).
In recent years polymer modified electrodes have obtained important attention among the researchers for sensor and biosensor applications because polymeric films have good stability and reproducibility. Electropolymerization is a good method to prepare polymer modified electrodes as adjusting electrochemical parameters can control film thickness, permeation and charge transport characteristics.
In this work, we have combined the advantageous features of polymer modification, metal nanoparticles, CNTs and carbon paste technology with the aim of the electrocatalytic oxidation of ACV by the use of poly(o-aminophenol) (POAP) as a polymer, but with some changes in the carbon paste preparation. The performance of the developed electrode was studied by cyclic voltammetry, and close surface examination was made by scanning electron microscopy (SEM).
Experimental
Apparatus
Electrochemical measurements were performed on an AUTOLAB modular electrochemical system (ECO Chemie, Utrecht, the Netherlands) equipped with a PGSTAT 12 module and driven by GPES software (Version 4.9) in conjunction with a conventional three-electrode system and a personal computer for data storage and processing. A bare or modified carbon paste electrode (CPE) as the working electrode, an Ag/AgCl electrode as the reference electrode and a platinum wire as the auxiliary electrode, were employed in the measurements. The scanning electron micrograph (SEM) images were obtained with a KYKY (EM 3200).
Reagents
Chemicals and reagents
Pure ACV was a gift from Bakhtar Bioshimi Co. (Kermanshah, Iran). The multi-walled carbon nanotubes (MWCNTs) (> 95% purity, 10–20 nm diameter, 5–15 nm length) were obtained from Neutrino (Tehran, Iran). ZnO nanoparticles (ZnO NPs) were synthesized using solid-vapour thermal sublimation techniques (38). All other chemicals were of analytical grade and used directly. Stock solutions of ACV (2 mM) were freshly prepared daily in aqueous solution and kept in dark at 4 °C before measurements to avoid any decomposition. Double distilled water was used throughout preparation of solutions.
Preparation of modified electrode
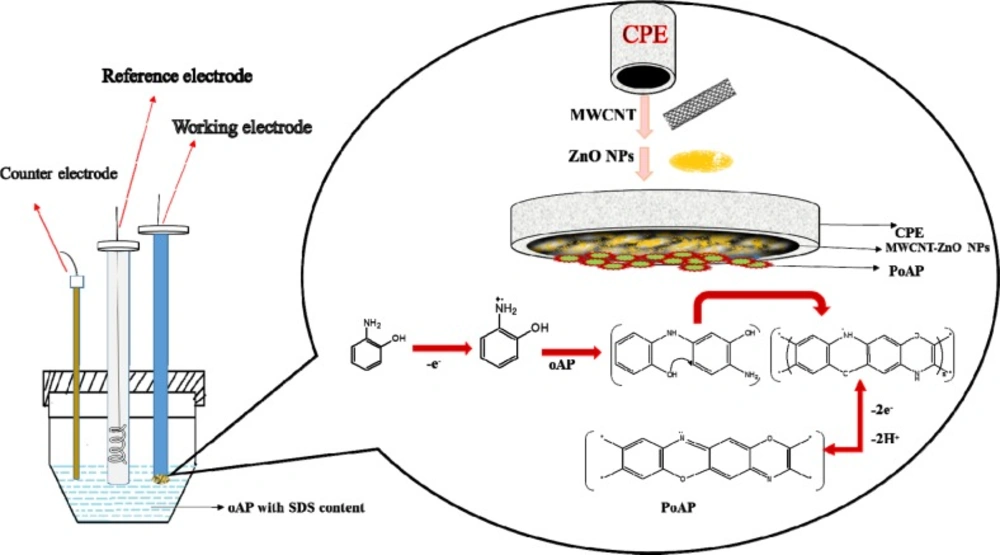
The schematic illustration for constructing the modified is shown in Scheme 2.
Firstly the MWCNTs-ZnO NPs-CPE was prepared by hand mixing 55% graphite powder, 5% ZnO NPs, 10% MWCNTs and 30% paraffin oil in an agate mortar to get homogeneous carbon paste. Then, paste was packed into the end of a plastic syringe (2 mm in diameter). A copper wire inserted into the carbon paste provided an electrical contact. Before each measurement, pushing an excess of paste out of the tube and then polishing the freshly exposed paste with weighing paper obtained a new surface.
The polymer film-modified MWCNTs-ZnO NPs-CPE was fabricated by cyclic voltammetry in the potential range -0.2 to 0.8 V at a sweep rate of 100 mV s-1 in 0.5 M aqueous HClO4 solution containing 5 mM o-aminophenol (OAP) in the presence of 5 mM sodium dodecyl sulfate (SDS) for 25 cycles (39). The obtained modified electrode (P-OAP/MWCNTs-ZnO NPs-CPE) was washed with doubly distilled water to remove the physically adsorbed material. Stepwise electrodes were also prepared with the same procedures described above, for comparison purposes.
Results and Discussion
Characterization of ZnO NPs
Nanoscale ZnO NPs was characterized by means of SEM and TEM. Figure 1A shows a typical image of the nanoscale ZnO NPs synthesized via thermal sublimation vapor–solid phase method. It can be observed that it appears to have a rod-like shape with spherical end and with average diameter of 20 nm and length in the range of 10–30 nm, and weak agglomeration can be seen. Figure 1B displays TEM image of nanoscale ZnO NPs. The result shows the nanoparticles are in the same sizes as it is shown in the SEM image.
The surface morphologies of prepared CPEs
SEM technique was utilized to characterize the surface morphologies of the fabricated sensors. The unmodified CPE is characterized by a surface formed by irregularly shaped flakes of graphite that were isolated and a closer look of the film reveals a broken surface (Figure 2A). SEM images of the separate and consolidated modifiers were also shown (Figures 2B-G). The modification of the CPE with P-OAP, MWCNTs and ZnO NPs is clear. The whole assembly on electrode surface (P-OAP/MWCNTs-ZnO NPs) is shown in Figure 2H. From Figure 2H, it was evident that significant improvement in the surface structure was observed.
Table 1
Comparison of the characteristics of the proposed method with those of previously reported electrochemical methods
| Electrode | LDR | LOD | Ref. |
|---|---|---|---|
| Carbon nanotube/GCE | 0.02-2.25 | 0.007 | (15) |
| Self-assembled monolayer/Au | 0.04-0.45 | 0.016 | (16) |
| fullerene-C60-modified GCE | 0.02-1.35 | 0.003 | (17) |
| Copper nanoparticles/CPE | 6.08-117.33 | 0.594 | (19) |
| PVP/CPE | 0.002-0.1 | 0.0007 | (20) |
| OPPY/CNT/GCE | 0.007-2.25 | 0.002 | (21) |
| P-OAP/MWCNTs-ZnO NPs-CPE | 0.089-7.96 | 0.067 | This work |
Table 2
Determination of ACV in real samples (n = 3).
| Sample | Added | Expected | Found | Recovery (%) |
|---|---|---|---|---|
| Tablet | - | 0.45 | 0.42 | 93.33 |
| 0.89 | 1.34 | 1.39 | 103.7 | |
| 1.34 | 1.79 | 1.8 | 100.5 | |
| 1.79 | 2.24 | 2.21 | 98.66 |
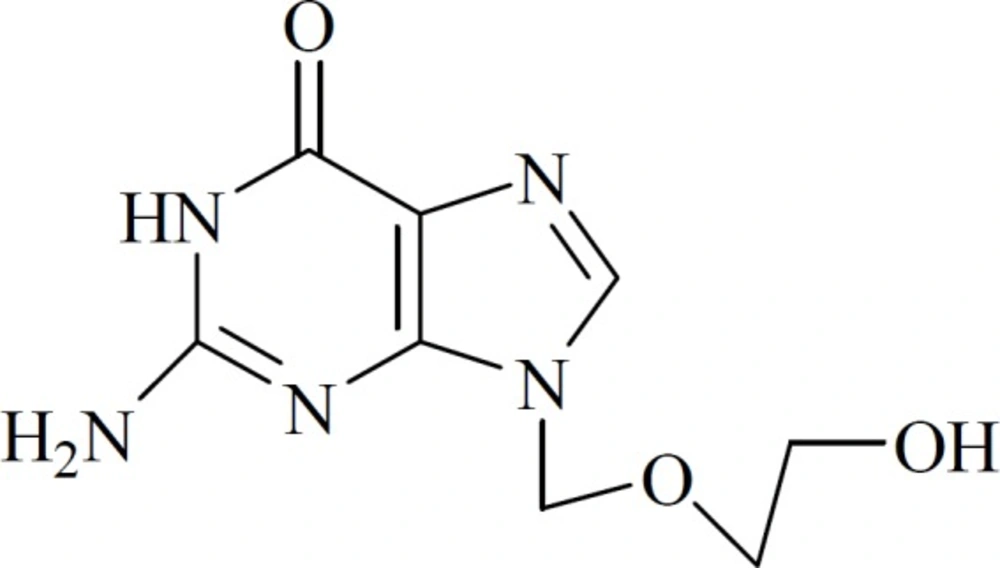
Scheme 1
Chemical structure of Acyclovir
Scheme 2
Schematic illustration of the preparation steps of P-OAP/MWCNTs-ZnO NPs-CPE
Scheme 3
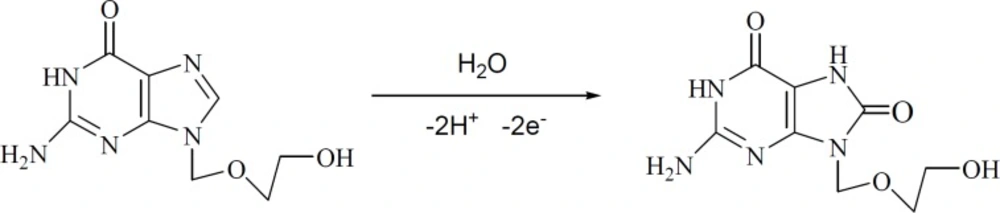
Electrochemical oxidation mechanism of ACV
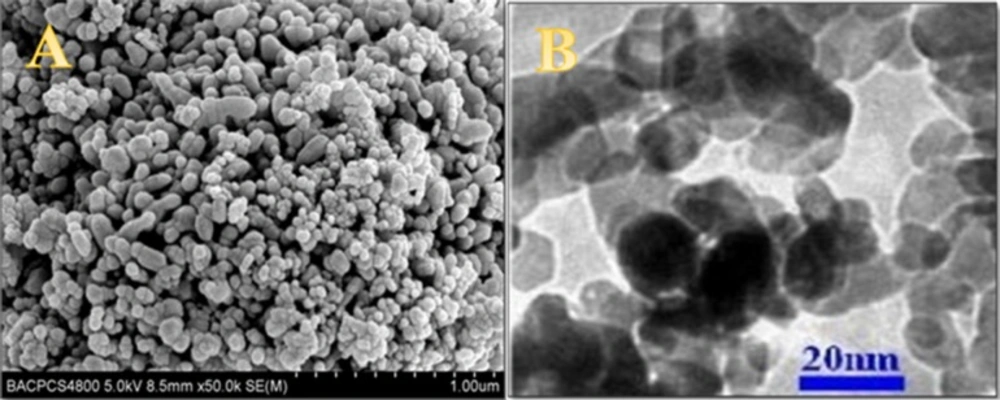
Figure 1
A) SEM and (B) TEM images of ZnO NPs
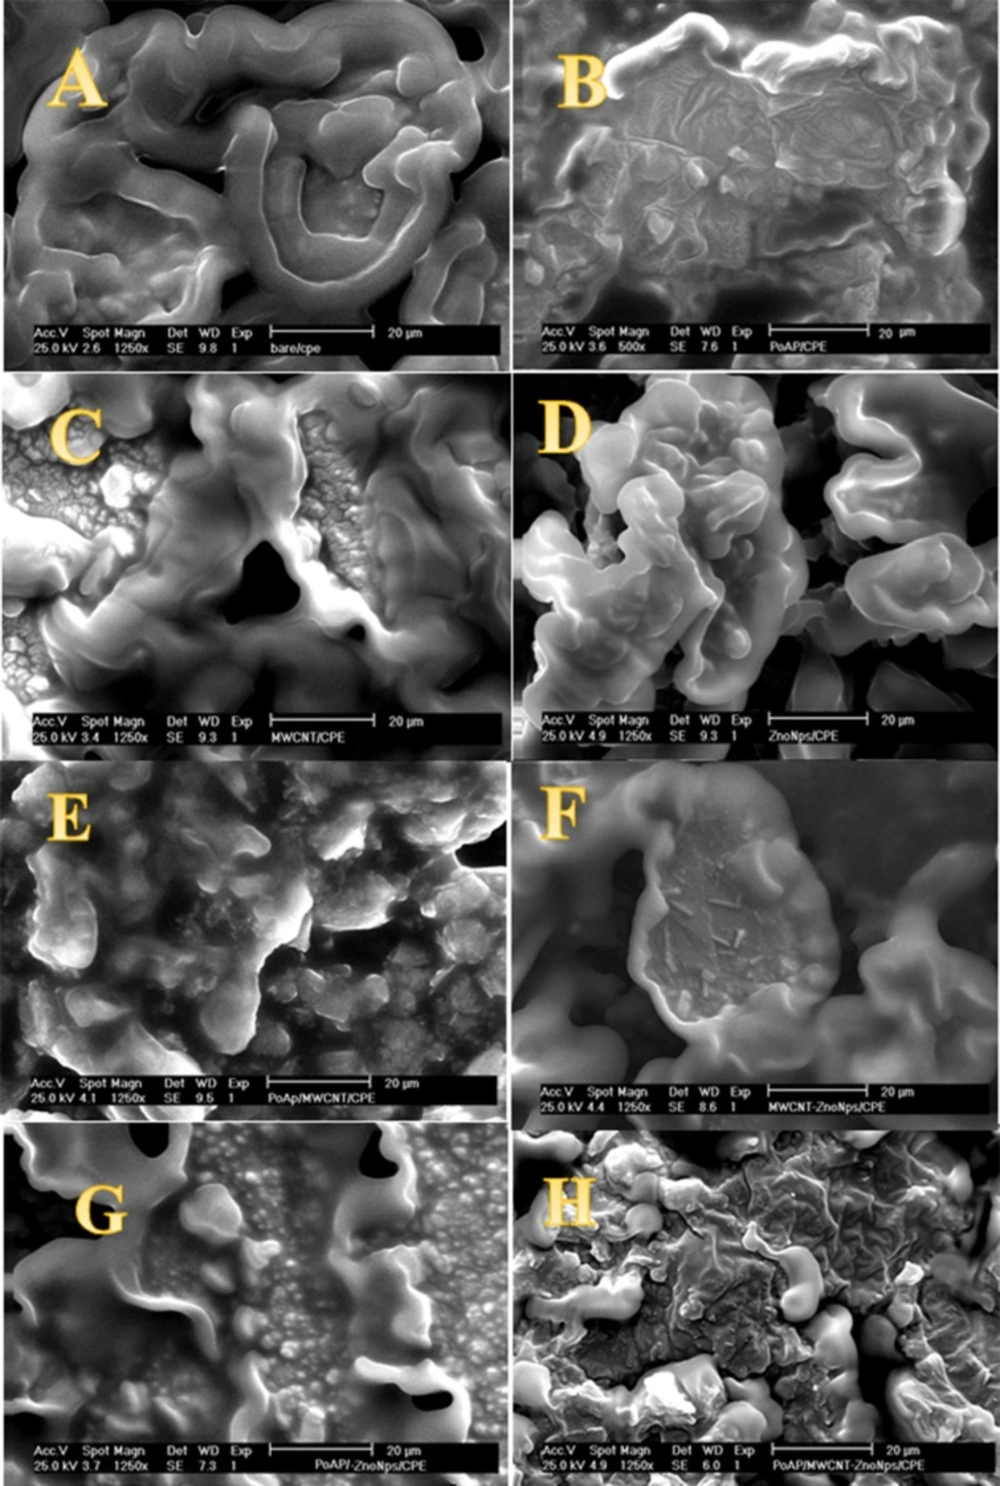
Figure 2
A) SEM images of bare CPE, (B) P-OAP/CPE, (C) MWCNTs-CPE, (D) ZnO NPs-CPE, (E) P-OAP/MWCNTs-CPE, (F) MWCNTs-ZnO NPs-CPE, (G) P-OAP/ZnO NPs-CPE, and (H) P-OAP/MWCNTs-ZnO NPs-CPE
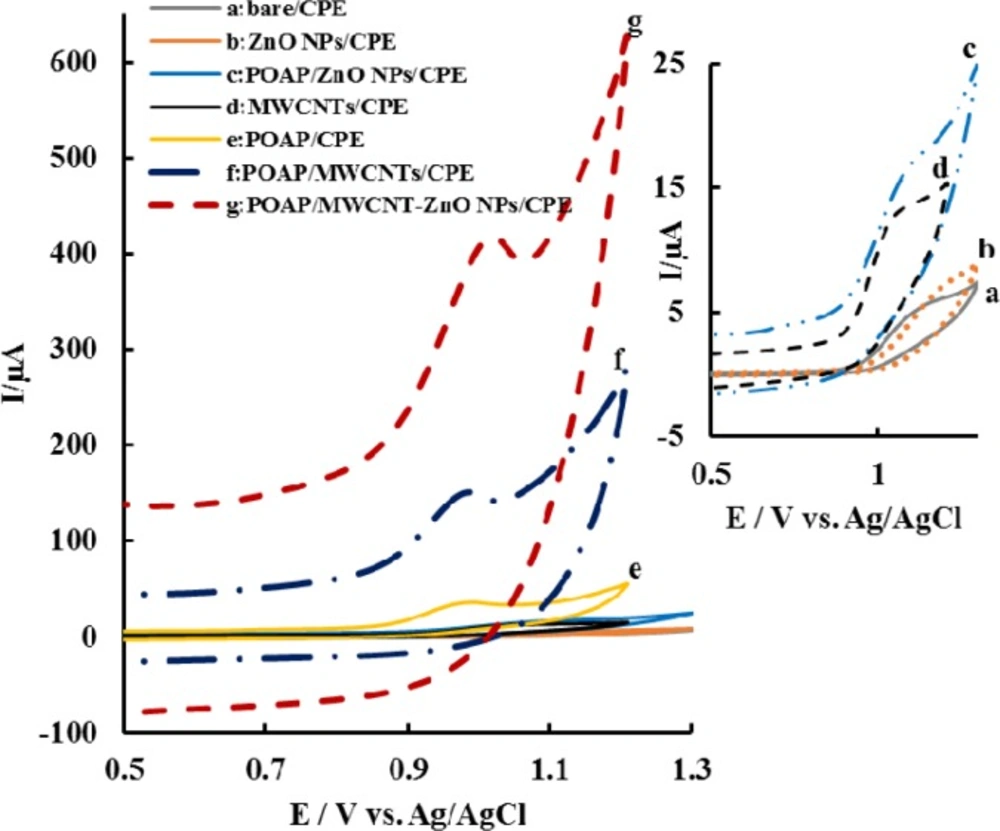
Figure 3
a) CVs of bare CPE, (b) ZnO NPs-CPE, (c) P-OAP/ZnO NPs-CPE, (d) MWCNTs-CPE, (e) P-OAP/CPE, (f) P-OAP/MWCNTs-CPE and (g) P-OAP/MWCNTs-ZnO NPs-CPE in 0.1 M PBS (pH 7.0) containing 11 µg mL-1 ACV at the scan rate of 100 mV s-1
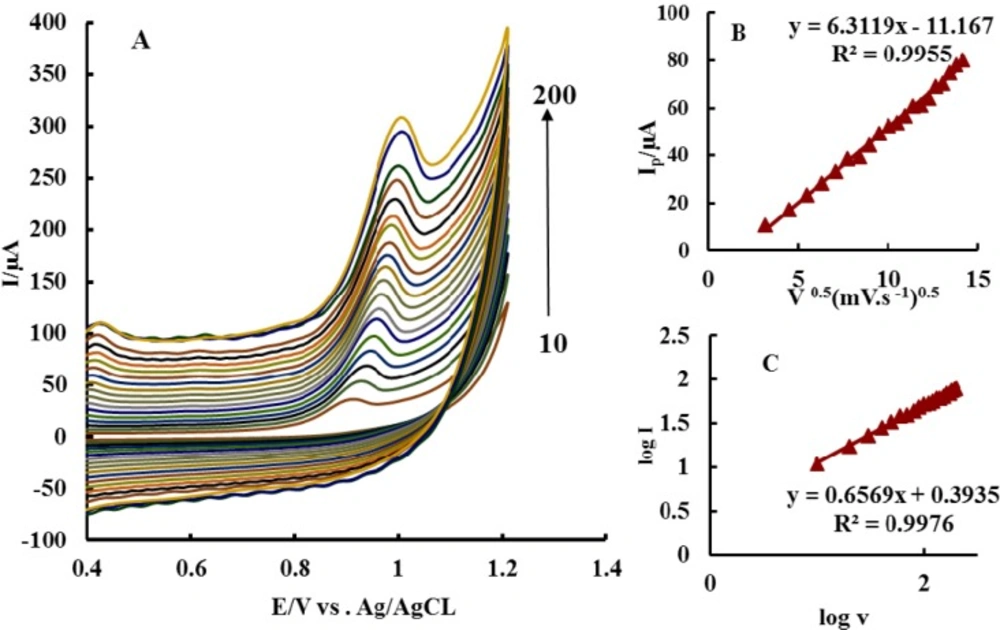
Figure 4.
A) CVs of P-OAP/MWCNTs-ZnO NPs-CPE in 0.1 M PBS (pH 7.0) with 6.6 µg mL-1 ACV at scan rate of 10 to 200 mV s-1, (B) Linear relationships of Ivs.v1/2, (C) Log Ivs. log
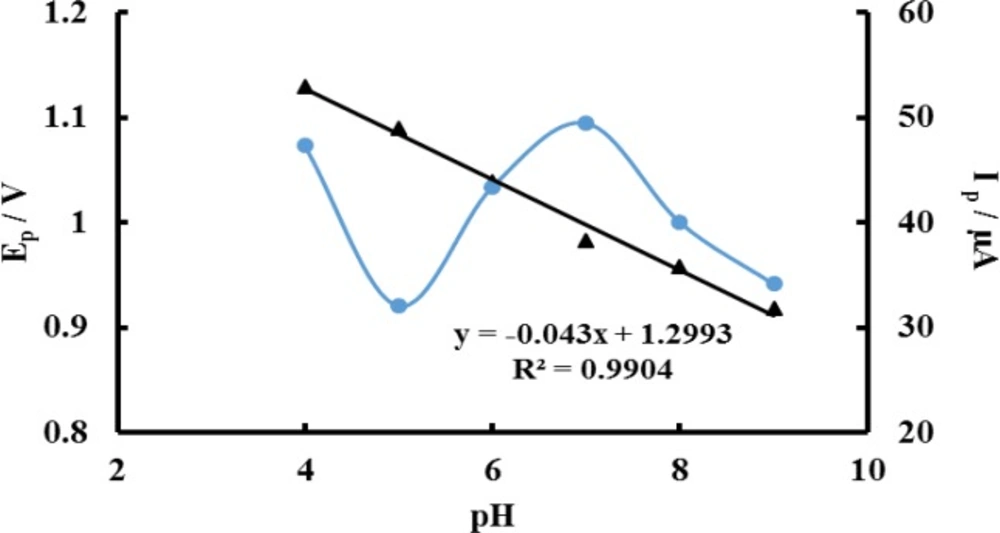
Figure 5
Plots of peak potential ( ▲ ) and peak current ( ● ) against solution pH from cyclic voltammetric study of ACV at P-OAP/MWCNTs-ZnO NPs/CPE
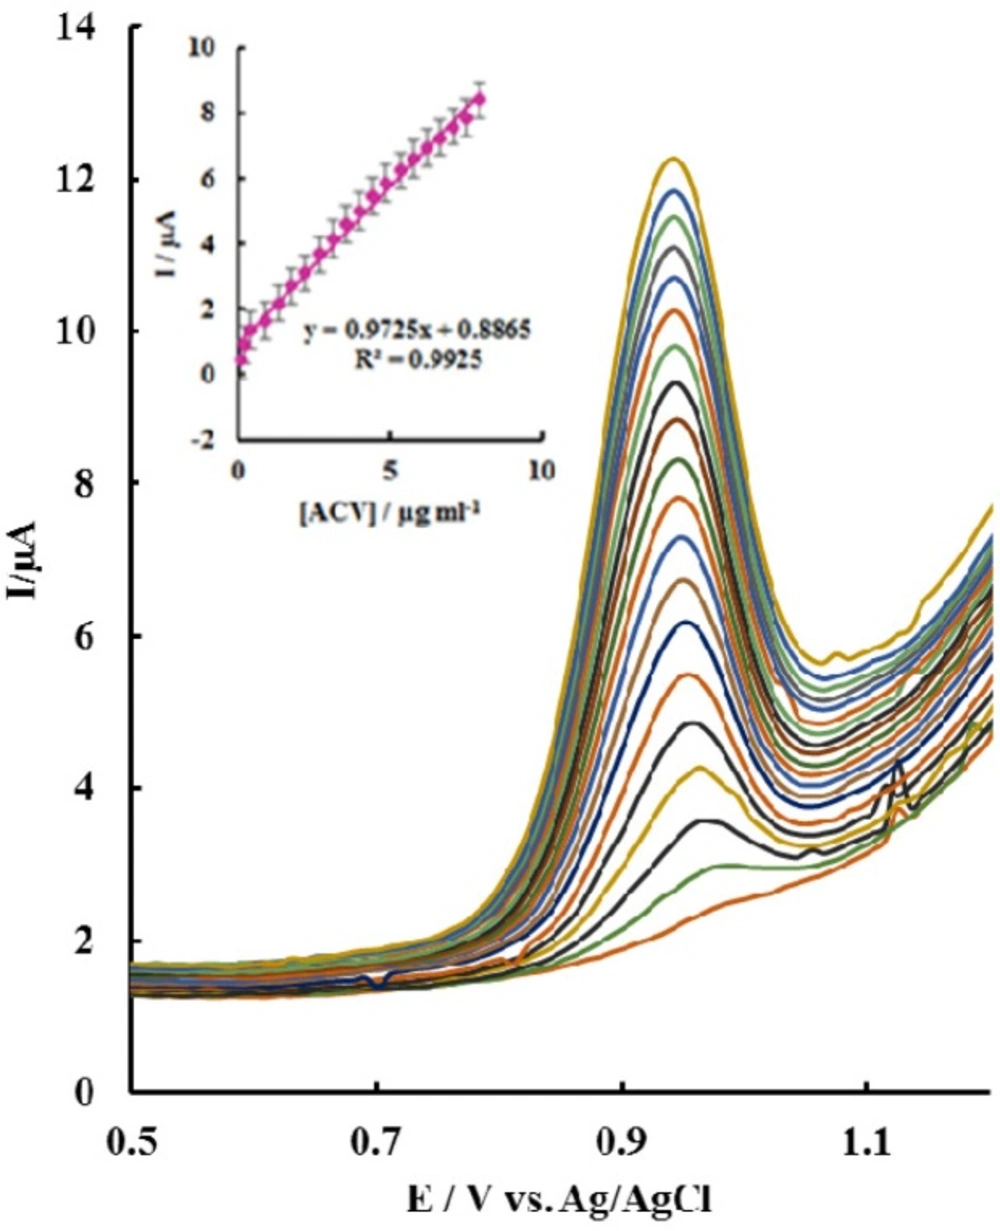
Figure 6
DPV curves of P-OAP/MWCNTs-ZnO NPs/CPE in different ACV concentrations (from bottom to top): 0.089 – 7.96 µg mL-1. The inset is the Ipavs. ACV concentration plot
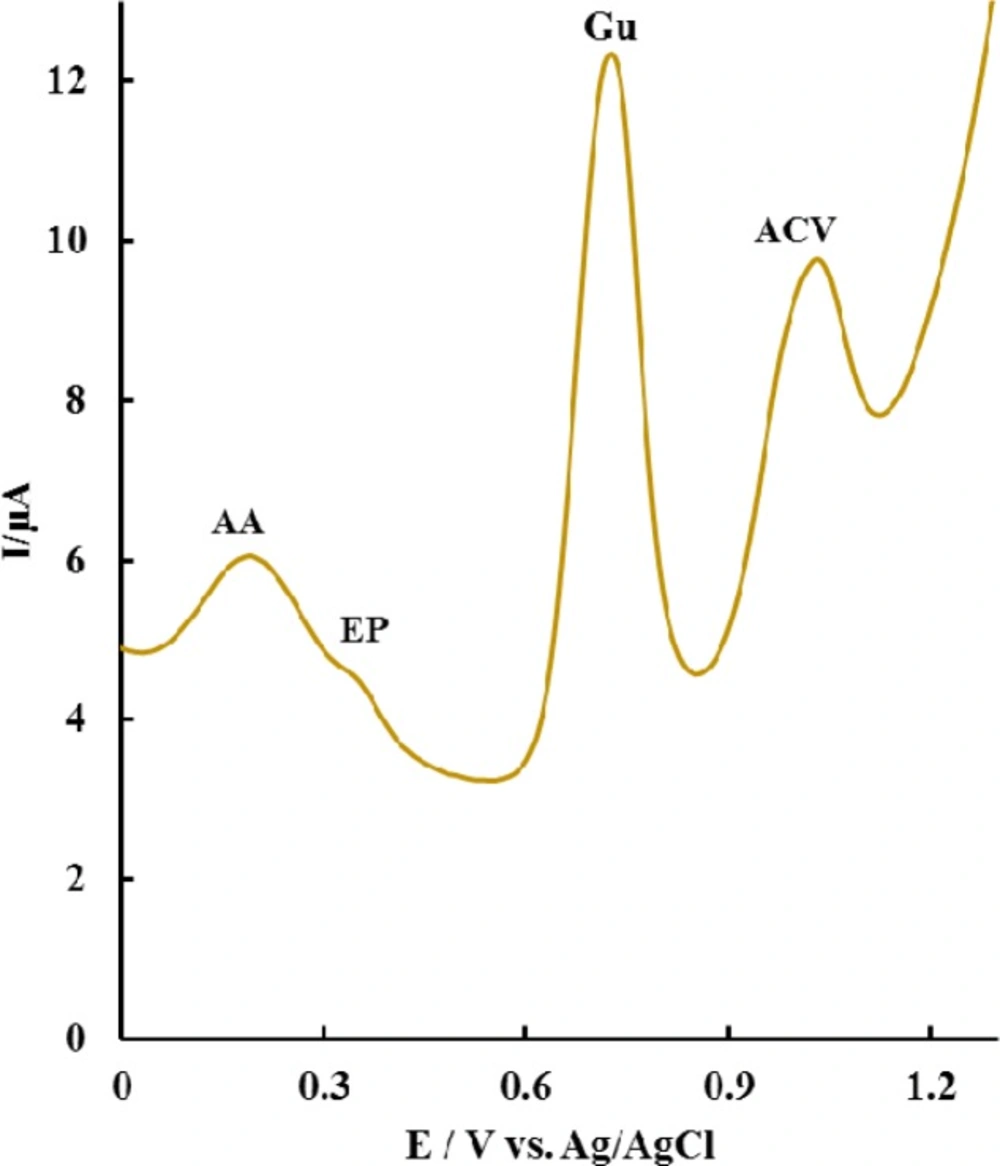
Figure 7
DPV of ACV (2.24 µg mL-1) in the presence of 11.26 µg mL-1 ascorbic acid (AA), 2.24 µg mL-1 epinephrine (EP), 6.75 µg mL-1 guanine (Gu)
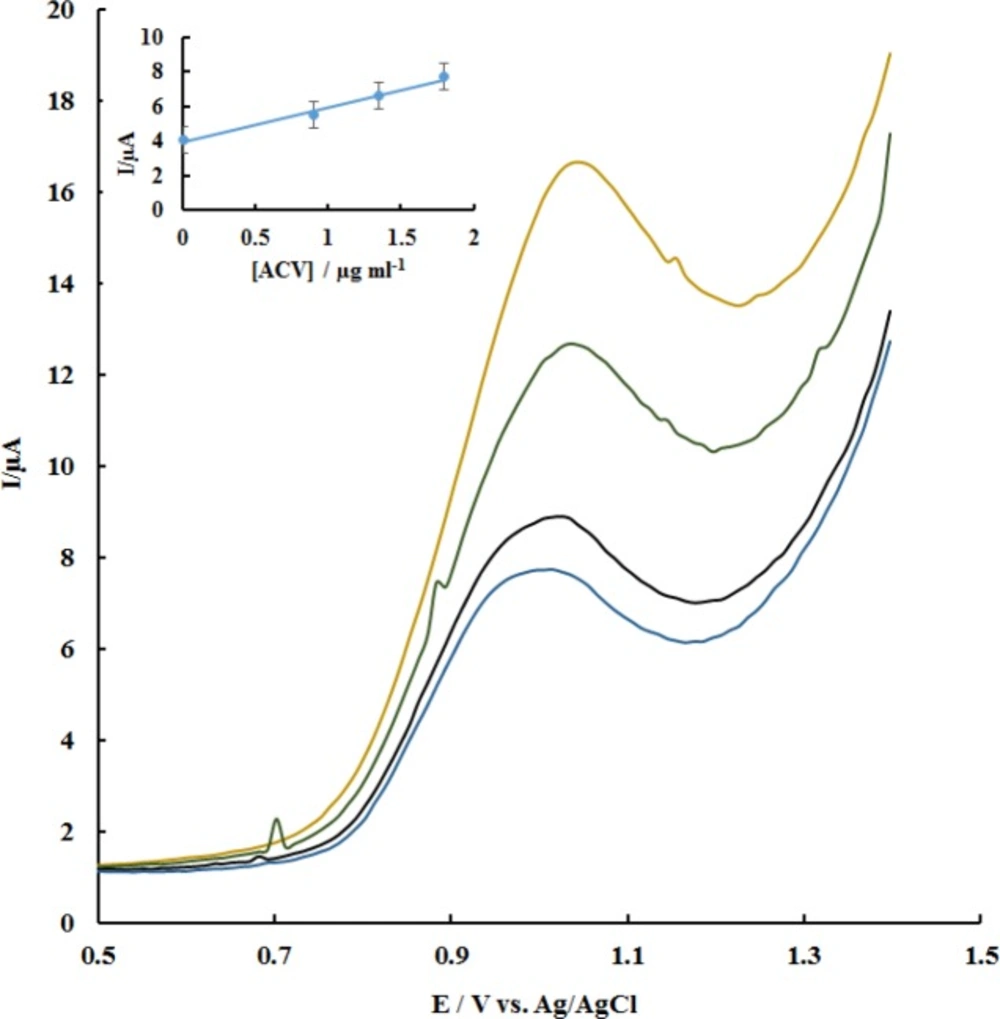
Figure 8
DPVs for the addition of different concentrations of standard ACV (from down to up: 0, 0.89, 1.34, 1.79 µg mL-1) to the real sample solution of ACV tablet, and plot of peak current versus added concentrations of ACV (inset). Supporting electrolyte, phosphate buffer solution (pH 7.0).
Electrochemical behavior of ACV at P-OAP/MWCNTs-ZnO NPs-CPE
The electrochemical behavior of ACV at the different modified electrodes in phosphate buffer at pH 7.0 was examined using cyclic voltammetry (CV). Figure 3 shows the cyclic voltammograms for 11 µg mL-1 ACV in deoxygenated 0.1 M phosphate buffer solution (PBS). As can be seen at the bare CPE (curve a in Figure 3), a broad and small irreversible oxidation peak were observed around 1.1 V. At the surface of modified electrodes, the peak currents of ACV increased and oxidation peak potential (Epa) values reduced. When OAP was electropolymerized on the surface of MWCNTs-ZnO NPs-CPE, the largest peak current among the studied electrodes was observed and Epa significantly reduced. The step-by-step improvement of peak currents and lowering of overpotentials, demonstrates the synergistic effect of all three ingredients of the modified electrode.
Effect of scan rate
CV experiments were carried out to investigate the influence of scan rate at P-OAP/MWCNTs-ZnO NPs-CPE in 0.1 M PBS (pH 7) containing 6.6 µg mL-1 ACV (Figure 4A).
There was a good linear relationship between peak current (Ip) and square root of scan rate (v1/2) in the range of 10–200 mV s-1 (Figure 4B). The regression line equation was IP/μA = -11.167 + 6.3119 v1/2 (mV1/2 s-1/2); R2 = 0.9955, which indicates that the electrode process was controlled by diffusion of ACV to the electrode surface, rather than adsorption.
Meanwhile, there was a linear relation between log (IP/μA) and log (υ/mVs-1), corresponding to the following equation: log (IP/μA) = 0.6569 log(υ/mVs-1) + 0.3935; R2 = 0.9976
(Figure 4C). The slope of 0.6569 was very close to the theoretically expected value of 0.5 for diffusion – controlled processes (40). More evidences for the non-adsorption behaviors of ACV were demonstrated by the following experiments. When P-OAP/MWCNTs-ZnO NPs-CPE was switched to 0.1 M PBS (pH 7.0) after being used in ACV, there was no peak signal at all.
Effect of pH on the response of ACV
The effect of buffer pH on the electrochemical responses of 0.1 M ACV on P-OAP/MWCNTs-ZnO NPs-CPE was investigated in the pH range from 4 to 9. The relationship of the oxidation peak current and the peak potential with buffer pH were plotted with the results shown in Figure 5. The maximum peak current appeared at pH 7.0 and then decreased with further increase of pH. So pH 7.0 PBS was selected as the optimal buffer pH. With the increase of buffer pH the peak current began to decrease at a higher pH value. The peak potential (Ep) shifted negatively with the increase of pH value, indicating that protons were involved in the electrode reaction. A good linear relationship between Ep and pH was constructed with the linear regression Equation as Ep (V) = −0.043 pH + 1.2993 (R2 = 0.9904). The slope value of -0.043 V/pH was close to the theoretical value of −0.059 V/pH, indicating that an equal number of protons and electrons occurred in electrode reaction. This is in agreement with previous works who indicated that two protons and two electrons are involved in the electrochemical process of ACV (Scheme 3) (15, 17 and 21).
Calibration curve
In order to test the feasibility of the exploited method for the quantitative analysis of ACV, the relationship between the anodic peak current and the concentration of ACV was studied using differential pulse voltammetry (DPV). Under the optimum conditions, when the concentration of ACV changed from 0.089 to 7.96 µg mL-1, the anodic peak current and ACV concentration declared linear relationship (Figure 6). The regression Equation was: Ip (µA) = 0.9725 [ACV] (µg mL-1) + 0.8865 (R2 = 0.9925). Based on the signal to noise ratio of 3, the detection limit of 0.067 ± 0.004 µg mL-1 was obtained.
The analytical parameters for the electrochemical detection of ACV on different modified electrodes were summarized in Table 1. Although, a wider linear dynamic and a lower detection limit in most cases was observed ratio to the proposed method. But, the fabricated electrode showed advantages including high sensitivity, simple modification process, very easy surface update and good stability. Also the method can be performed using inexpensive equipment in a relatively short time.
Interference studies
The selectivity of P-OAP/MWCNTs-ZnO NPs-CPE for the sensitive determination of ACV was evaluated. Interference study was carried out by recording DPV in the presence of 2.24 µg mL-1 of ACV plus the potential interfering substances at pH 7.0. It was found that, at P-OAP/MWCNTs-ZnO NPs-CPE, four well separated peaks at 0.19, 0.35, 0.73 and 1.04 V were observed corresponding to the oxidation of ascorbic acid (AA), epinephrine (EP), Guanine (Gu) and ACV, respectively (Figure 7). Moreover, the results also showed 100-fold glucose and glycine, 500-fold ascorbic acid, cysteine and tryptophan; and 50-fold adenine have no significant effect on the determination of ACV. Thus, the electrode showed proper selectivity for use in biological samples.
Stability and reproducibility
To test reproducibility of the measurements, the CV for 2.24 µg mL-1 ACV in 0.1 M PBS (pH 7.0) is recorded several times with a 1 min interval between each cycle at the P-OAP/MWCNTs-ZnO NPs-CPE. The oxidation current of ACV remains the same with a relative standard deviation (RSD) of 2.78% for 10 repetitive measurements. This indicates that P-OAP/MWCNTs-ZnO NPs-CPE possesses excellent reproducibility. In addition, reproducibility is also checked by six parallel measurements for the determination of 2.24 µg mL-1 ACV with freshly prepared electrodes for each determination and the RSD is found to be 3.13%, indicating high reproducibility between different P-OAP/MWCNTs-ZnO NPs-CPE electrodes. The storage stability of the proposed sensor is also investigated. After the voltammetric measurements, the electrode is stored in 0.1 M PBS (pH 7.0) at room temperature. After a three week period, when the same electrode is used for the determination of ACV, it retains 96.8% of its initial response indicating the reusability and stability of the sensors. The above result indicates that the present proposed sensor has high stability and reproducibility towards oxidation and determination of ACV.
Analytical applications
In order to ascertain its potential application, the utilization of the P-OAP/MWCNTs-ZnO NPs-CPE in real samples was investigated by analysis of ACV in pharmaceutical formulation (tablet) samples. Four tablets containing a labeled value of 200 mg ACV were accurately weighed and ground to a fine powder. A suitable amount of the powdered sample was dissolved in 50 mL of water to get a nominal concentration of 22.52 µg mL-1. Then, a 200 µL aliquot of the resulting solution was transferred to a 10.0 mL volumetric flask and spiked with standard solutions of ACV in the range of 0.89-1.79 µg mL-1. The voltammetric responses and the corresponding calibration plot of the peak currents versus added ACV concentrations are shown in Figure 8. The standard addition method was used for the analysis of the prepared samples. Table 2 summarizes the results of triplicate measurements for different samples. Satisfactory recoveries for all samples were obtained in the range of 94.0–103.75% suggesting that the proposed method is feasible and effective with high accuracy.
Conclusions
A stable thin film of poly (o-aminophenol; OAP) has been deposited on the surface of modified carbon paste electrode by multi-walled carbon nanotubes (MWCNTs) and ZnO nanoparticles, in aqueous HClO4 solution containing o-aminophenol. The electrochemical behavior of ACV was investigated at the surface of modified electrode. The unique properties of MWCNTs, ZnO nanoparticles and P-OAP and their synergistic effect result in a considerable enhancement of the electrochemical activity and stability of the modified electrode for the determination of ACV. Under the optimized conditions the oxidative peak currents increased linearly with the concentration of ACV in the range from 0.089 to 7.96 µg mL-1, with a detection limit of 0.067 µg mL-1. Besides the good sensitivity and selectivity, the sensor represented high stability and good reproducibility for ACV analysis, and provided satisfactory results for the determination of this compound in pharmaceutical formulations.