Materials
Cell culture reagents, penicillin–streptomycin and trypsin EDTA solutions and also fetal bovine serum (FBS) were obtained from Biosera Co. (Ringmer, UK). Culture flasks and dishes were acquired from SPL Lifesciences Inc. (Gyeonggi-Do, South Korea). 3-[4,5-Dimethyl-2-thiazolyl]-2,5-diphenyl-2 tetrazolium bromide (MTT) powder, neutral red, and vincristine were purchased from Sigma (St. Louis, MO, USA). Primary polyclonal anti-caspase 3 and primary monoclonal anti-beta-actin antibodies were purchased from Cell Signaling Technology, Inc. (Beverly, MA, USA). Primary polyclonal anti-Bax, primary monoclonal anti-Bcl-2 antibodies and primary monoclonal anti-cyclin D1 antibodies were obtained from Santa Cruz Biotechnology, Inc. (Santa Cruz, CA, USA).
Preparation of planttotal extract
An ethanolicSatureja extract was prepared in Razi Herbal Medicines Research Center (Lorestan, Iran). The healthy leaves were dried under shaded conditions, and to avoid the decomposition of chemical constituents, dried leaves were powdered and stored in clean and dry airtight containers for further studies. A sample was deposited at the herbarium of Razi Herbal Medicines Research Center. Two-hundred grams of the air-dried leaves were ground into fine powder. The powder was extracted twice; on each occasion with one liter of 80% ethyl alcohol. The collective ethanol extract was filtered, the filtrate was concentrated to dryness under reduced pressure in a rotary evaporator, and the resulting ethanolic extract was freeze-dried. It has been reported that carvacrol (78.3%), 9-Octadecenoic acid (13.5%), hexadecanoic acid (6.7%), bis (2-ethylhexyl) phthalate (1.0%), and beta-bisabolene (0.5%) were the main compositions of the satureja extract (
11,
13). Aliquot portions of the total crude satureja extract were weighed and dissolved in PBS.
Cell culture
Human MCF-7 cancer cells were obtained from National Cell Bank of Iran (NCBI)–Pasteur Institute of Iran (Tehran, Iran). Cells were grown with Dulbecco’s modified Eagle’s medium supplemented with 10% fetal bovine serum, penicillin (100 U/mL), and streptomycin (100 μg/mL). They were maintained at 37°C under an atmosphere of 5% CO2. After two passages, the cells were plated at a density of 5000 per well in a 96-well cell culture plate for the MTT and neutral red assay. For protein extraction, cells were grown in a 6-wellcell culture plate well and permitted to attach and grow for 24 h. Then the cells were incubated in medium containing different concentration (20-200 µg/mL) of satureja khuzestanica total extract (SKE) for 24 h.
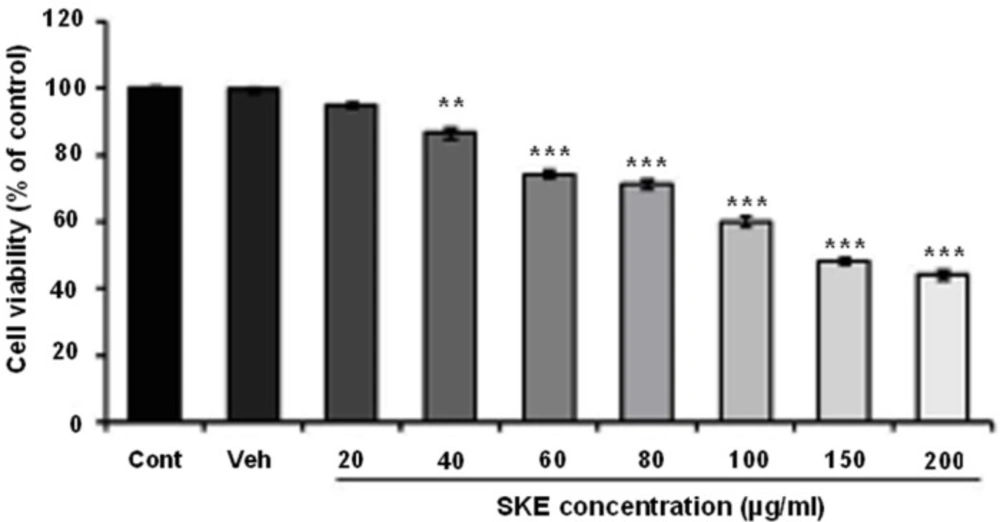
Effects of different doses of satureja khuzestanica total extract (SKE) on MCF-7 cancer cells viability which determined by MTT assay. Data are expressed as mean ± SEM; n = 5–6 wells for each group; **P < 0.01 and ***P < 0.001 versus control non-treated cells
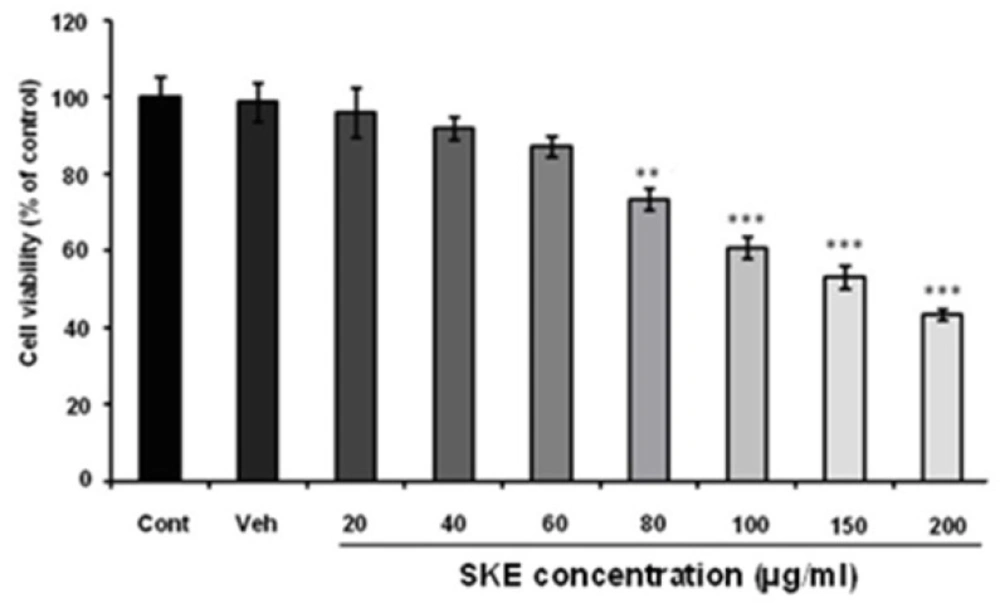
Effects of different doses of satureja khuzestanica total extract (SKE) on MCF-7 cancer cells viability which determined by neutral red assay. **P < 0.01, ***P < 0.001 versus control non-treated cells
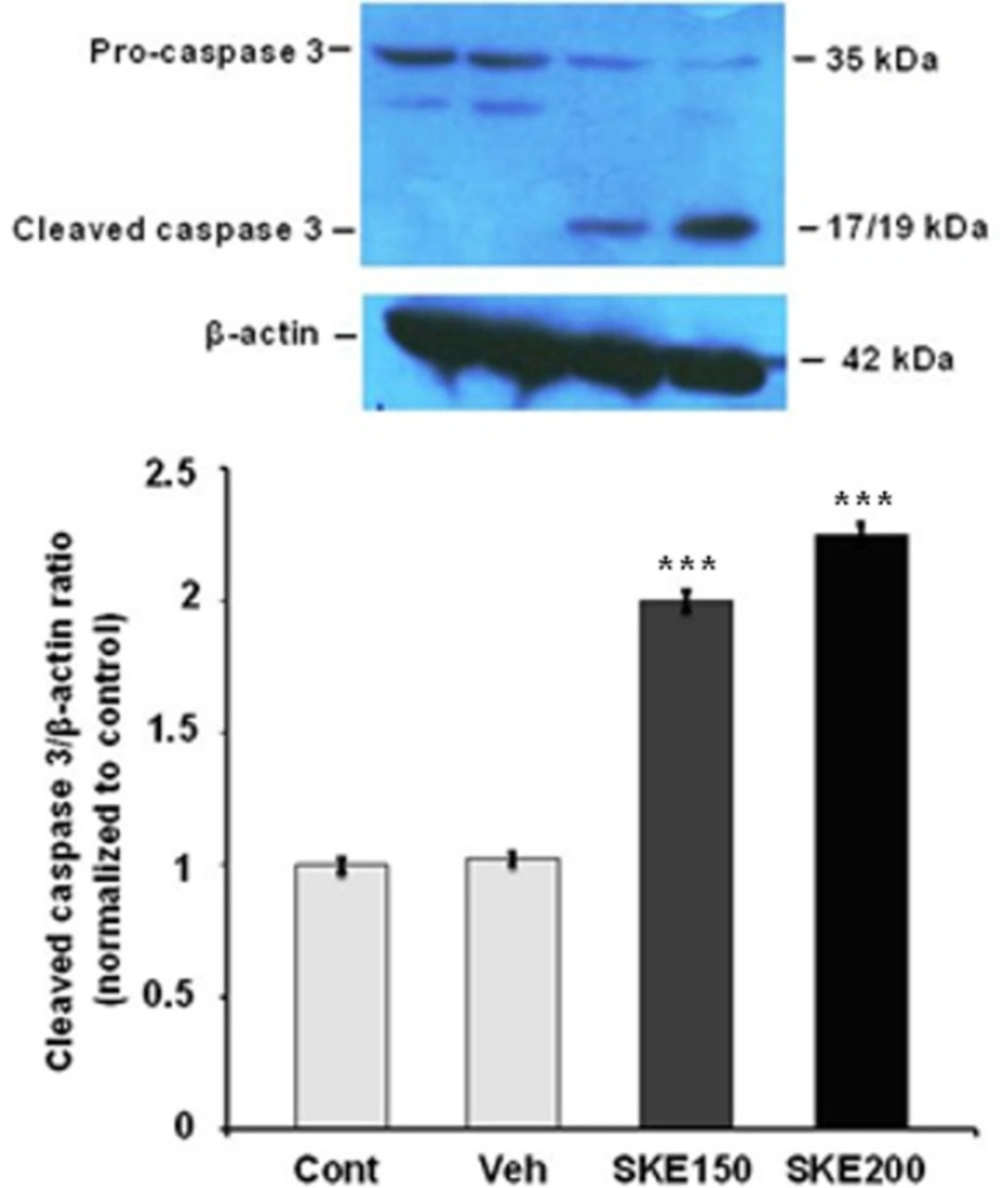
The activation of caspase-3 protein in MCF-7 cells exposed to 150 and 200 μg/mL ofsatureja khuzestanica total extract (SKE) for 24 h. Each value represents the mean ± SEM band density ratio for each group. β-actin was used as an internal control. ***P < 0.01 significantly different versus control and vehicle-treated cells
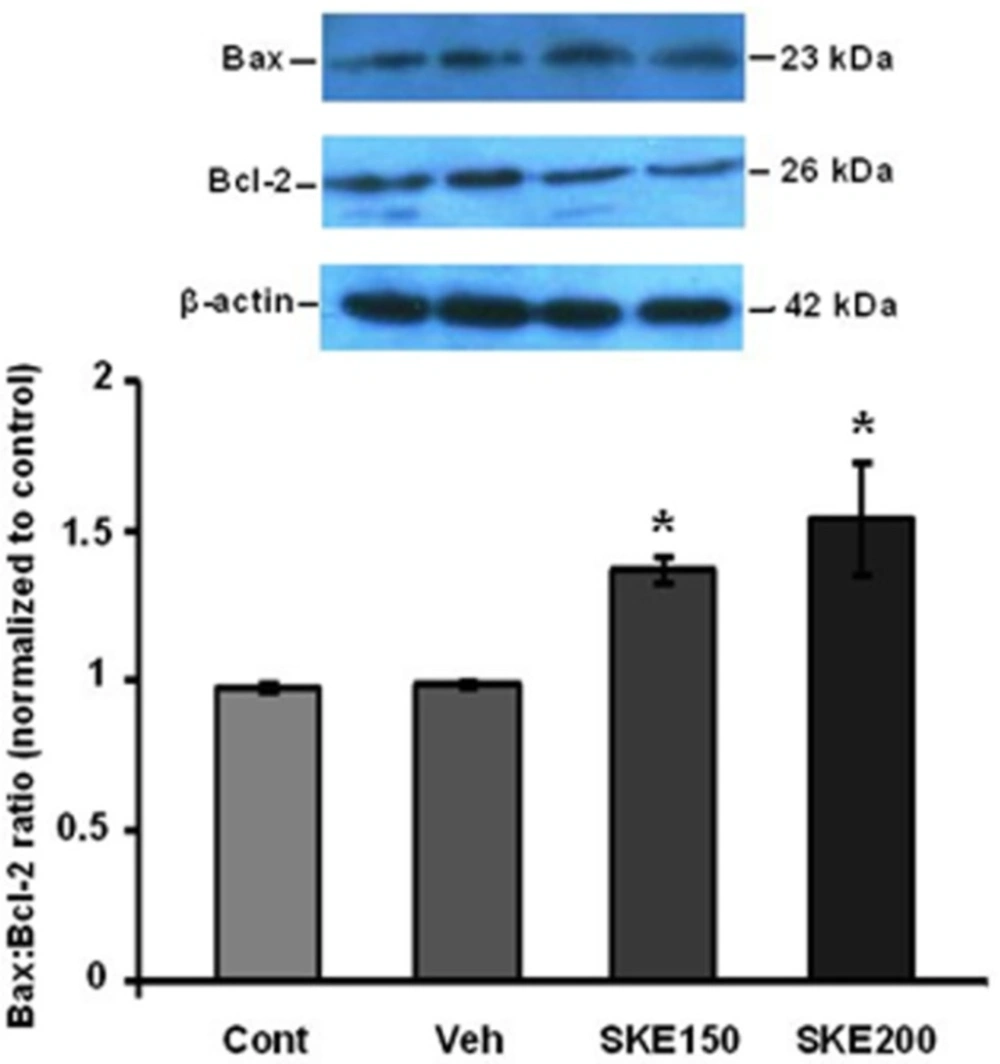
Effect of satureja khuzestanica extract (SKE) on levels of Bax and Bcl-2 protein expressions in MCF-7 cancer cell line. Bax and Bcl-2 protein levels were assayed by western blotting. *P < 0.05 significantly different versus control and vehicle-treated cells
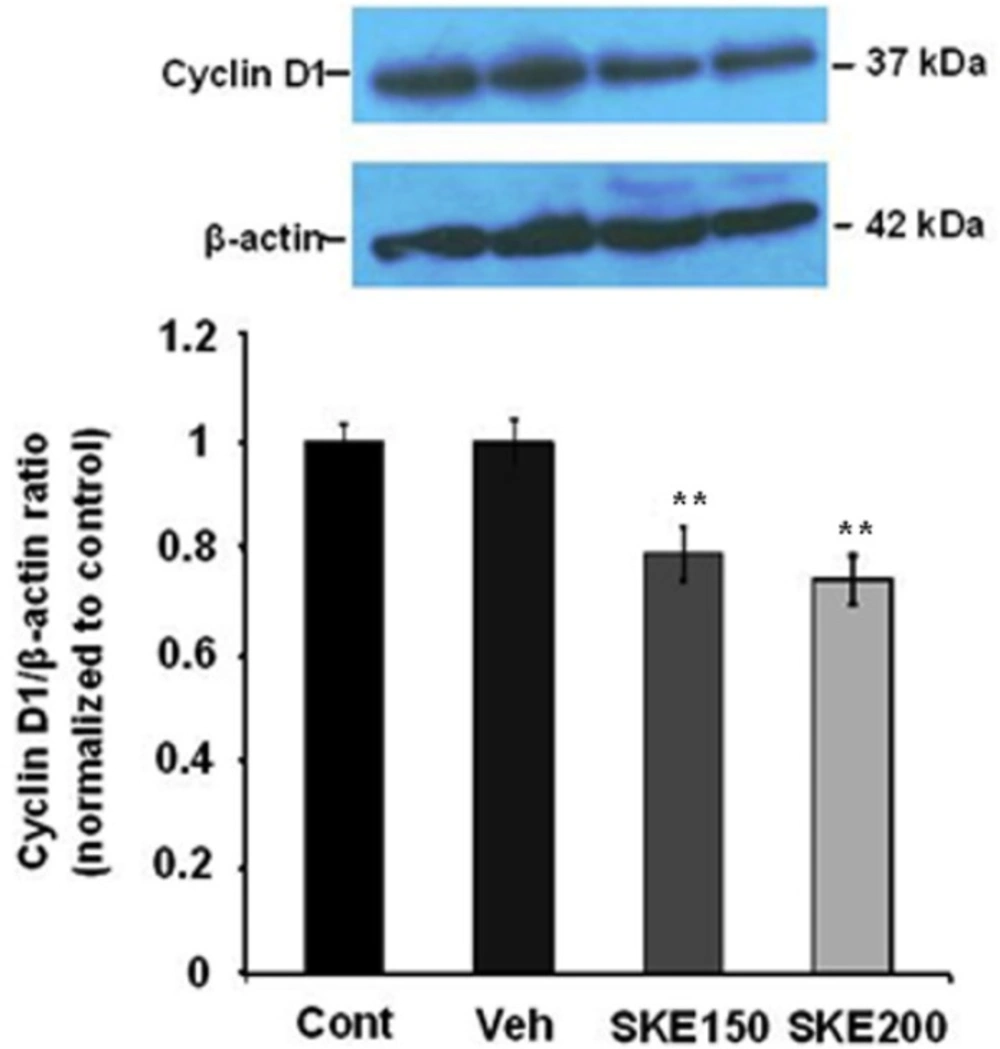
Effect of satureja khuzestanica total extract (SKE) on the level of cyclin D1 in MCF-7 cells. Each value represents the mean ± SEM band density ratio for each group. β-actin was used as an internal control. **P < 0.01 significantly different versus control and vehicle-treated cells
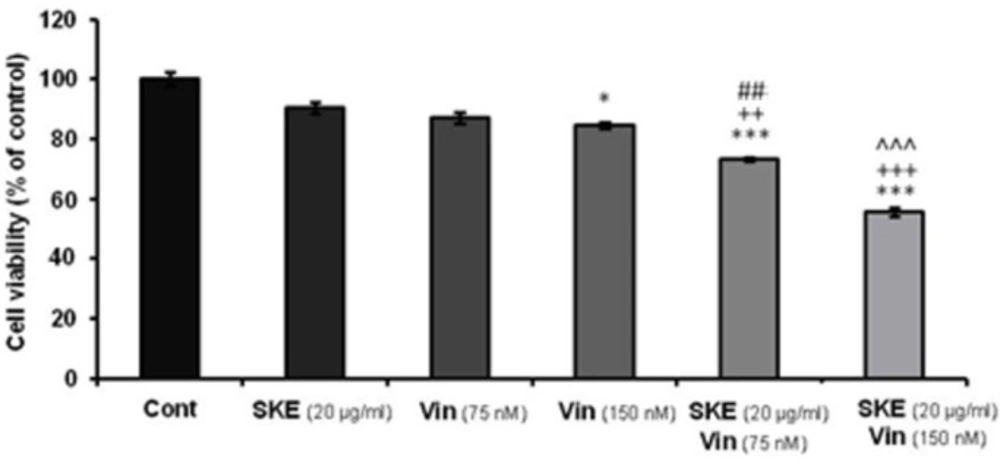
Effect of non-effective (20 μg/mL) dose of satureja khuzestanica total extract (SKE) alone or in combination with 75 or 150 nM vincristine on MCF-7 cell viability which determined by MTT assay. Data are expressed as mean ± SEM; n = 6 wells for each group; *P < 0.05, ***P < 0.001 versus control cells. ++P < 0.01 and +++P < 0.001 versus cells that had SKE alone. ##P < 0.01 versus 75 nM vincristine. ^^^P < 0.001 versus cells that had 150 nM vincristine alone
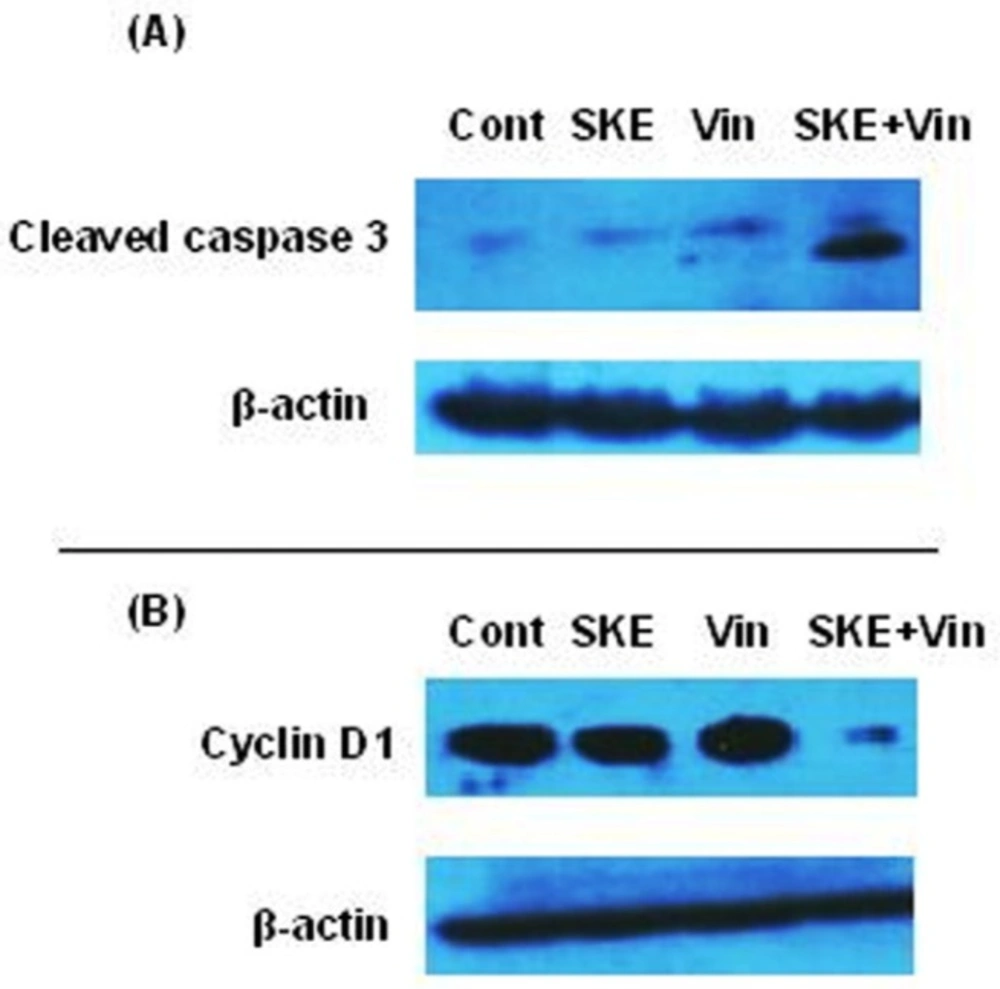
Effect of sub-effective doses of sutureja khuzestanica total extract (SKE, 20 µg/mL) and vincristine (Vin, 150 nM) alone or in combination on the levels of activated caspase 3 (A) and cyclin D1 (B) in MCF-7 cancer cells. β-actin was used as an internal control for loading
Cell viability analysis
MTT assay
Cellular viability was assessed by reduction of 2-(4, 5-dimethylthiazol-2-yl)-2, 5-diphenyltetrazolium bromide (MTT) to formazan (
18). MTT was dissolved in PBS and added to the culture at a final concentration of 0.5 mg/mL. After an additional 2 h of incubation at 37°C, the media was carefully removed, 100 mL DMSO was added to eachwell, and the absorbance (OD) values were determined by spectrophotometry at 490 nm with an automatic microplate reader (Eliza MAT 2000, DRG Instruments, GmbH, Marburg, Germany). The results are expressed relative to the control value.
Neutral red assay
The neutral red assay has been used extensively for
in-vitro assessment of cytotoxicity of infectious agents, food additives, and pharmaceuticals. This assay is based on the incorporation of neutral red (3-amino-7dimethyl-1-2-methylphenazine hydrochloride) into the lysosomes of viable cells after being incubated with test agents (
19). Neutral red (4mg/mL) was diluted 1:100 into medium and incubated overnight at 37 °C and centrifuged before use. Two-hundred µL of prepared neutral red solution was added to each well and the cells were incubated at 37 °C for 3 h. After that the cells were rapidly washed with a solution of 1% calcium chloride and 0.5% formaldehyde. The dye is then extracted from the intact and viable cell with a solution of 1% acetic acid and 50% ethanol. Subsequently, absorbance (OD) values were measured by spectrophotometry at 540 nm. Results were expressed as percentages of control.
Immunoblot analysis
MCF-7 cells were homogenized in ice-cold buffer containing 10 mM Tris–HCl (pH 7.4), 1 mM EDTA, 0.1% SDS, 0.1% Na-deoxycholate, 1% NP-40 with protease inhibitors (1 mM phenyl methyl sulfonyl fluoride, 2.5 µg/mL of leupeptin, 10 µg/mL of aprotinin) and 1 mM sodium orthovanadate. The homogenate was centrifuged at 14000 × g for 15 min at 4 °C. The resulting supernatant was retained as the whole cell fraction. Protein concentrations were measured using the Bradford-based protein assay (Bio-Rad Laboratories GmbH, Muenchen, Germany) and equal amounts of protein (40 µg) were resolved electrophoretically on a 9% or 12% SDS-PAGE gel and then transferred to nitrocellulose membranes (Hybond ECL, GE Healthcare Bio-Sciences Corp. NJ, USA). After overnight blocking at 4 °C with 5% non-fat dried milk in Tris-buffered saline with Tween 20 (blocking buffer, TBS-T, 150 mM NaCl, 20 mM Tris–HCl, pH 7.5, 0.1% Tween 20), the membranes were probed with rabbit monoclonal antibody to caspase-3 (Cell Signaling Technology, USA, 1:1000 overnight at 4 °C), Bax (∆ 21): sc-6236, Bcl-2 (C-2): sc-7382, cyclin D1 (H-295): sc-753 (Santa Cruz, USA, 1:1000) for three h at room temperature. After washing in TBS-T (three times, each time 5 min), the blots were incubated for 60 min at room temperature with a horseradish peroxidase-conjugated secondary antibody (1:15000, GE Healthcare Bio-Sciences Corp. NJ, USA). All antibodies were diluted in blocking buffer. The antibody-antigen complexes were detected using the ECL system and exposed to Lumi-Film chemiluminescent detection film (Roch, Germany). Lab Work analyzing software (UVP, UK) was used to analyze the intensity of the expression. β-actin immunoblotting (antibody from Cell Signaling Technology, INC. Beverly, MA, USA; 1:1000) was used to control for loading. The immunoblot experiments for each protein were performed 3-4 independent times.
Statistical analysis
The results are expressed as mean ± SEM. The differences in mean cell viability assays between experimental groups were determined by one-way ANOVA, followed by Tukey test. The values of caspase 3, Bax, Bcl-2, cyclin D1, and β-actin band density were obtained from band densitometry. These values were expressed as tested proteins/β-actin ratio for each sample. The averages for different groups were compared by ANOVA and followed by Tukey test. P < 0.05 was considered significant.