Plant material collection
The fresh plant material was collected in May 2014 from the region of around Golpayegan, Isfahan province, Iran. The present sample was identified and authenticated by the taxonomist and a voucher authentication number of 45816-Tuh was assigned and deposited in the Department of Biological Sciences, University of Tehran, Tehran, Iran.
Extraction of plant material
Collected plant material was dried at room temperature; its leaves were removed from the stem and were then powdered. Powdered leaf samples were extracted by floating them in methanol. The crude methanol extract of E. platyloba leaves was prepared by weighing 300 g of pre-prepared powder and extracting the power with maceration method by using 96% methanol eluent. Extraction was conducted under ambient temperature and the eluent was replaced every 24 h. The extraction process (eluent replacement) was repeated 10 times and the resultant extract was filtered by Watman filter paper. The macerate was evaporated by vacuum rotary evaporator under a temperature of 50 °C to obtain thick greenish matrix. The crude methanolic extract was then stored for the further experiments.
DPPH radical scavenging activity method
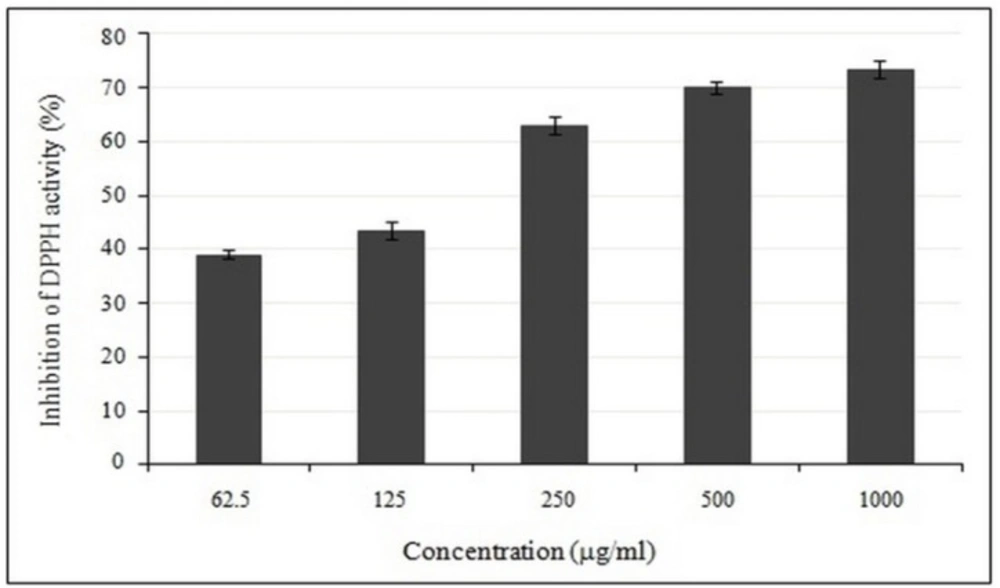
The free radical scavenging activity of crude methanol extract was evaluated using the stable radical DPPH. A series of extracts with different concentrations (62.5-1000 µg/mL) were prepared for this purpose. Then, 2.5 mL of each concentration and 1.0 mL of DPPH solution in methanol were mixed and placed in the dark at the room temperature for 30 min. The absorbance of each extracted sample was observed after the addition of DPPH into it and its absorbance was measured at 517 nm using UV–Visible Lambda spectrophotometer. Methanol (1.0 mL) plus the plant extract solution (2.5 mL) were used as the blank, while the DPPH solution plus methanol were used as the control. Butylated hydroxytoluene (BHT) was used as a positive control in this study. All the experiments were performed in triplicate. The DPPH free-radical scavenging activity, in terms of DPPH (%), of crude methanol extract was determined using the following relation:
DPPH free-radical scavenging capacity (%) = (1 – (Abof sample – Abof blank)/Abof control) × 100.
The antioxidant activity of crude methanolic extract was partially expressed as IC50, which was defined as the concentration of extract required to inhibit the formation of DPPH radicals by 50%.
Cell culture and treatment
MDA-MB-231 and MCF-10a cells were cultured in cell culture flask at 37 °C with 5% CO2 in RPMI 1640 medium with 10% fetal bovine serum (FBS) and 1% antibiotics (penicillin-streptomycin).
Different concentrations (25-1000 g/mL) of crude methanolic extract were prepared by dissolving it into DMSO and then diluting it with RMPI medium under sterile conditions.
Cultured cancer cells with 80-90% confluence were used for plating. The adherent cells were detached from the flask bottom by trypsinization and were seeded at the quantity of 100 µL of cells per well of the 96-well microtiter plates (1 - 5 × 10⁴ cells/well). The plates were maintained at 37 °C in a humid incubator with an air mixture containing 5% (v/v) CO2 for 24-48 h until 80-90% confluence. Then, old medium were discarded and 200 µL of new medium were added. Then, the cells were treated with serial dilution of crude methanolic extract and toxol. Toxol was used as standard drug. The cells were also treated with DMSO as negative control. The plates were returned to incubator for 12, 24 and 36 h. All treatments were done in triplicate.
MTT assay of in-vitro cytotoxicity
After treatment with crude methanol extract, the cell viability was evaluated using MTT assay. Cell samples were incubated with 25 μL MTT for 3 h at 37 °C, the supernatant was removed and the formazan crystals, formed in viable cells, were solubilized with 100 μL of DMSO. Finally, the absorbance of each well was measured at 570 nm with ELISA Reader. The percentage growth inhibition was calculated using following relation:
% cell inhibition = 100 - ((At - Ab)/(Ac - Ab)) × 100
where, At = absorbance value of test compound, Ab = Absorbance value of blank and Ac = Absorbance value of control.
The anticancer effect and effective dosage of present extract was evaluated in terms of IC50 values (the drug concentration affecting the growth of treated cells by 50% with respect to untreated cells).
| Concentration (μg/mL) | Growth inhibition (%) |
|---|
| (A) E. platyloba | |
|---|
| 100 | 25.35 |
| 200 | 32.44 |
| 300 | 36.94 |
| 400 | 41.97 |
| 500 | 48.07 |
| 600 | 50.89 |
| 700 | 59.63 |
| 800 | 60.12 |
| 900 | 73.67 |
| 1000 | 79.98 |
| (B) Taxol | |
| 5 | 47.25 |
| 10 | 64.36 |
| 15 | 71.15 |
| 20 | 79.83 |
| 25 | 83.28 |
Dose-dependent activity of crude methanolic extract of E. platyloba using DPPH radical scavenging assay. Data are mean ± SD (n = 3
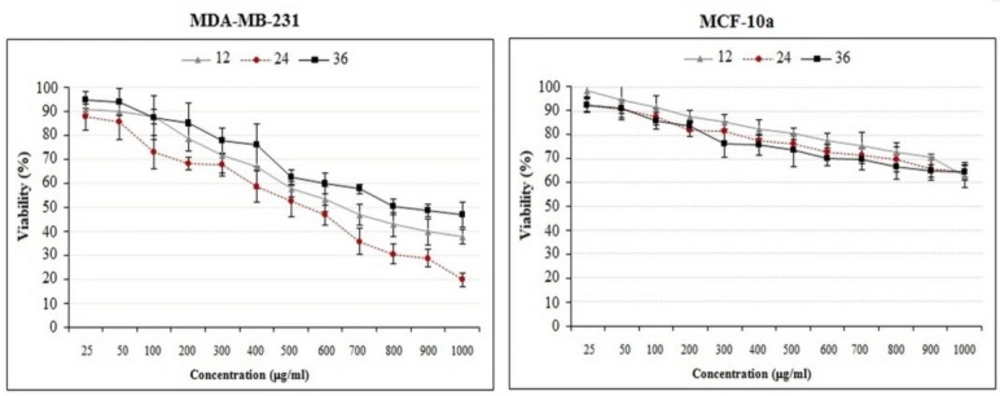
The effects of crude methanolic extract of E. platyloba on the proliferation of MDA-MB-231 and MCF-10a cells. Cells were incubated with increasing concentrations of present extract for 12, 24 and 36 h. The proliferative response was then assessed by MTT assay. The data are presented as the means ± SD (n = 3
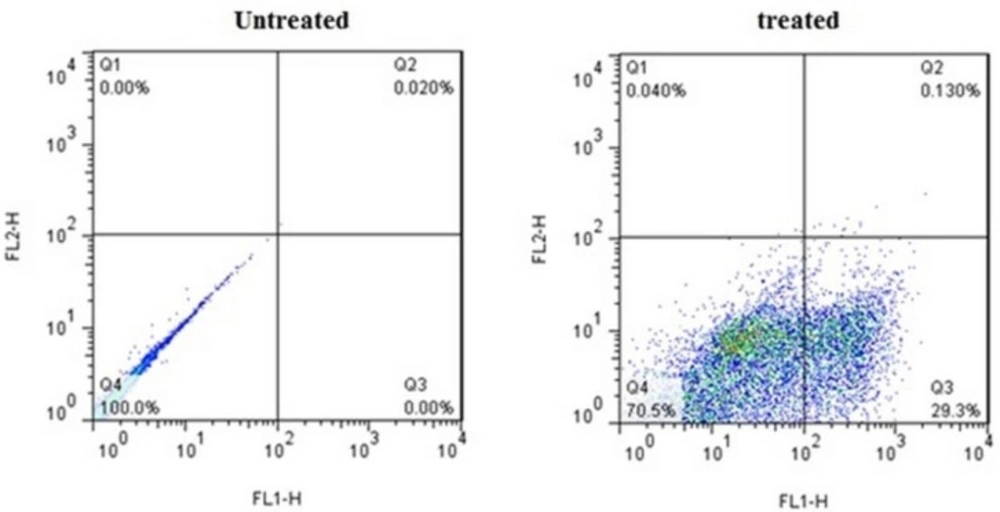
Flow cytometric analysis of Annexin V-FITC (FL1-H) at X-axis and PI (FL2-H) at Y-axis after double staining of MDA-MB-231 cells, treated with crude methanolic extract of E. platyloba at 24 h. Alive cell (Annexin V−/PI−) populations were located in the lower left quadrant (LL), apoptotic cell (Annexin V+/PI−) populations in lower right quadrant (LR), late apoptotic (Annexin V+/PI+) populations in upper right quadrant (UR), and necrotic cells (Annexin V−/PI+) were present in the upper left quadrant (UL). Dot plots of Annexin V/PI staining are shown in A) untreated MDA-MB-231 cells, B) MDA-MB-231 cells treated with IC50 concentration of crude methanolic extract
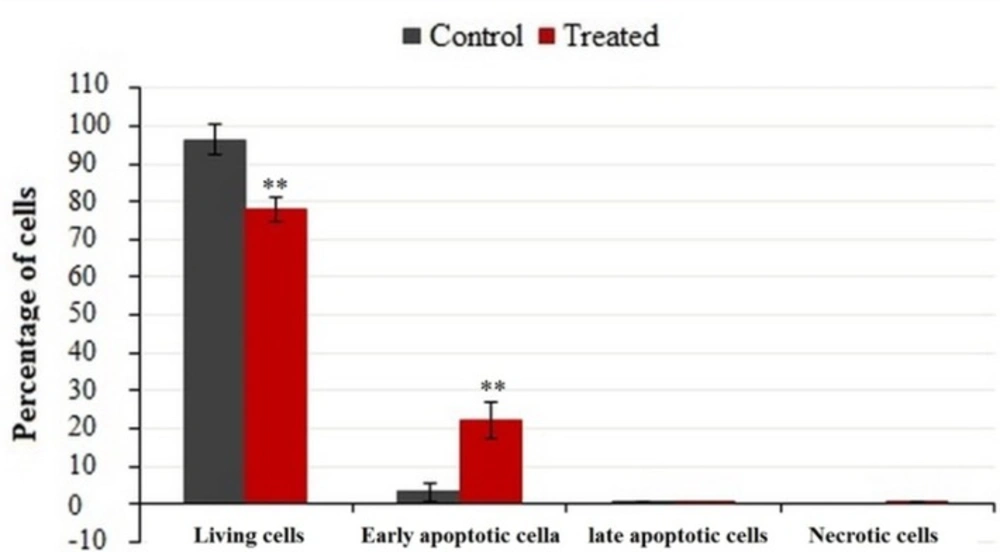
Flow cytometric analysis of phosphatidylserine-annexin V, labeled on the MDA-MB-231 cells, treated for 24 h with IC50 of crude methanolic extract. Data represent percentage mean ± SD, n = 3. Results were statistically analyzed with a Student’s t-test (*P < 0.05; **P < 0.01; ***P < 0.001
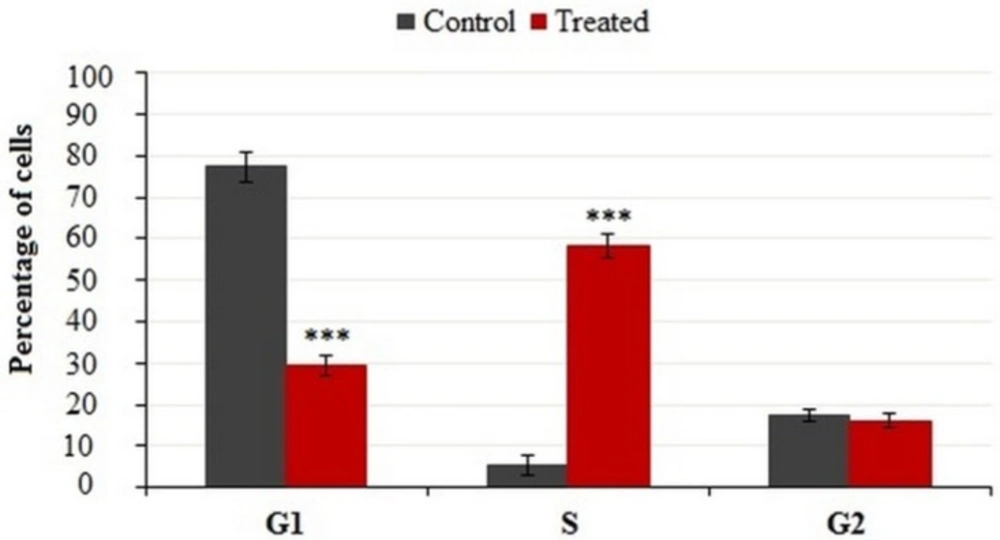
Cell cycle distributions of treated and untreated MDA-MB-231cells
Cells were incubated with IC50 concentration of crude methanolic extract for 24 h, harvested and stained with PI and analyzed by flow cytometry. Histograms represented cell cycle distribution. Results were statistically analyzed by student’s t-test (*P < 0.05; **P < 0.01; ***P < 0.001
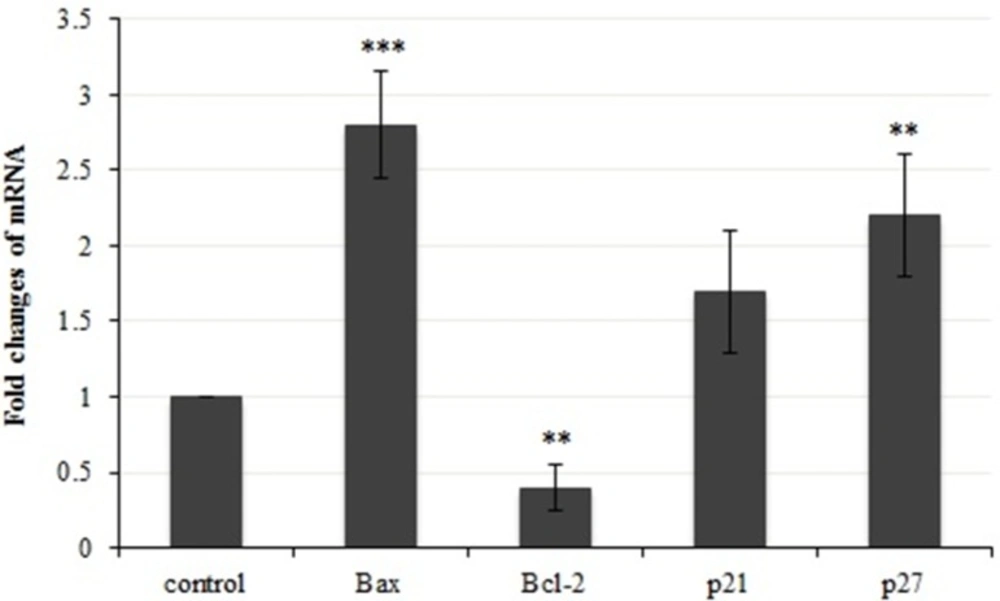
A demonstration of gene expression changes in bax, bcl-2, p21 and p27. Results were statistically analyzed with student’s t-test (*P < 0.05; **P < 0.01; ***P < 0.001
Flow cytometric analysis of apoptosis
MDA-MB-231 cells were plated in 6-well plates under standard culture conditions. After 24 h, the cells were fed with fresh medium and treated with DMSO alone (control experiment) or administered with IC50 concentration of crude methanolic extract. After 24 h of treatment, the culture medium was aspirated; the cells were quickly washed twice with ice-cold PBS and then trypsinized. The resulting cell-pellets were collected for further analyses. For apoptotic determinations, 5 × 10⁵ cells were washed with 1 mL PBS (pH 7.4) and then re-suspended in binding buffer, according to the manufacturer’s protocol. The cell aliquots were then incubated with Annexin-V-FITC and PI solutions and incubated for 15 min at 4 °C in the dark. Then, the apoptotic induction was determined by FACS can flow cytometer with the FlowJo 7.6.1 software. All the experiments were performed in triplicate.
Cell cycle analysis
The effect of crude methanolic extract of E. platyloba on the survival cells and cell cycle phase distribution of MDA-MB-231 cells was assessed using flow cytometry. Briefly, after treatment of cells with IC50 concentration of crude methanolic extract for 24 h, the floating cells were discarded by aspiration and the adherent cells were trypsinized and thereafter washed twice with cold PBS, and centrifuged. The pellet was re-suspended in 50 mL cold PBS and 450 mL of cold methanol for 1 h at 4 °C. The cells were centrifuged at 110×g for 5 min, pellets were washed twice with cold PBS, re-suspended in 500 mL PBS and incubated with 5 mL RNAase at 37 °C for 30 min. The cells were then chilled over ice for 10 min and stained with PI for 1 h for flow cytometric analysis. Flow cytometry was performed with a FACScan flow cytometer with the FlowJo 7.6.1 software.
RNA extraction and RT-PCR analysis
MDA-MB-231 cells were treated with the IC50 concentration of crude methanolic extract for 24 h. Total RNA was extracted from the cell cultures using RNX-Plus Solution, at the 70% cell confluence. A 1 mL of RNX-Plus solution was added to the cell pellet. The reaction mix was then incubated at room temperature for 5 min, followed by the addition of 200 µL chloroform and mixed well. Then, the prepared mixture was incubated at room temperature for 5 min, centrifuged at 12.000×g for 15 min at 4 °C. The aqueous phase was collected into a separate 1.5 mL micro-centrifuge tube and 500 µL of isopropyl alcohol was added to it while mixing. The reaction mixture was incubated again at room temperature for further 10 min and centrifuged at 12.000×g for 10 min at 4 °C. The RNA pellets were acquired by adding 75% absolute alcohol and stored in RNase-free water at -80 °C for further use. The total RNA concentration and its purity were measured using UV-Visible spectrophotometer at the wavelength of 260-280 nm. The integrity of the isolated RNA was confirmed by running electrophoresis of individual samples on 1% agarose gel.
After RNA preparation, the complementary DNA (cDNA) was reverse-transcribed using the 2-steps RT-PCR kit, according to the manufacturer’s instructions. The synthesized cDNA was immediately used in a real-time PCR or stored at –80 °C for further use.
Quantitative real time PCR (qPCR)
The expression of bax, bcl-2, p21, p27 and GAPDH mRNAs was determined using real-time PCR. Each cDNA sample was amplified using SYBR Green on the ABI 7500 Fast Real-time PCR System (Applied Biosystem, CA). The reaction conditions consisted of 2 μL of cDNA + 0.5 μL primers in a final volume of 20 μL of super-mix. PCR reaction parameters were as follows: denaturation at 95 °C for 5 min, followed by 50 cycles of denaturation at 95 °C for 10 sec, annealing at 60 °C for 30 sec, and finally the extension at 72 °C for 30 sec. The whole experiment was performed in triplicate.
For each sample, the ∆Ct values were determined by subtracting the average of duplicate Ct values of the target gene from the average of duplicate Ct values of the reference gene. The relative gene expression level was also normalized relative to a positive calibrator, consisting of one of the samples from the calibration curve. The relative gene expression level of the calibrator (∆Ct calibrator) was also determined by subtracting the average of duplicate Ct values of the target gene from the average of duplicate Ct values of the reference gene. The results of the present experiment were expressed as ‘N-target’ and determined as follows:
N-target = 2(∆Ct sample – ∆Ct calibrator)
Statistical analysis
All the data represented in this study are means ± standard deviation (SD) of three identical experiments, carried out in triplicate. Statistical significance of the obtained data was determined by independent t-test and the p-value ≤ 0.05 was considered significant.

![[object Object]](https://brieflands.com/journals/ijpr/articles/124761/figures/ijpr-17-307-g003-preview.webp)