Plant material and chemicals
The aerial parts of G. grandiflorum var. grandiflorum were collected from Doruksaray in Erzincan (Turkey) in June 2013. Voucher specimens were deposited in the Herbarium of Istanbul University, Faculty of Pharmacy, Istanbul, Turkey (ISTE 101801).
For the assessment of antioxidant activity, soybean L-α-phosphatidylcholine Type IV-S,2,2-diphenyl-1-picrylhydrazyl(DPPH), α1-antitrypsin from human plasma, elastase from porcine pancreas, N-succinyl-ala-ala-ala-p-nitroanilide and NaOCl were purchased from Sigma-Aldrich (St. Louis, MO, USA); 2,2’-azino-bis(3-ethylbenzothiazoline-6-sulfonic acid) diammonium salt (ABTS), and rutin were purchased from Fluka (Buchs, Switzerland); L-ascorbic acid, 2,4,6-tripyridyl-S-triazine (TPTZ), thiobarbituric acid (TBA), trichloroacetic acid (TCA), iron (II) sulfate heptahydrate and ferric chloride were purchased from Merck (Darmstadt, Germany).
For the assessment of AChE inhibitory activity, acetylthiocholine iodide (ATChI), AChE, 5,5′-dithiobis (2-nitrobenzoic acid) (DTNB) and galantamine hydrobromide were purchased from Sigma-Aldrich (St. Louis, MO, USA).
For the assessment of cyclooxygenase (COX)-2 inhibitory activity, enzyme immunoassay (EIA) kit (560131) and indomethacin were obtained from Cayman (Ann Arbor, MI, USA).
The DNA protecting activity was assessed using the pBR322 plasmid purchased from Thermo Scientific (Fisher Scientific, Pittsburgh, PA, USA).
Preparation of the extract
The aerial parts of the plant were dried in shade at room temperature then powdered using a blender. 20 g of dried and powdered aerial parts of the plant were extracted with 450 mL of MeOH 70% with continuous stirring for 3 days at room temperature. Finally, the extract was evaporated to dryness under reduced pressure at 40 ºC in a rotary evaporator. The crude extract was lyophilized (2 g) and kept at -20 °C until used. For the assessment of activities, the extracts were dissolved in metanol. All the analyses were performed using a microplate reader (Biotek, Winooski, VT, USA).
Determination of the total phenolic compounds
Phenolic compounds in the extract of
G. grandiflorum were estimated by a colorimetric assay, based on procedure described by Slinkard and Singleton (
12). The results were expressed as mg gallic acid equivalents (GAE)/g of dry weight (DW).
Determination of the total flavonoid content
Total flavonoid content was determined by using a colorimetric method described by Sakanaka
et al. (
13). The results were expressed as mg of (+)-catechin equivalents (CE) per g of DW.
Determination of the total antioxidant activity
The antioxidant activity of the extract was compared to that of rutin, the most representive flavonol for phenolic plants.
Inhibition of lipid peroxidation
(LPO). LPO assay was based on the method described by Duh
et al. (
14). The formation of LPO products was assayed by the measurement of thiobarbituric acid reactive substances (TBARS) levels on the basis of malondialdehyde (MDA) reaction with TBA at 532 nm according to Buege and Aust (
15). The percentage inhibition of LPO was calculated by comparing the results of the sample with those of controls not treated with the antioxidant using the following equation:
Inhibition effect (%) = (1 - Absorbance of sample at 532 nm) x 100.
Absorbance of control at 532 nm
The DPPH
• scavenging activity of the extract was measured according to the procedure described by Brand-Williams
et al. (
16) and calculated by the following equation:
DPPH• scavenging activity (%) = (1 - Absorbance of sample at 517 nm/Absorbance of control at 517 nm) x 100.
Total radical-trapping antioxidant potential (TRAP) assay.TRAP of the extract was measured using the trolox equivalent antioxidant capacity (TEAC) assay as described by Re
et al. (
17). The ability to scavenge ABTS radical cation (ABTS
•+) was calculated by the following equation:
ABTS•+ scavenging activity (%) = (1 - Absorbance of sample at 734 nm/Absorbance of control at 734 nm) x 100.
Ferric reducing antioxidant power (FRAP) assay. The FRAP assay was carried out according to the procedure of Benzie and Strain (
18). The standard curve was constructed using iron sulfate heptahydrate solution (0.125 – 2 mM), and the results were expressed as mM Fe
2+ equivalents.
Scavenging of hypochlorous acid (HOCl) (antitrypsin protection assay). Reaction with hypochlorous acid was studied using elastase assay as described by Murcia
et al. (
19). HOCl was prepared immediately before use by adjusting NaOCl solution to pH 6.2 with dilute H
2SO
4, and its concentration was measured spectrophotometrically at 235 nm, assuming a molar extinction coefficient of 100. HOCl scavenging activity was quantified as inhibition of the inactivation of α1-antitrypsin by HOCl. α1-Antitrypsin activity was measured indirectly as elastase activity with N-succinyl-ala-ala-ala-p-nitroaniline as substrate, since elastase is inhibited by α1-antitrypsin (
20). The results were expressed as percentage inhibition of elastase activity with respect to the reaction mixture without test compound (saline only).
Inhibition (%) = (1 - Reaction rate of sample at 410 nm/ Reaction rate of control at 410 nm) x 100.
Determination of AChE inhibitory activity
The extract was screened for its AChE inhibitory activity through the modified Ellman’s spectrophotometric method (
21). Galantamine hydrobromide was used as a standard.
Inhibition of AChE (%) = (1 - Reaction rate of sample at 412 nm/ Reaction rate of control at 412 nm) x 100.
COX-2 inhibitory activity
The ability of the extract to inhibit recombinant human COX-2 was determined by calculating percent inhibition of prostaglandin production using an enzyme immunoassay (EIA) kit according to the manufacturer’s instructions (Cayman, USA).
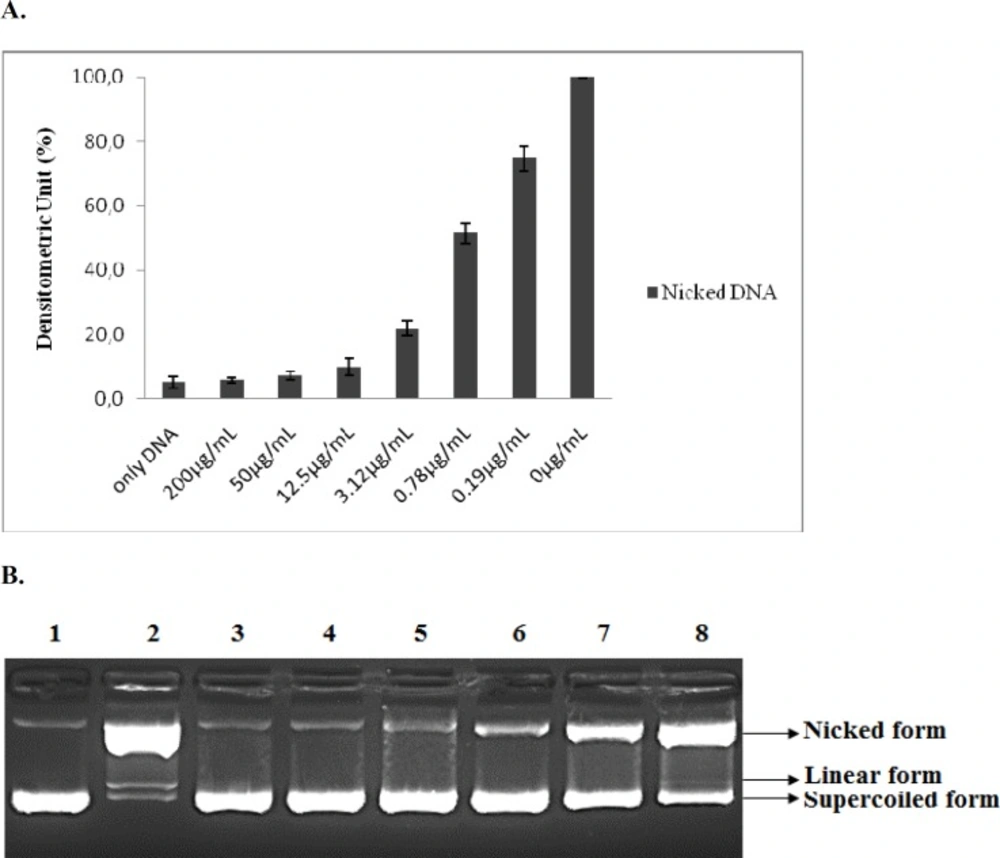
DNA nicking assay
DNA-protecting activity of the lyophilized methanolic extract of the aerial parts of
G. grandiflorum var.
grandiflorum from devastating effects of hydroxyl radicals generated by Fenton reagent was evaluated by DNA nicking assay described by Lee
et al. (
22). DNA nicking assay was performed using pBR322 plasmid DNA. The reaction mixture contained 0.5 μg plasmid DNA, Fenton’s reagent (30 mM H
2O
2, 50 µM ascorbic acid, and 80 µM FeCl
3) followed by the addition of extracts and the final volume of the mixture was brought up to 20 μL using distilled water. The mixture was then incubated for 30 min at 37 °C. The DNA was analyzed on 1% agarose gel using ethidium bromide staining. Densitometric analysis was performed by using BIO1D software.
Statistical analysis
All measurements were made in triplicate. The results were evaluated using unpaired t-test with NCSS statistical computer package and expressed as mean ± standard deviation. Differences were considered significant at p < 0.05.