Materials
The Z. multiflora was collected from local natural sources, and the solutions used were prepared with distilled water and other chemicals of analytical grade.
MTT [3-(4, 5-dimethylthiazol-2-yl) -2, 5-diphenyltetrazolium bromide], Acridine orange, propidium iodide, 4ʹ, 6-diamidino-2-phenylindole (DAPI), and silver nitrate were obtained from Sigma-Aldrich from England. Fetal bovine serum (FBS) and RPMI-1640 culture medium were purchased from Invitrogen, England. The high pure RNA isolation kit was purchased from Roche, Germany, and cDNA synthsised kit from fermentase. For PCR reaction, PARS TUS kit (Iran) and primer from Bioneer (Korea) were obtained. All the solutions were prepared with double distilled water and other chemicals were of analytical grade.
Extraction Preparation
Zataria multiflora leaves were collected from Mashhad (Khorasan-Razavi, Iran) and identified by the Herbarium Division of the Mashhad University; they were given the voucher specimen number 34516. The leaves were then washed, dried and powdered before being used for extraction. Following this step, 5 g of the leaf powder was added to 100 mL of sterile distilled water and boiled for five minutes. The extract was then filtered through a Whatman filter (paper No.1) and stored at 4 °C for further use.
The green synthesis of silver nanoparticles
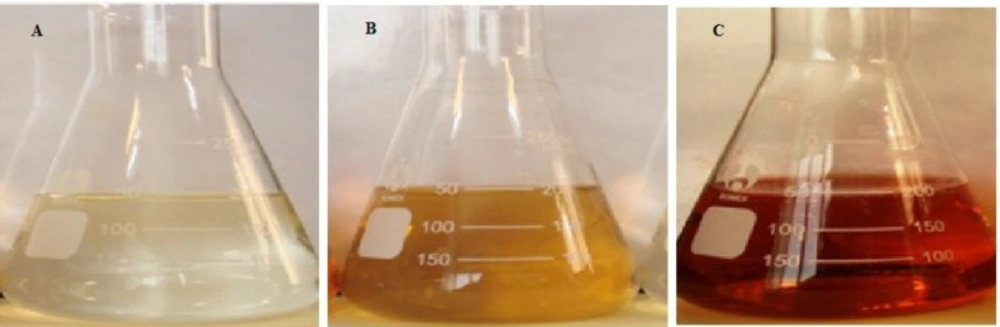
Zm-Ag.NPs was synthesized by reducing 10 mL of silver nitrate solution (1-5 mM) with 100 to 1000 µL of the Z. multiflora leaf extract. Change in the color of the solution from pale brown to dark brown indicated the formation of nanoparticles. This process was carried out at a temperature of 40 °C and at pH 7.0. In order to eliminate any free biomass residue or unbound extract from the surfaces of the nanoparticles, the Zm-Ag.NPs was centrifuged and repeatedly washed with distilled water. Subsequently, the product was centrifuged at 9000 rpm for 30 min and dried at 45 °C.
Characterization methods
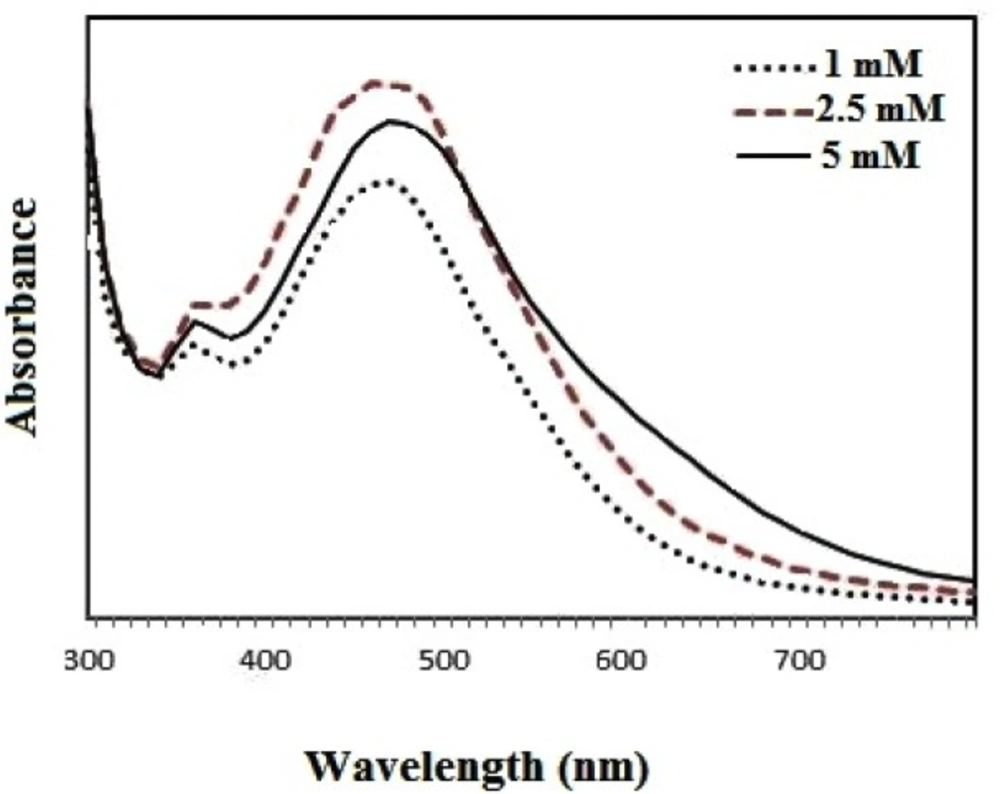
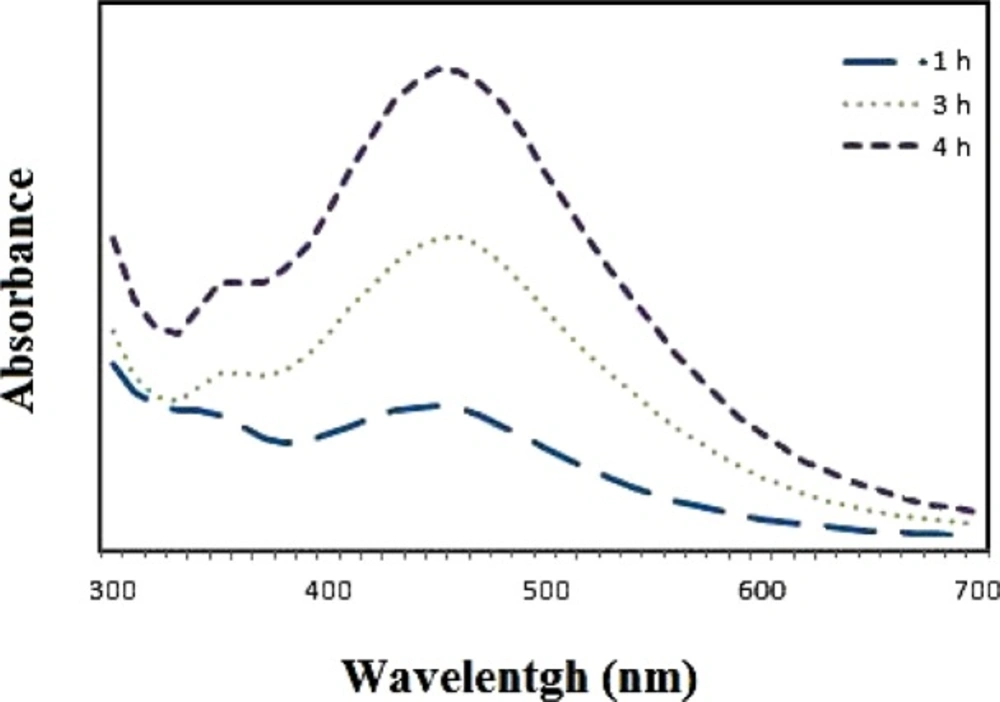
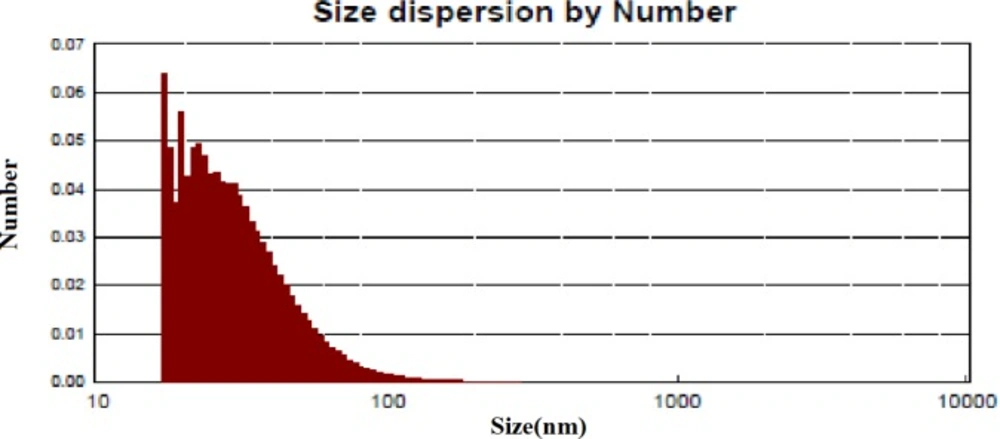
The UV-visible absorption spectra of the samples were measured in different concentrations of the plant extract and silver nitrate and at different time intervals using a spectrophotometer (Biotek Epoch, US). For analysis of UV-visible spectra, 100 µL of the sample was put in a 96-well plate and read. The size of the nanoparticles was determined using DLS/zeta potential analysis (Cordovan, Vaso particle, France).
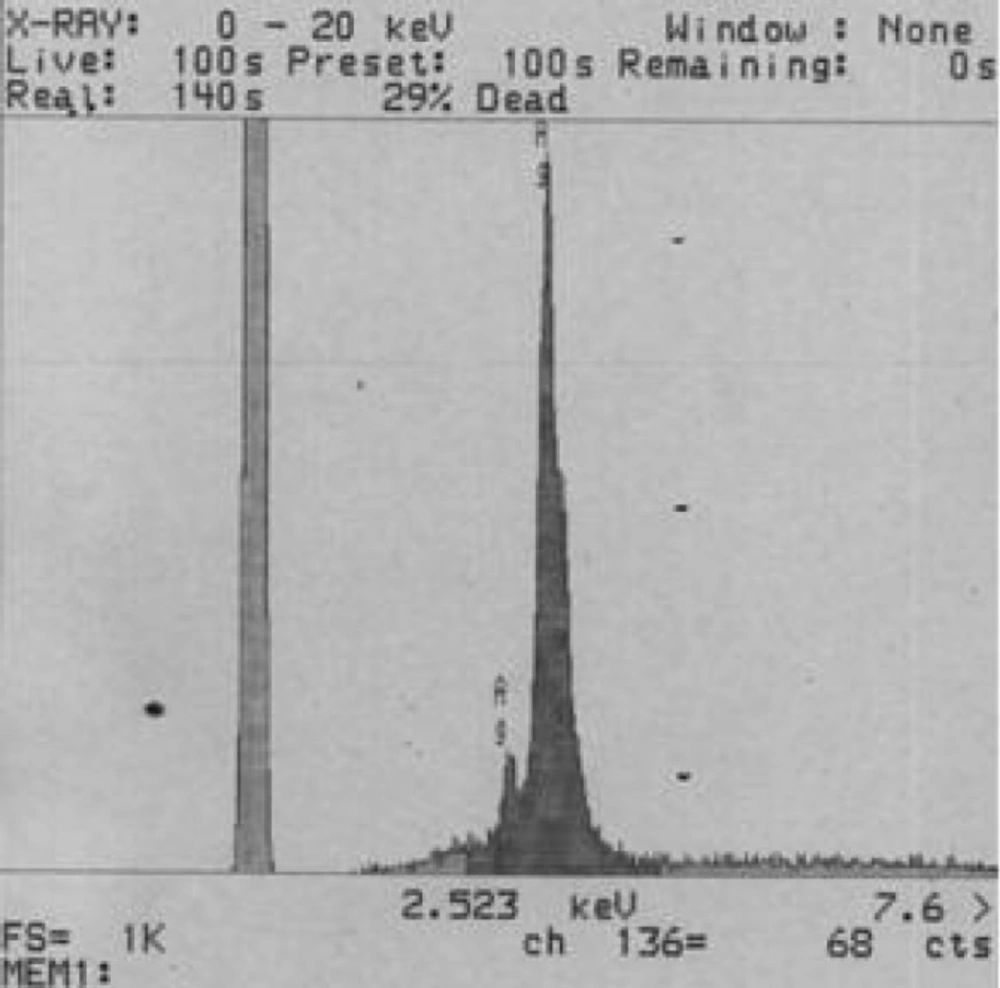
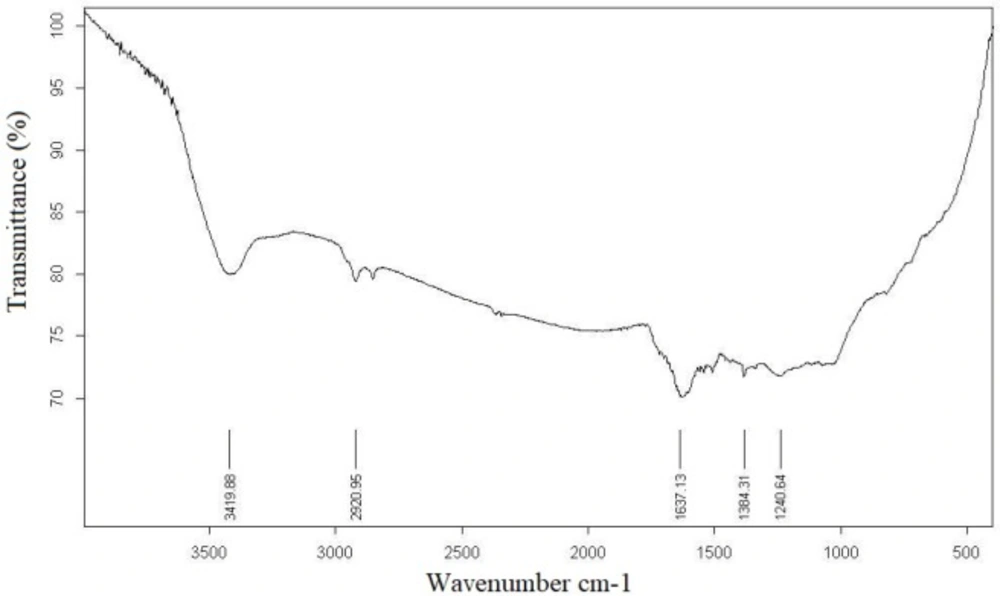
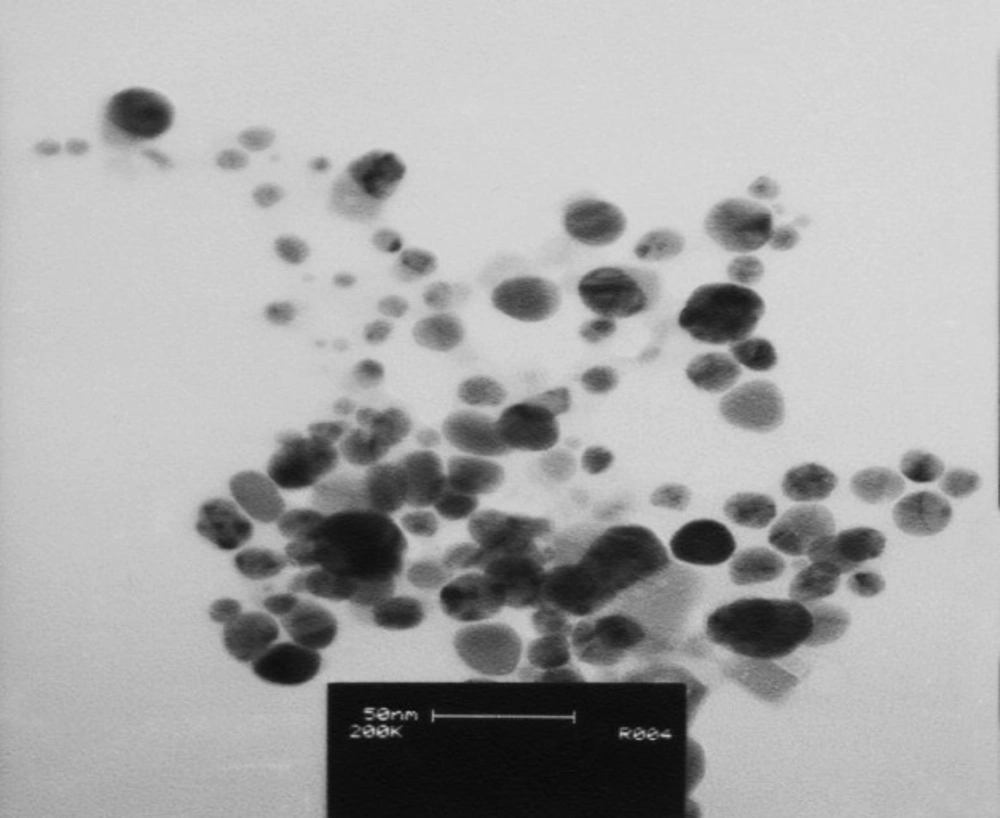
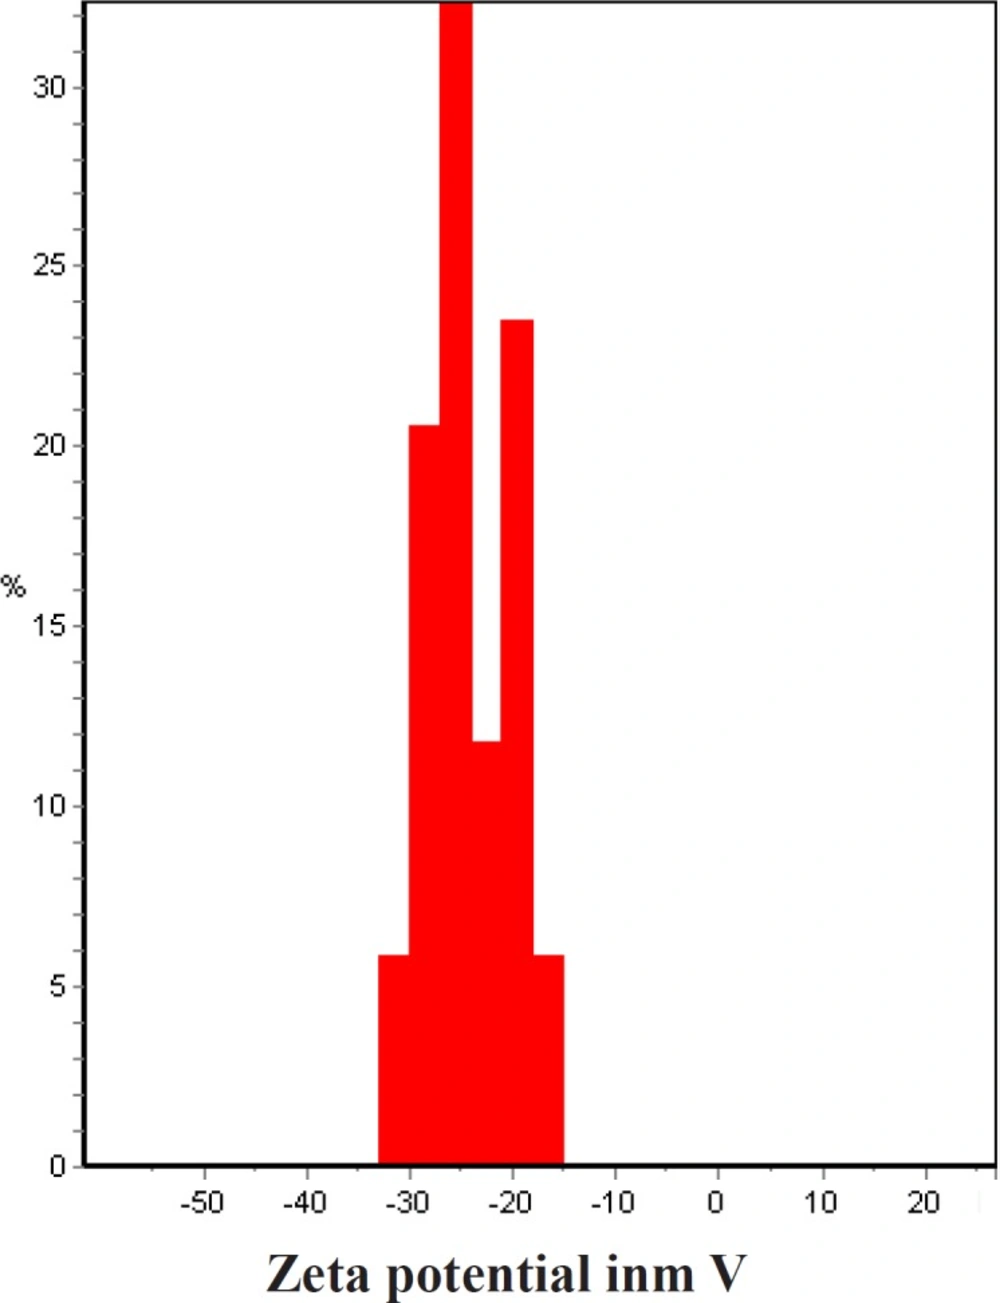
The best sample base of the UV-visible results was selected for the DLS study. DLS was applied to assess the size of Zm-Ag.NPs at 25 °C using 0.894 cp for the viscosity of the medium, and a fixed angle = 90 for the avalanche photo diode (APD) detector and a wavelength of 657 nm for the 50 mW laser zeta-potential of Zm-Ag.NPs in water, were evaluated using CAD (Zeta compact, France) zeta sizer. The TEM results (CM-120, Philips) were obtained by depositing a drop of the best sample, based on the DLS results, on a copper mesh coated with a carbon film; the solvent was then evaporated. The size dispensation was obtained by image analysis using the Image J software package 24, counting at least 200 particles for significant and relevant statistics. The FTIR for the leaf of the plant extract and Zm-Ag.NPs was obtained in the range of 4000 to 400 cm.−1 with a Perkin Elmer spectrophotometer paragon 1000. The dried Zm-Ag.NPs sample was placed on a coated carbon film and examined using EDS analysis (In Ca, UK).
Cell culture assay
MTT assay
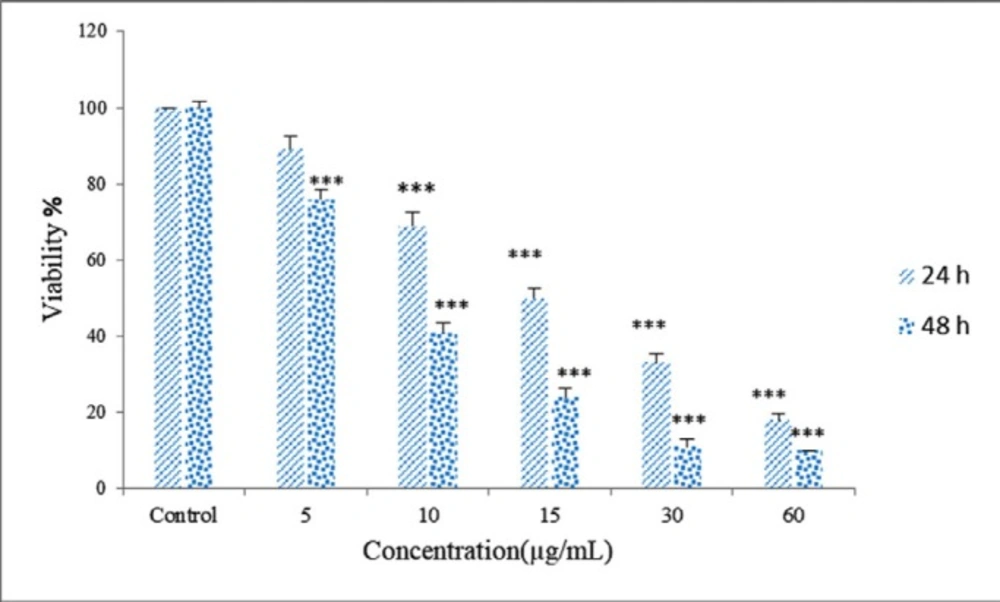
About 5×10⁴ HeLa cells were seeded in a 96 well-plate. After 24 h the cells were treated with 5-60 µg/mL Zm-Ag.NPs for 24 and 48 h, at which point, the culture media was aspirated off, and 20 µL of the MTT solution (5mg/mL) was added, before being incubated for 4 h in a cell incubator (37 °C, 5% CO2). After this, the MTT solution was aspirated off from the wells.
The formazan (MTT metabolic product) was resuspended in 200 µL isopropanol, and a 96-well plate reader was used to read the absorbance at 570 nm. The cell viability was calculated using the following equation:
Where A treated and A control are the absorbance of the treated and untreated cells, respectively (
13)
DAPI staining
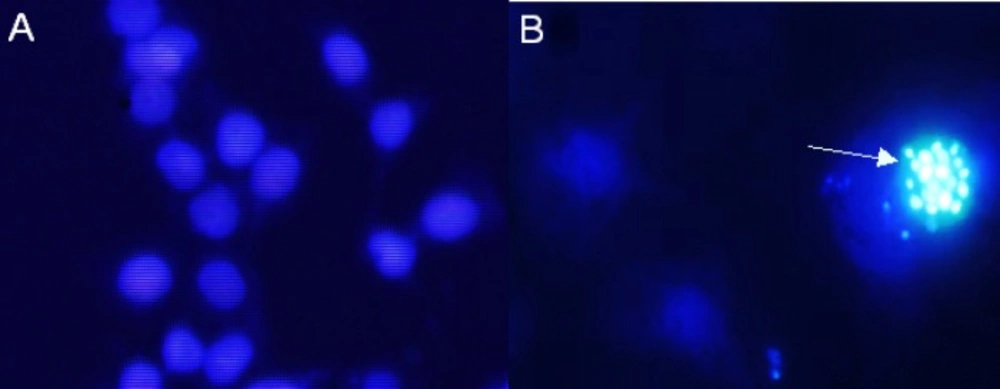
The cells were cultured by adding approximately 5×10³ on gelatin-coated coverslips placed on tissue culture previously. The cells were treated with 15 µg/mL Zm-Ag.NPs. After 48 h 200 µL of 4% paraformaldehyde was added to the fixed cells and incubated for 20 min at room temperature. The wells were washed twice with PBS, stained with 100 ng/mL DAPI for 510 min and finally, washed with PBS, then observed using fluorescence microscopy with DAPI.
Acridin orange – propidium iodide (AO/PI) staining
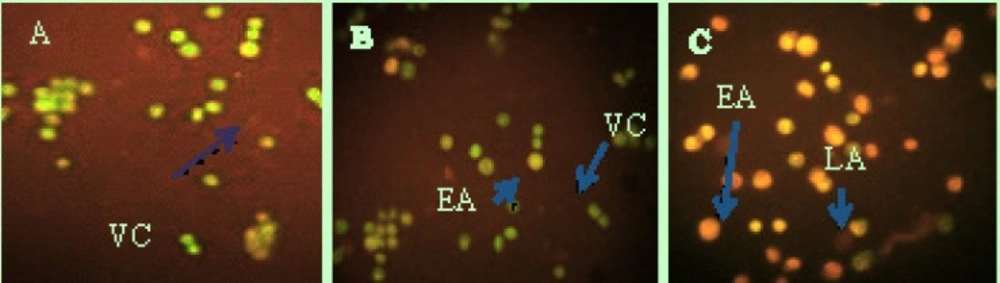
The seeded HeLa cells were treated with 10 and 20 µg/mL for 48 h. For the AO/PI staining, the cells were harvested and re-suspended before 10 µL of the treated cell sample, 10 µL of the AO staining solution and 10 µL of PI staining solution were combined. Then, 10 µL of the stained sample was added to a Cellometer Counting Chamber and analyzed using fluorescence microscopy (Biomed, Korea).
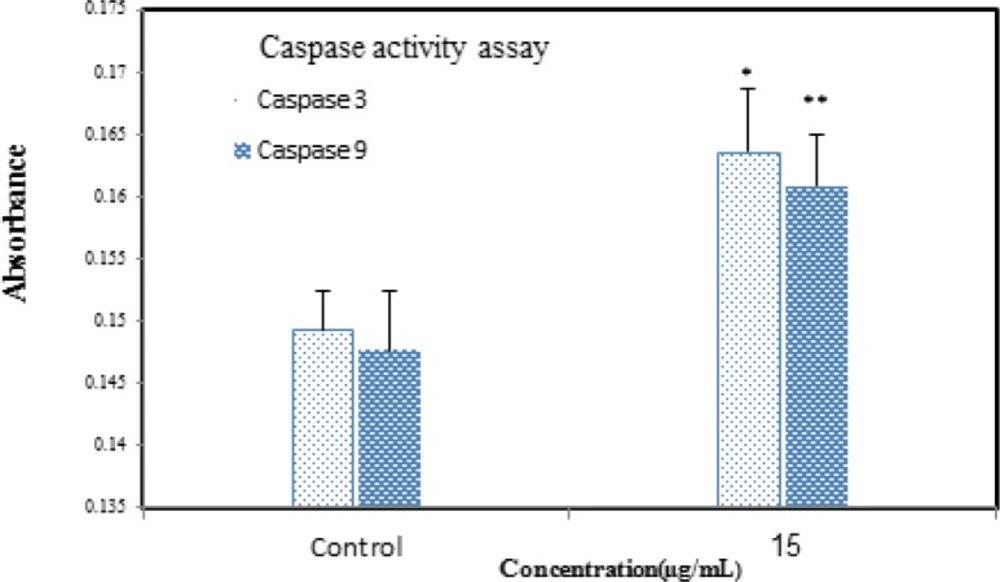
Caspase activation assay
Caspase-3 and 9 activities were assessed using the colorimetric protease assay Abcam Kit following the protocol of the manufacturer. Briefly, the cells were treated with Zm-Ag.NPs. Apoptosis was induced in the cells treated with Zm-Ag.NPs for 24 h. After this, the 1-5 × 10⁶ cells were pelleted and re-suspended in 50 μL of chilled Cell Lysis Buffer, before centrifuging for 1 min. The protein concentration was assayed using the Biuret method. For each assay, 100 μg proteins were diluted with 50 μL Cell Lysis Buffer. Finally, the DEVD-p-NA substrate was added and the samples were read at 400 or 405 nm using a microtiter plate reader (Epoch, US). The fold-increase in Caspase 3 activity was determined by comparing with the control groups.
Annexin: Determination of apoptotic and necrotic cells
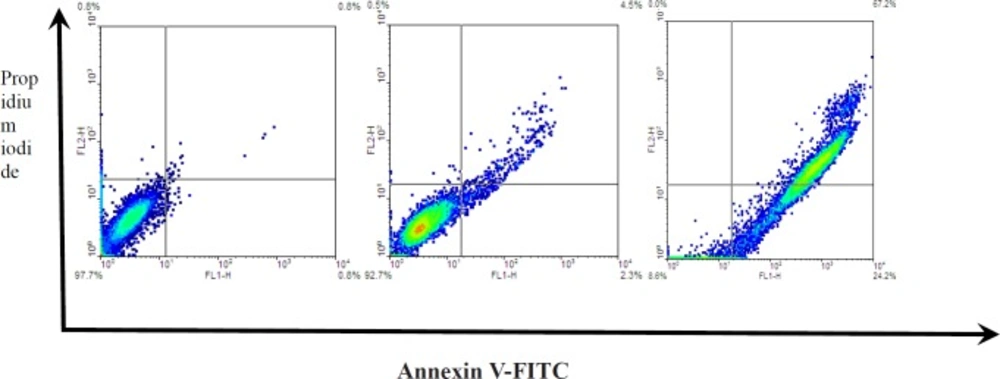
The amount of apoptotic specific hallmark externalization of PS on the HeLa cell surface was assessed using the Annexin-V-FITC staining kit (Abcam), Mannheim, Germany, according to the manufacturer’s instructions. The cells were tested with 10 and 20 µg/mL Zm-Ag.NPs for 48 h before harvesting and centrifuging at 200 xg for 5 min. Then, 5 µL Annexin- V-FITC labeling and 5 µL PI solution were added, before incubating for 5 min at 25 °C and analyzing using a flow cytometer (Bd, UK).
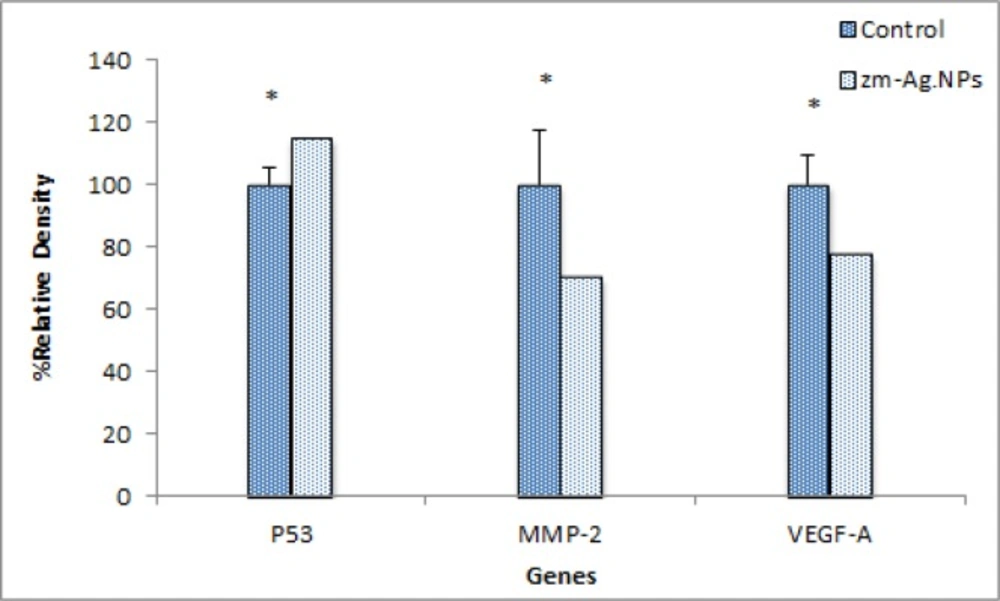
Gene expression analysis
Changes in the expression of VEGF, MMP, and P-53 genes were analyzed using RT-PCR. Briefly, the total RNA of the treated MCF-7 cells was isolated using the High Pure RNA Isolation kit according to the manufacturer’s protocol (Roche, Germany). Then, the cDNA was synthesized using the ParsTous Kit, incubated at 65 °C for 5 min followed by the addition of the RT premix.
The temperature of the synthesis was according to the protocol: incubation at 65 °C for 5 min followed by the addition of the RT premix, then incubation at 25 °C for 10 min, 50 °C for 60 min and 70 °C for 10 min. Finally, 2 µL of the cDNA produced was added to the 10xbuffer, MgCl2 25 mM, dNTP, Taq DNA polymerase and the appropriate forward and reverse primers. Ultimately, RT-PCR was performed: 1 cycle at 95 °C/4 min, 35 cycles at 94 °C/30 s for denaturation, 57 °C/30 s for annealing, 72 °C/30 s for extension, and 1 cycle of 5 min at 72 °C. The primers were used as follows:
The PCR products were observed by electrophoresis in a 2% agarose gel, read using a UV-detector and semi-quantitatively measured from the UV optical density of bands using ImageJ software.
Statistical analysis
Statistical assessment of the data was performed using ANOVA one-way analysis. The Tukey test was applied for comparisons as a posttest with the help of SPSS software, and the results are shown as mean ± SD, and p < 0.05 was calculated as the minimum level of significance.