Animal material
Marine sea pen Virgularia gustaviana was collected by patrolling on the intertidal zone of the estuary Sura in Bandar Abbas city, south of Iran (Persian Gulf). The collected animals were immediately frozen, transferred to the lab and kept in -20 °C.
Obtaining ethyl acetate extract and separation of chemical fractions
In order to obtain organic extract, the frozen sea pen (1 kg, wet weight) was chopped into small pieces and freeze-dried (
13). Then, ethyl acetate (EtOAc) solution (Merck, Germany) was added to the powdered samples and the resultant mixture was shaken for three days in room temperature (three separate amount of ethyl acetate were added up to totally 2 litters). After that, the resultant ethyl acetate extract was filtered using Whatman filter paper (125 mm), and the organic phase of filtered solution was extracted using distilled water (
14). Finally, the solvent was removed by evaporation using rotary evaporator. In the next step, the crud extract of sea pen was subjected to column chromatography on silica gel column (6 × 120 cm, 230–400 mesh; Merck, Germany) and eluted with
n-hexane-EtOAc (gradient separation 10:0 to 0:10) (15). The result of column chromatography was 10 different fractions (labelled from A to J), primarily characterized by thin layer chromatography (TLC) method using pre-coated Kieselgel 60 F254 (0.25 mm, Merck, Germany) (
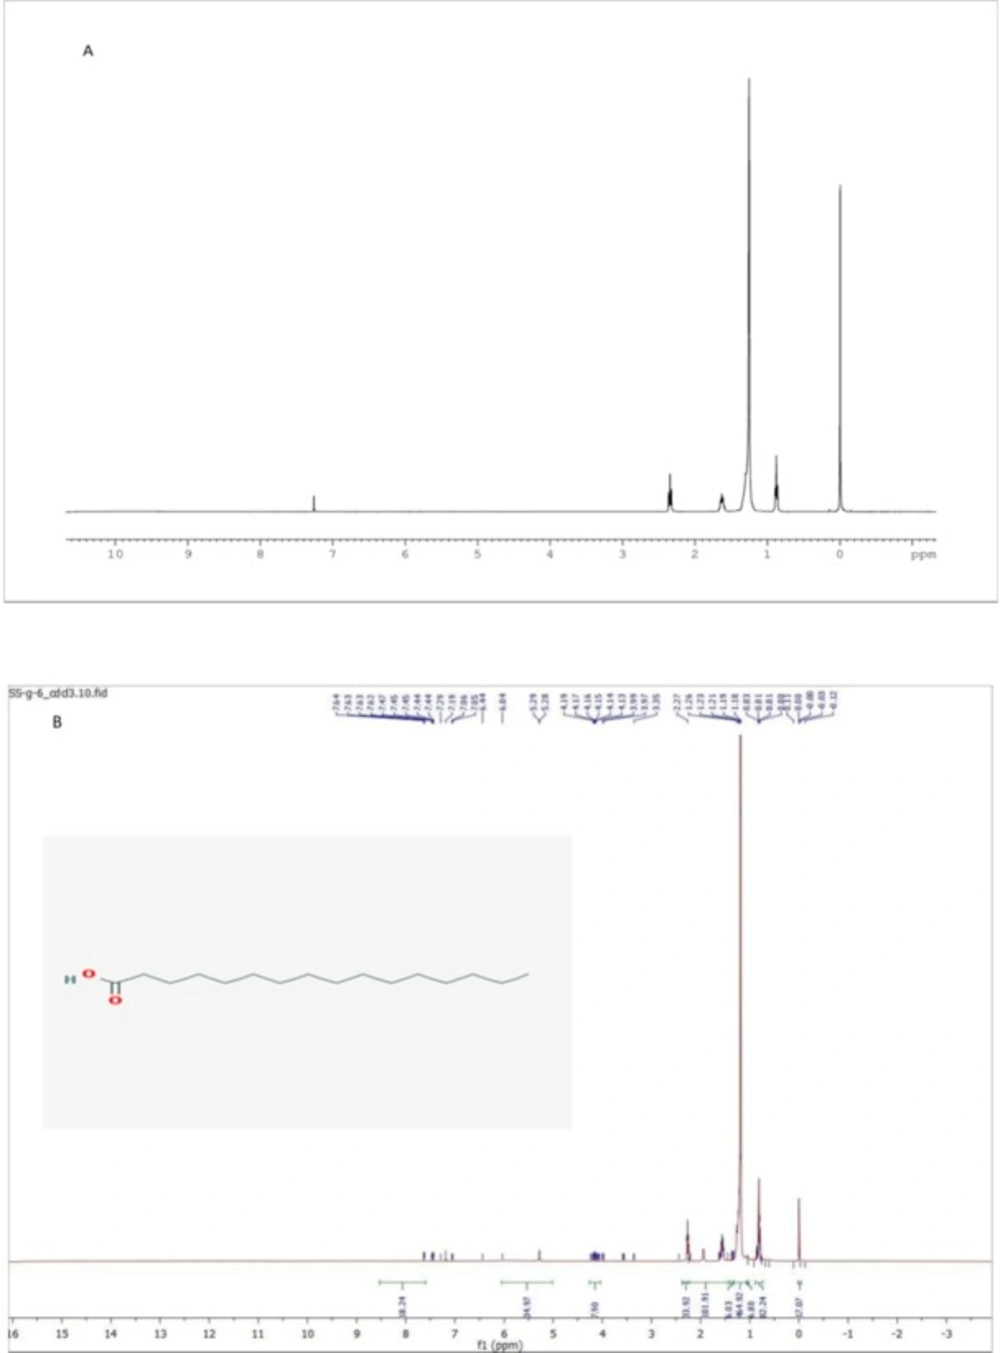
12). Fraction G (2.5 g) was subjected to silica gel flash column chromatography using Hexane-Dichloromethane-Methanol (1:1:0.5), as a mobile phase. Sub fraction of G6 was collected and re-crystallized.
Sub fraction G6: white powder; mp 62.9 °C; 1H NMR (CDCl3, 400 MHz) δ: 2.34 (2H, t, J = 8.0 Hz, CH2), 1.63 (2H, t, J = 8.0 Hz, CH2), 1.26 (s, -(CH2)n-), 0.87 (3H, t, J = 8.0 Hz, CH3). DEPT-Q (CDCl3, 100 MHz) δ: 14.11 (CH3), 22.69 (CH2), 24.70 (CH2), 29.07 (CH2), 29.24 (CH2), 29.36 (CH2), 29.44 (CH2), 29.59 (CH2), 29.65 (CH2), 29.67 (CH2), 29.68 (CH2), 31.92 (CH2), 34.05 (CH2), 179.60 (q).
The other fractions and sub fractions need purification, so biological test such as MTT assay and immunocytochemistry and also chemical evaluations of fractions G, I, and J was assessed in this study.
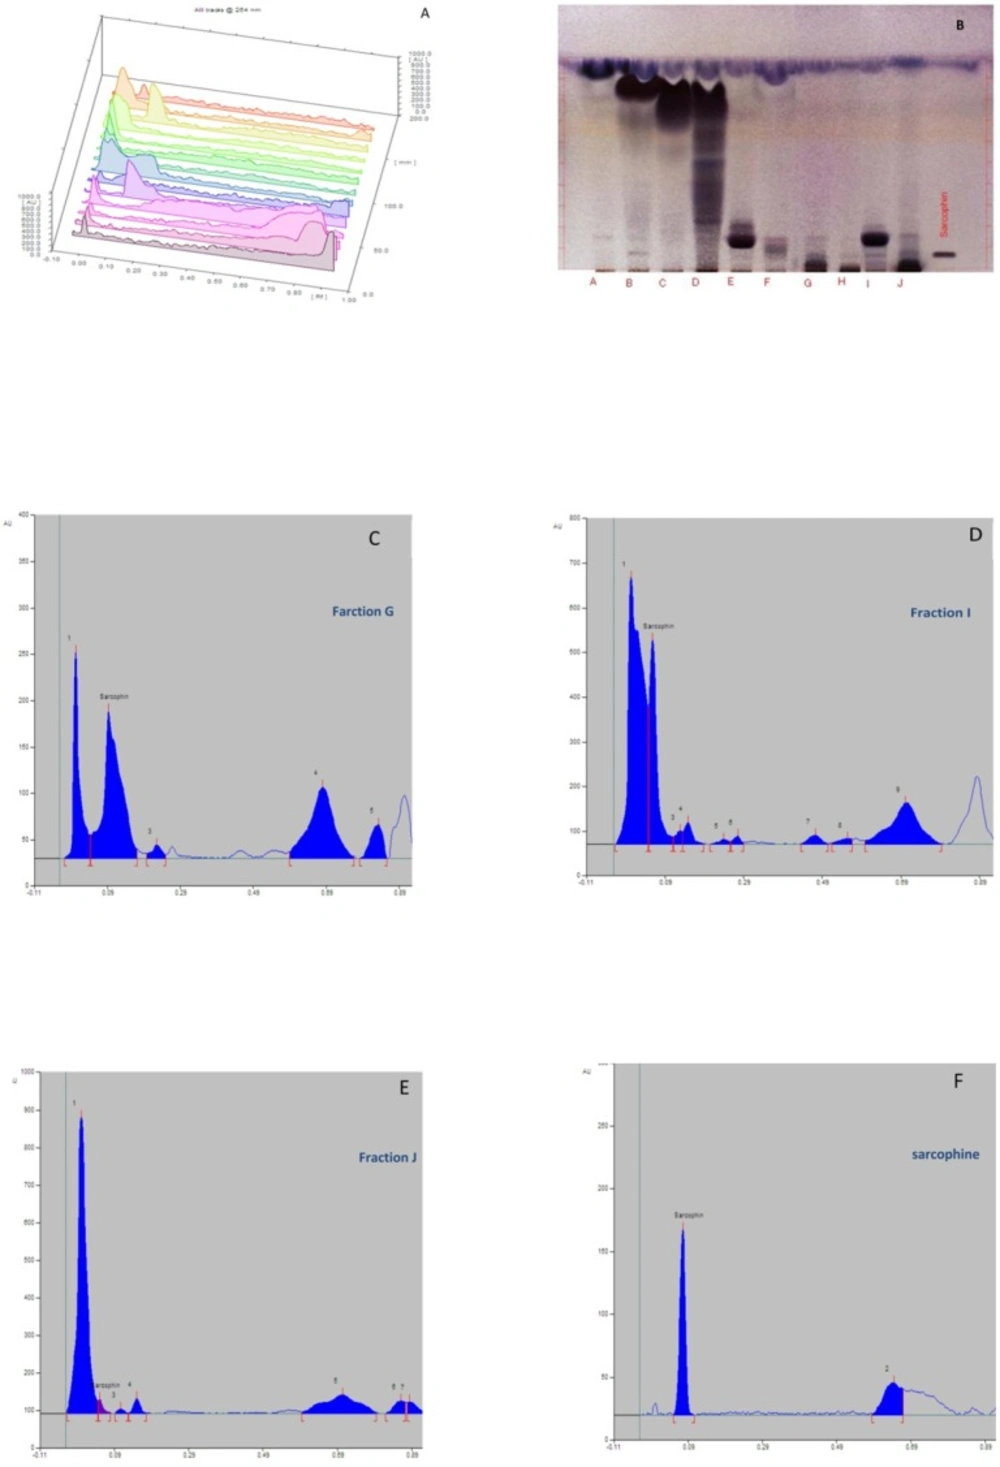
High performance thin layer chromatography (HPTLC)
HPTLC is a method, which is usually employed to obtain a chemical fingerprint of a natural compound. The samples were applied on HPTLC plate (Silica gel 60 F 254 glass 20 × 10 cm, Merck, Germany), and the EtOAc-n-hexane (1:10) was used as mobile phase. Fifty µL of each fraction was loaded in plates. Commercially available Sarcophine (Abcam, UK) was used as positive control (1 µL sample). The resultant bands were detected by vanillin immersion and sulphuric acid spraying followed by heating to 120 °C for 5 min.
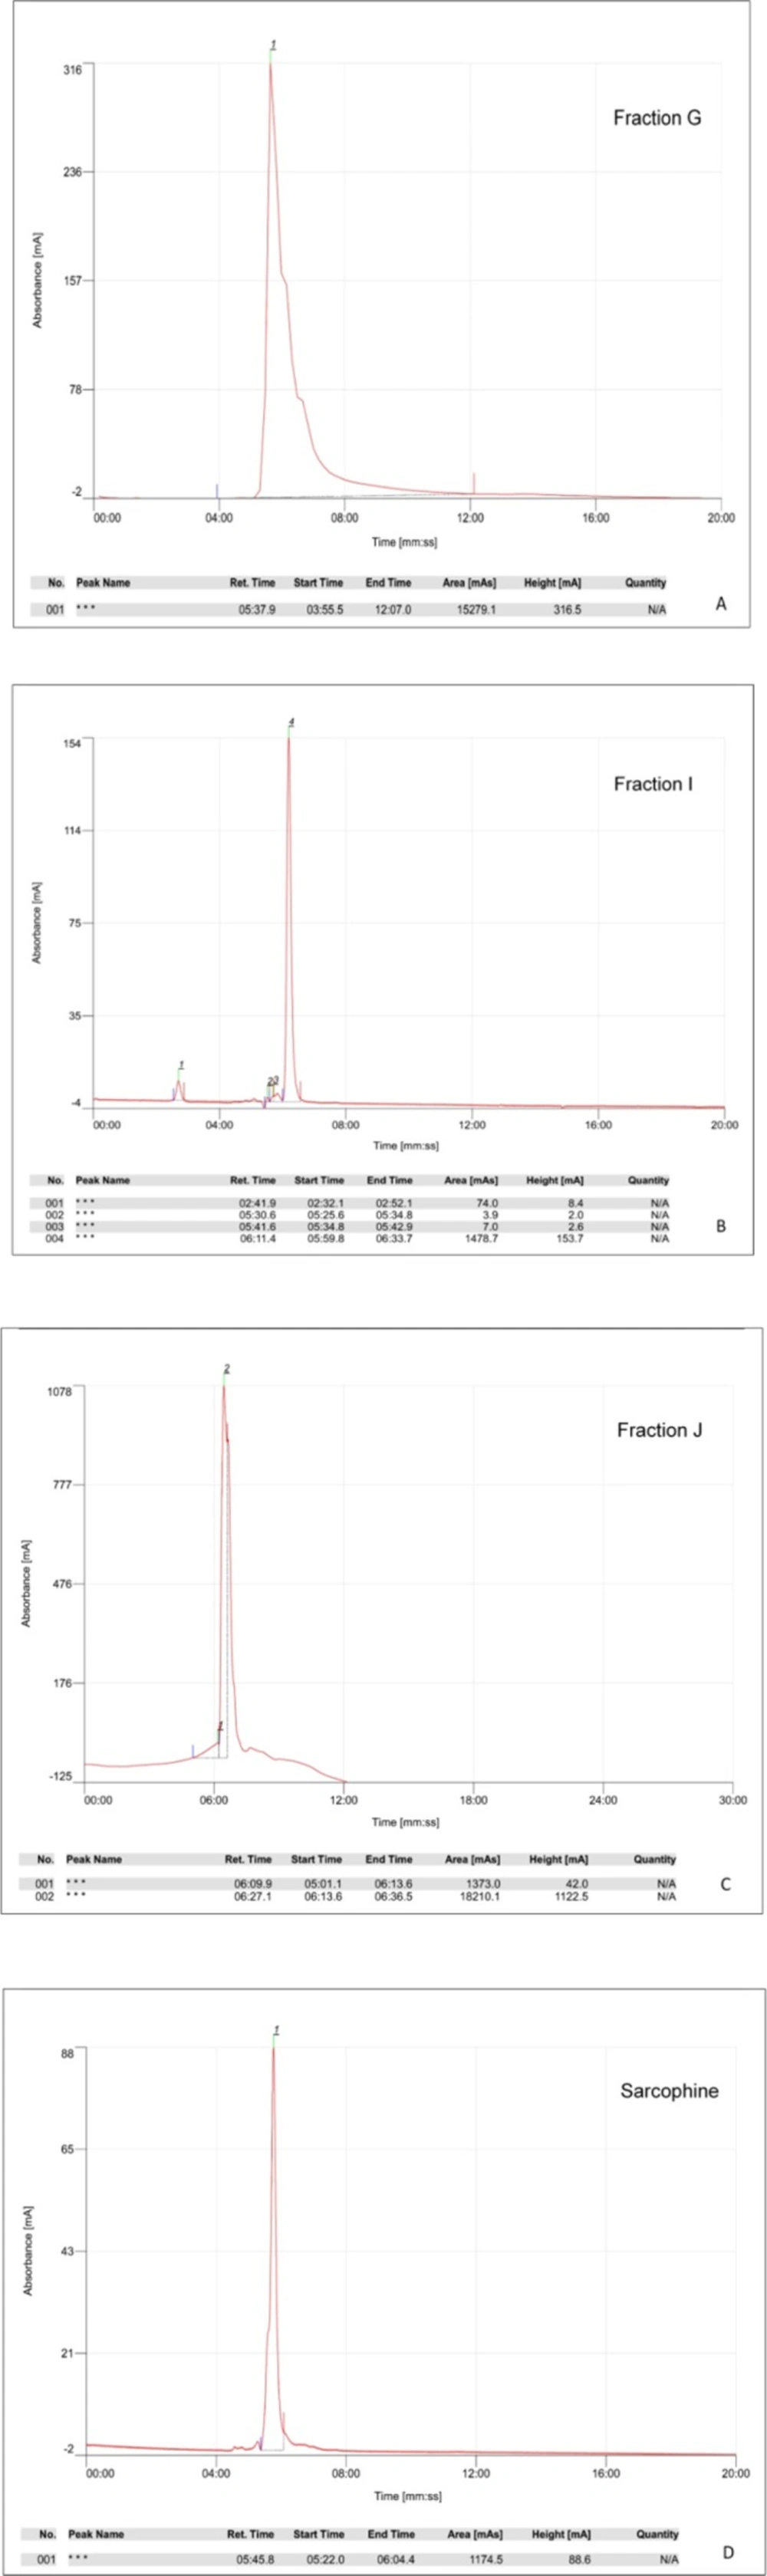
High performance liquid chromatography (HPLC)
The retention time of each fraction and commercial Sarcophine was measured using HPLC (Cecile, UK) and normal phase column (Hibar 250 × 10 mm, silica gel 60, 5 μm, Merck, Germany). The best results were obtained by utilizing the mobile phase consisting Methanol-Deionized water (pH 3.5 adjusted with phosphoric acid) with 60:40 v/v ratio, and flow rate of 1.5 mL/min. The highest absorbance was in 220 nm (
16).
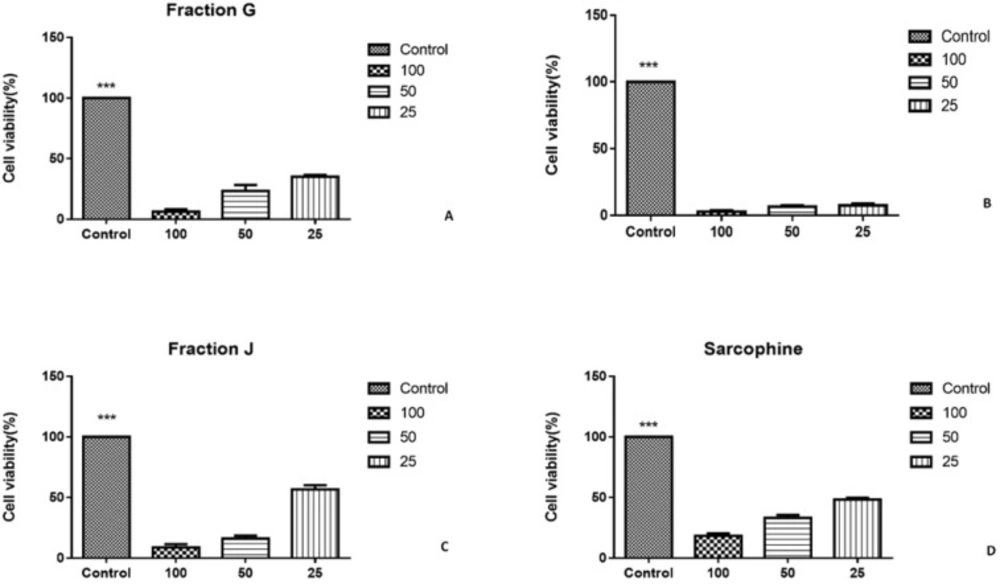
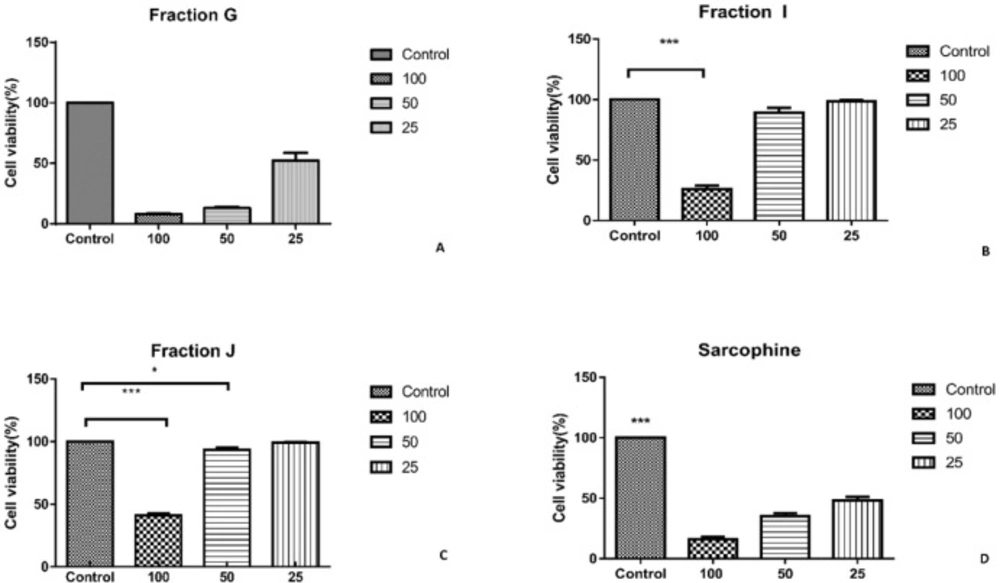
Cell culture and Cytotoxicity assay
The cytotoxic effect of each fraction was evaluated using HeLa and MDA-MB-231 cancer cell lines. The cells were cultured in RPMI 1640 (Sigma, USA) supplemented with 10% fetal bovine serum (Sigma, USA) and 1% penicillin/streptomycin (Sigma, USA), and incubated in humidified air containing 5% CO
2 at 37 °C (
17). After reaching 75% confluence, the cells were detached using Trypsin/EDTA and sub-cultured in 24-well plates (5 × 10
4 cell/well) for 24 h in 5% CO
2 at 37 °C overnight. To evaluate the cytotoxic effect of each sample, 1 mg of each fraction wasdissolved in 1 mL dimethyl sulfoxide (DMSO, Merck, Germany), and diluted with RPMI (1:9 v/v). Then, the prepared solution from each fraction was added in concentration of 25, 50, and 100 µL for each well. The cells cultured without treatment and the cells treated with Sarcophine were considered as negative and positive controls, respectively. The plates were incubated in 5% CO
2 at 37 °C for 24 h until cytotoxicity assay was performed (
18).
The viability of cancer cells was investigated using 3-(4,5-dimethylthiazol-2-yl)-2,5-diphenyl tetrazolium bromide (MTT) assay. MTT solution (5 mg of MTT/mL of distilled water) was filtered and added to each well (40 µL/well). Then, the plates were incubated for 4 h in 5% CO
2 at 37 °C. After that, the formosan crystals were dissolved in 900 µL DMSO per each well. Finally, the optical absorbance was measured at 570 nm using spectrophotometer (CE7500; Cecil, Cambridge, UK) (
17).
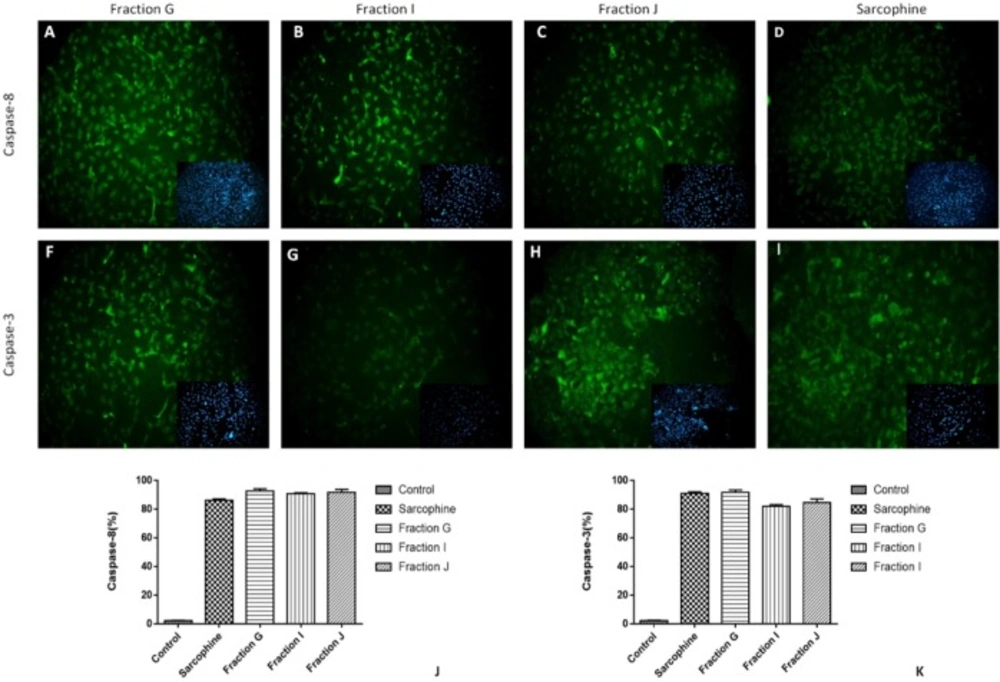
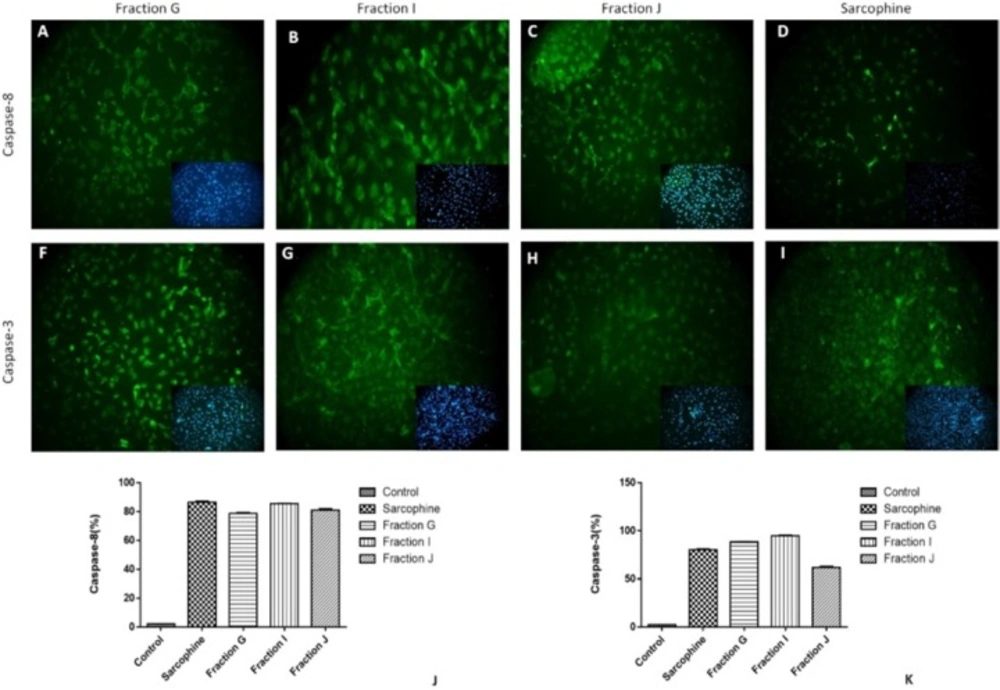
Immunocytochemistry
The expressions of caspase-3 and caspase-8 (apoptosis markers) in cancer cells treated with 100 µL of fractions G, I, and J were evaluated using immunocytochemistry. We have chosen the cells treated with these three fractions due to their highest cytotoxicity among obtained fractions. To perform immunocytochemistry, the cells were fixed with 2.5% paraformaldehyde for 30 min at room temperature followed by several washing with PBS. Then the samples were incubated with 10% bovine serum albumin (Sigma-Aldrich) for 30 min. Next, permeabilization of the fixed cells was achieved by using 0.2% Triton X-100 (Sigma-Aldrich) for 30 min. After that, the cells were incubated with primary monoclonal antibodies including anti-caspase 3 antibody (1:300, Cell Signalling, USA) and anti-caspase 8 antibody (1:100, Cell Signalling, USA) in humidified environment at 4 °C for an overnight. After washing with cold PBS, the secondary goat anti-rabbit FITC antibody (1:500, Abcam) was applied for 2 h at room temperature (
18,
19). Isotype-matched rabbit IgG antibody was applied instead of primary antibodies as negative controls. The nuclei of cells were also stained by 4,6- diamino-2-phenylindole (Sigma-Aldrich) (
18).
For quantitative analysis of expressing caspase-3 and caspase-8 in treated cells, the number of positive cells in each sample was counted using computerized software (ImageJ, National Institutes of Health, Bethesda, Maryland).
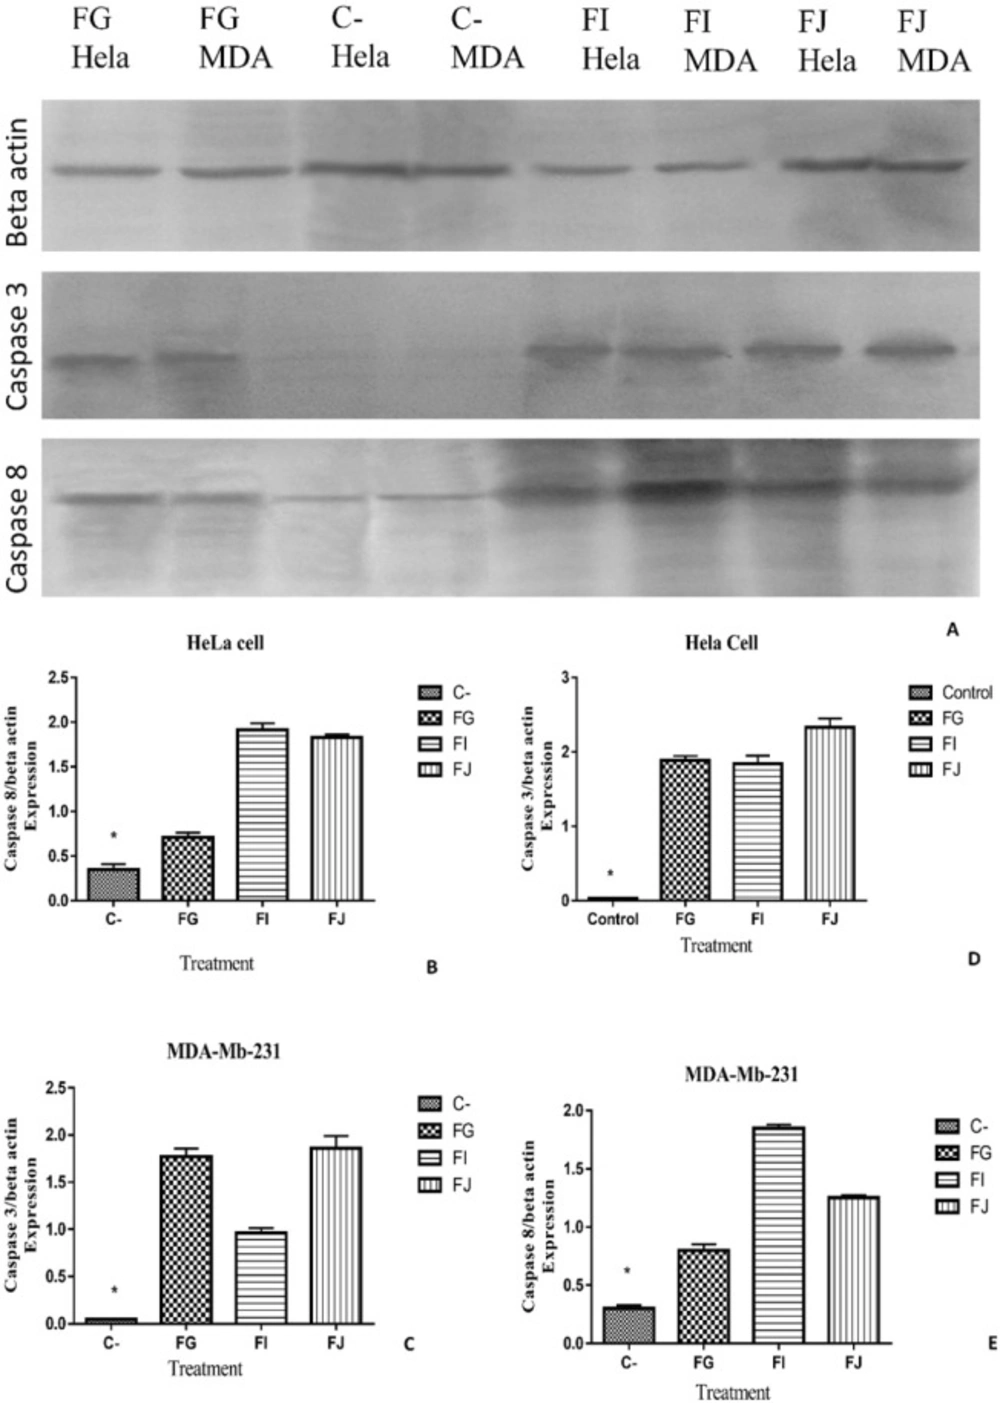
Western blot analysis
HeLa and MDA-MB-231 cells were lysed in lysis buffer containing 125 mM Tris-HCL (pH 6.8), 10% v/v β-Mercaptoethanol, 10% glycerol, 4% SDS, and trace amount of bromophenol blue.
Depending on protein concentration (measured based on Bradford assay), the cell lysates were diluted in RIPA buffer to the gel-loading concentration of proteins (2.5 μg/μL), mixed with equal volumes of sample buffer. Protein samples were separated using a protein electrophoresis. The proteins separated by SDS-PAGE were blotted onto nitrocellulose membrane for 3 h using a blotting apparatus (Bio-Rad). The membrane was blocked with 5% non-fat dry milk or 5% BSA in TBS for 20 min and incubated with the primary antibodies anti-caspase 8 antibody (1:100, Cell Signaling, USA) and anti-caspase 3 antibody (1:300, Cell Signaling, USA) at 4 °C overnight. After the incubation, the membrane was washed three times (5 min each time) with TBS containing 0.1% Tween-20. Then, it was incubated for 2 h with the corresponding horseradish peroxidase-conjugated secondary antibody (Santa Cruz Biotechnology, Santa Cruz, CA, USA). The membrane was finally washed and the band signals of the interesting proteins were normalized by Beta actin (ab8227 Abcam) and Chemiluminescence signal was detected. The relative band intensities of blots were measured using the ImageJ software.
Statistical analysis
All data were expressed as mean ± standard error of mean. The statistical analysis was performed using one-way analysis of variance (one-way ANOVA) with Tukey post-test. A P-value less than 0.05 was considered statistically significant.