Materials
Poly (d,l-lactic-co-glycolic acid) (PLGA) with co-polymerization ratio 50:50 (lactic/glycolic), Polyvinyl alcohol (PVA) Mw ≈ 130,000, curcumin, 3-(4, 5dimethylthiazol-2-yl)-2, 5-diphenyltetrazolium bromide (MTT), dimethyl sulfoxide (DMSO), and DAPI (4′, 6-diamidino-2-phenylindole) were purchased from Sigma (Steinheim, Germany). Dulbecco’s Modified Eagel Medium (DMEM), Chloroform, ethanol, fetal bovine serum and Annexin V-FITC/propidium iodide assay kit were obtained from Gibco, Invitrogen (Carlsbad, CA, USA). Primary and secondary antibodies were purchased from Santa Cruz Biotechnology (Santa Cruz, CA, USA).
Preparation of NCur
Curcumin loaded PLGA nanoparticles were prepared by solvent (s/o/w) evaporation technique. Briefly, 60 mg of the PLGA were dissolved in 1 mL chloroform as an oil phase (organic solution). Free Cur (6 mg) was added to the PLGA/chloroform solution and sonicated to produce the s/o primary emulsion. To form the final s/o/w emulsion this emulsion was then added to a solution of 2% PVA and ethanol (1:1) and again was sonicated at 55 W for 2 min. To evaporation (remove the organic phase) of solvent (chloroform) s/o/w emulsion was sonicated and agitated by stirrer for 5-6 h. The sample was then centrifuged at 15000×g for 10 min and washed 2-3 times with distilled water. It was then freeze dried for 24 h to obtain the dry powder. The nanoparticles were stored at 4 °C for further use (
16,
21).
Characterization of NCur
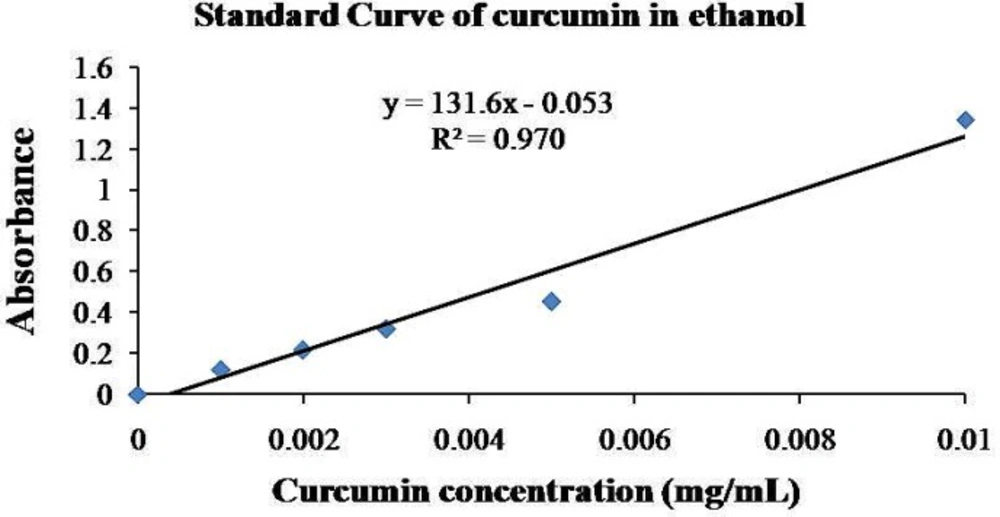
For characterization of NCur, encapsulation efficiency and particle size of the nanoparticles were determined. The encapsulation efficiency of the nanospheres was determined by analyzing the supernatant of the final emulsion once the nanospheres were removed from it by centrifugation at 15000×g for 15 min. For the estimation of Cur present in the supernatant, the absorbance was measured spectrophotometrically at 425 nm and the amount of drug present was calculated from calibration curves of concentration versus absorbance with known standards of the drug. Encapsulation efficiency (EE %) and Cur loading were calculated using below formula (
16,
21).
Amount of Cur in the nanoparticles = Total amount of Cur- free Cur
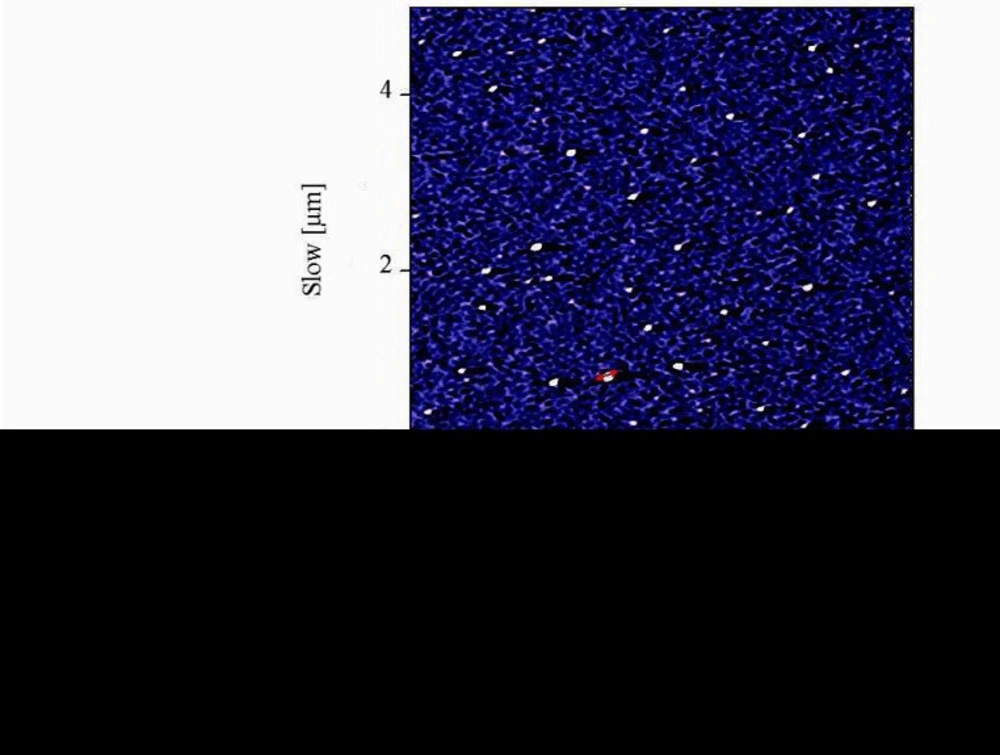
Atomic force microscopy (AFM) method was used to determine the size and morphology of the synthesized NCur.
Experimental design
The human PC3 cell line was purchased from Pasteur Institute of Iran. PNT2 cell line (Normal human prostate epithelium) was purchased from sigma (Cat number: 95012613). Control group was untreated cells. Experimental groups were treated by 25 μg/mL of Cur and 25 μg/mL of NCur for 48 h, respectively. The dose of NCur was selected based on the results of previous studies (
16) and our pilot study. Briefly, before the experiment, we examined different doses of NCur (1, 5, 25 and 50 µg/mL) for 24 and 48 h to determine the best one for anticancer action and 3 flasks were used for each dose. By using MTT assay, the percentage of viable cells was significantly decreased at the concentration of 25 and 50 µg/mL (results not shown). There was no significant difference between concentration of 25 and 50 µg/mL. Thus, we used Cur and NCur at the dose of 25 µg/mL in this study. Prior to beginning each test, manual cell counting by using a Hemacytometer was performed in order to standardize cell concentration between samples to minimize error and variation in downstream results (
22).
MTT assay
MTT(3-(4,5-Dimethylthiazol-2-yl)-2, 5-diphenyltetrazolium-bromide) assays were used to compare the effect of NCur with Cur on cell viability and proliferation as previously described (
23). Briefly, PC3 and PNT2 cells were seeded in 96-well plates (1 × 10
4 cells/well). After treatment, the cells were maintained with culture media for 48 h. MTT (0.5 mg/mL) was then added to each well, and cells were further incubated for 4 h at 37 °C. Supernatants were then removed, and 700 µL of DMSO were added to each well to dissolve the formazan product. Absorbance at 540 nm was measured using a microplate reader (BioRad, Hercules, CA). Optical density values of the control cells were calculated as 100% viability. Because absorbance is in proportion to the number of living cells in a sample, the MTT assay reflects the extent of cell proliferation (
24).
DAPI staining
The PC3 and PNT2 cells (10
4 cells/mL) were grown on cover slips after treatment with NCur or Cur for 48 h. Nuclei changes of apoptosis were assayed by DAPI (4,6-diamidino-2-phenylindole) staining as previously described (
25). Following washed with PBS, the cells were fixed with cold methanol/acetone for 5 min at room temperature, washed with PBS, and then incubated with DAPI solution (2 mg/mL in PBS) for 10 min at room temperature. Fluorescence images were captured using a fluorescence microscope (Olympus, Japan).
Immunocytochemistry
The PC3 and PNT2 cells (10
4 cells/ mL) after treatment deposited on a glass cover slip were fixed for 15 min in 4% paraformaldehyde in PBS at 4 °C. Nonspecific binding was blocked with 1% bovine serum albumin-PBS for 15 min. Anti-LC3-II antibody (sc-16755, Santa Cruz) at 1/100 dilution was applied overnight at 4 °C. After two washes with PBS, the sections were incubated with FITC-conjugated anti-mouse secondary antibody (sc-2356, Santa Cruz) for 1 h at room temperature. After washing, the cells were incubated with DAPI at dilution 1: 1000 in PBS for 10 min. Fluorescence images were captured using a fluorescence microscope (Olympus, Japan). The percentage of LC3-II positive cells was calculated by dividing the number of LC3-II positive cells in a randomly microscopy field by the total number of cells in that field, and the result was multiplied by 100. There were at least 3 slides for different groups. Ten randomly field were evaluated for each slide (
26).
Standard curve of Cur-loaaded PLGA nanosphers. The loading was found to be 97%.
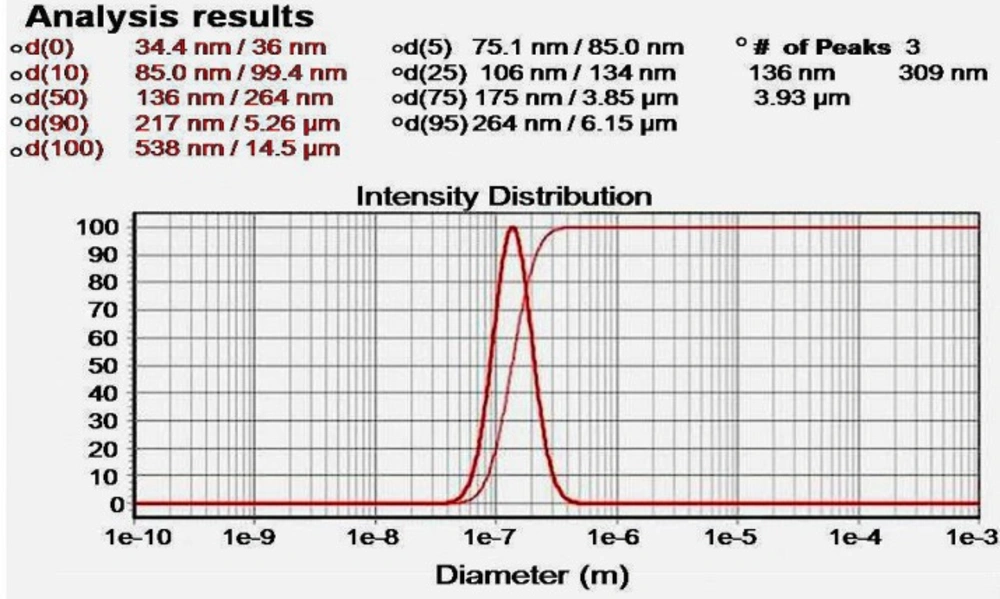
Particle size distribution of Cur-loaaded PLGA nanosphers. The mean particle diameter was found to be 136 nm.
AFM image of nanoparticles showed distinct spherical particles in size range between 100 and 200 nm.
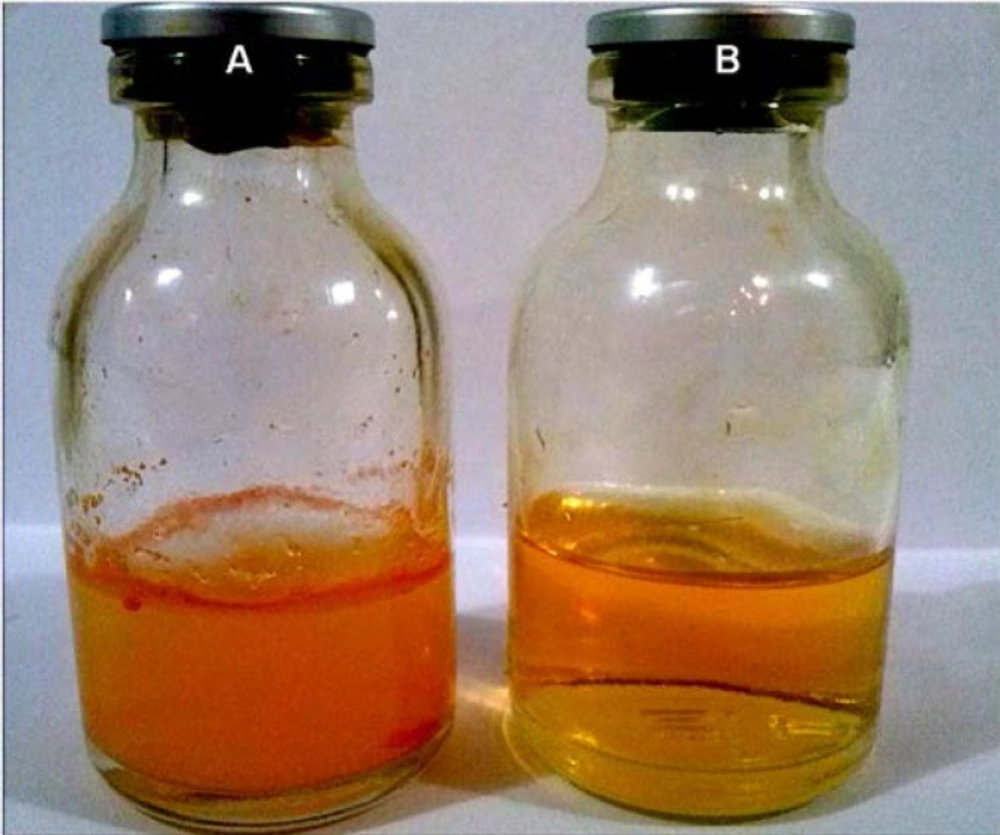
Free Cur in water (A) and Cur-loaded PLGA nanosphers in water (B).
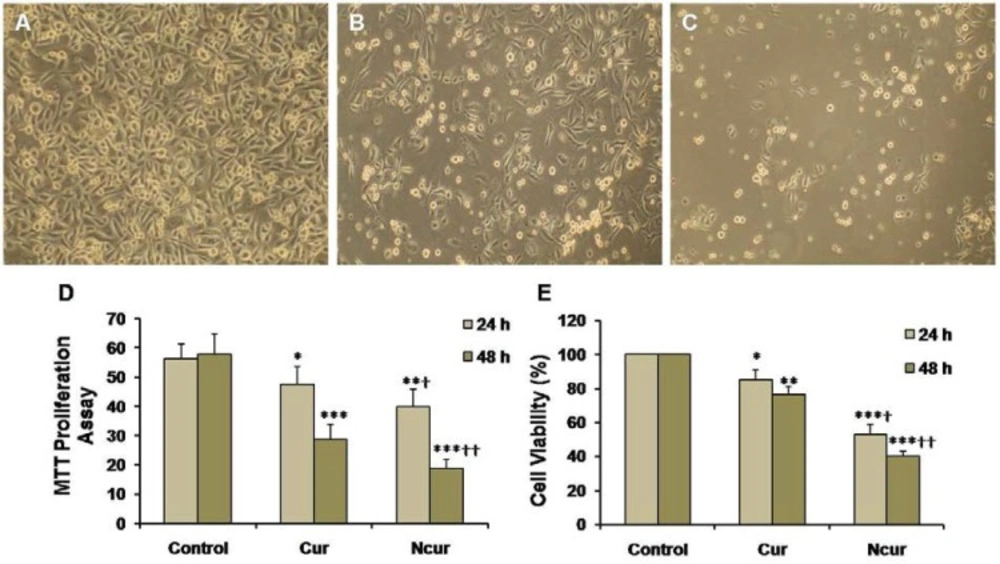
PC3 cell cultures of control (A), Cur (B), and NCur (C) groups (magnifications: × 100). MTT proliferation assay (D) and percentage of cell viability (E) in control and experimental groups are shown. All assays were performed in triplicate, and the mean ± standard deviations are shown. *p < 0.05, **p < 0.01, ***p < 0.001, †p < 0.01, ††p < 0.001; * and † symbols respectively indicate comparison to control and Cur groups
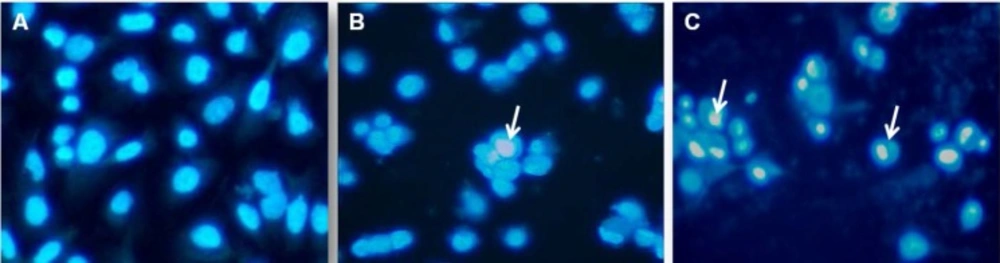
DAPI staining of control and experimental groups. (A) Control group, (B) Cur group, (C) NCur group. Arrows indicate chromatin condensation. Magnifications: × 400
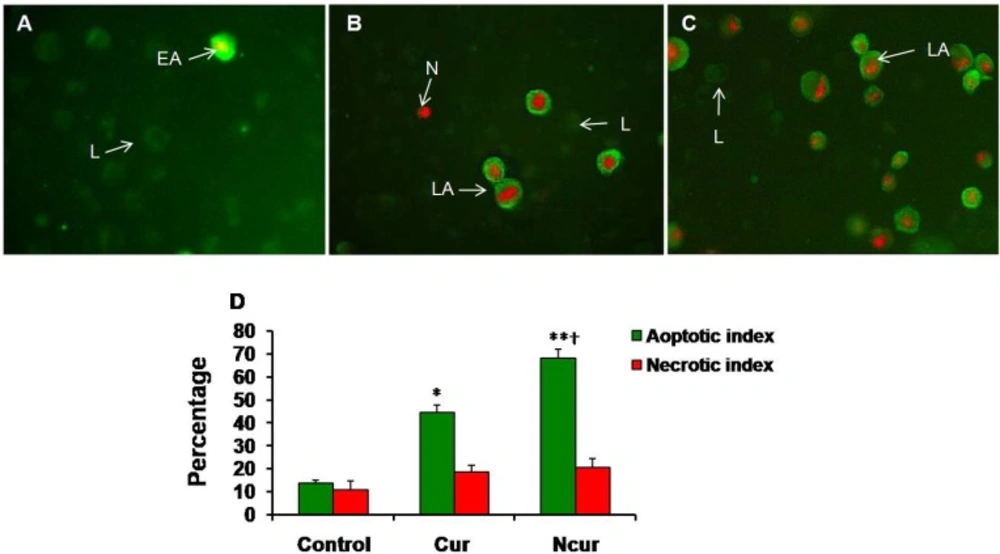
Immunoflorecent microscopy of Annexin/PI staining in control and experimental groups (Magnifications: × 250). (A) Control group; (B) Cur group; (C) NCur group. EA: early apoptosis (Cell membrane is strongly stained with FITC), LA: late apoptosis (Cell membrane is strongly stained with FITC and Nucleus is stained by PI), N: Necrosis (Nucleus have red stain), L: Live (Cells have slightly green stain). (D) Apoptotic and necrotic indexes of control and experimental groups. Values are expressed as mean ± SD. *p < 0.01, **p < 0.001, †p < 0.01; * and † symbols respectively indicate comparison to control and Cur groups
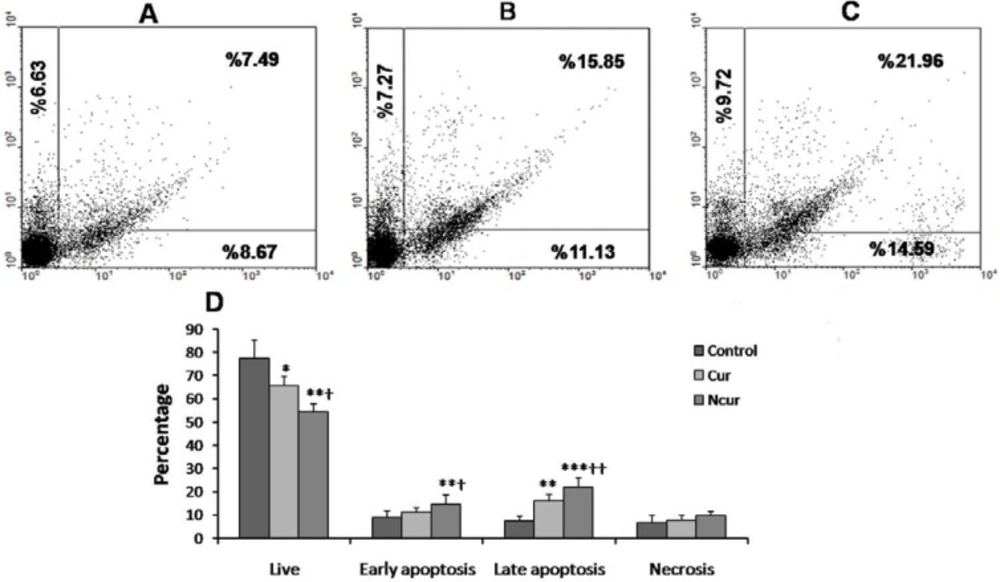
Flow cytometry of Annexin/PI staining in control and experimental groups. (A) control group, (B) Cur group, (C) NCur group. The lower left quadrant (Annexin V-FITC-/PI−) was considered as live cells. The lower right quadrant (Annexin V-FITC+/PI−) was considered as early-stage apoptotic cells, the upper right quadrant (Annexin V-FITC+/PI+) was considered late-stage apoptotic cells, and the upper left quadrant (Annexin V-FITC−/PI+) was considered as necrotic cells. (D) Summaries of changes in the percentage of viable cells, necrotic and apoptotic cells. All assays were performed in triplicate, and the mean ± standard deviations are shown. *p < 0.05, **p < 0.01, ***p < 0.001, †p < 0.01, ††p < 0.001; * and † symbols respectively indicate comparison to control and Cur groups
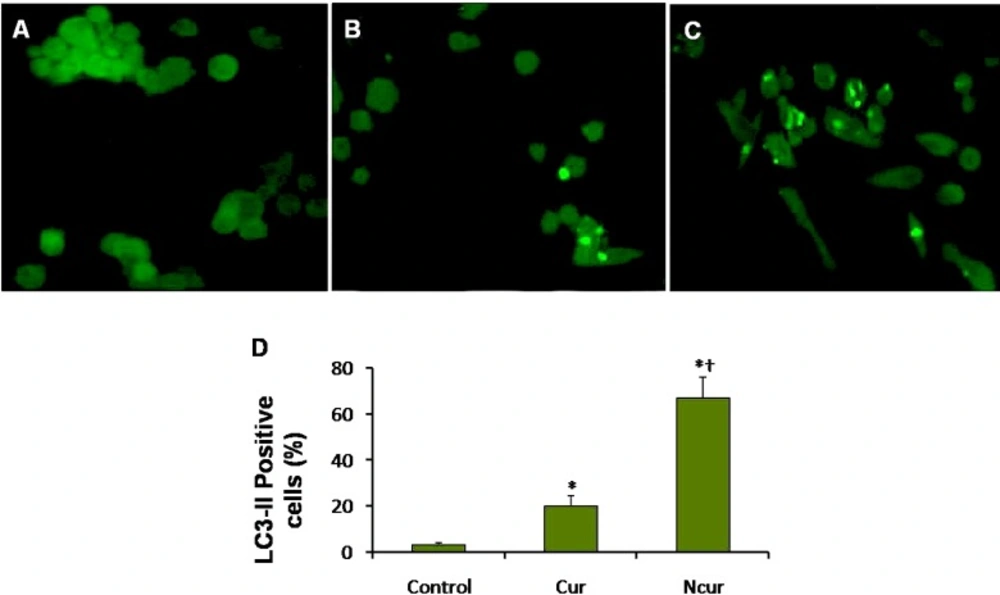
Immunoflorecent microscopy of PC3 cells staining in control and experimental groups. Autophagosomes have light green staining. (A) Control group, (B) Cur group, (C) NCur group. Magnifications: ×400. (D) percentage of LC3-II positive cells. All assays were performed in triplicate, and the mean ± standard deviations are shown. *p < 0.001, †p < 0.001; * and † symbols respectively indicate comparison to control and Cur groups
| Groups | 24 h | 48 h |
|---|
| Control | 100 ± 0.01 | 100 ± 0.02 |
| Cur | 98.1 ± 0.35 | 100.3 ± 1.32 |
| NCur | 99.4 ± 0.35 | 101.2 ± 1.65 |
Annexin V-FITC/propidium iodide apoptosis assay
PC3 and PNT2 cells were placed in a six-well culture plate and treated with Cur or NCur for 48 h as experimental groups. Control group was untreated cells. Normal, apoptotic and necrotic cells were distinguished using an Annexin V-FITC/propidium iodide assay kit according to the manufacturer’s instructions. Briefly, after the incubation period, the cells (1.0 × 10⁶) were washed in cold PBS. The washed cells were re-centrifuged, discarded the supernatant, and resuspended in 1X annexin-binding buffer. Twenty five μL of the Annexin V conjugate and 2 μL of the 100 μg/mL propidium iodide (PI) working solution were added to each 100 μL of cell suspension. The cells were incubated at room temperature for 15 min and then were washed with 1X Annexin-Binding buffer and deposited onto slides.
The fluorescence was observed by using appropriate filters. The cells were separated into three groups: live, apoptotic (early and late), and necrotic cells. Live cells showed only weak Annexin V staining of the cellular membrane. Early apoptotic cells showed a significantly higher degree of surface labeling. Late apoptotic cells showed both membrane staining by Annexin V and strong nuclear staining from the PI. Necrotic cells showed only nuclear staining from the PI. Apoptotic index and necrotic index were calculated by dividing the number of apoptotic or necrotic cells in a randomly microscopy field by the total number of cells in that field, and the result was multiplied by 100. The Apoptotic indexes and necrotic indexes of 10 randomly field were evaluated and the mean apoptotic index and necroptotic index of each case were calculated (
24). Flow cytometry by using this kit was also performed. Briefly, the cells were exposed to Cur or NCur in 6-well plates for 48 h. After exposure, cells were trypsinized and centrifuged at 1000 rpm, the cell pellet was washed with PBS once and re-suspended in 100 mL of binding buffer, then incubated with 2 mL Annexin V-FITC for 10 min, which was followed by staining with 2 mL PI. Then, the samples were diluted with 400 mL binding buffer and analyzed with a Flow cytometer (Becton Dickinson, San Jose, CA), and at least 10000 cells were counted for each sample. The cell population of interest was gated on the basis of the forward and side-scatter properties. The different labeling patterns in the Annexin V/PI analysis identified the different cell populations where FITC negative and PI negative were designated as viable cells; FITC positive and PI negative as early apoptotic cells; FITC positive and PI positive as late apoptotic cells and FITC negative and PI positive as necrotic cells. The data analysis was performed using WinMDI 2.9 software.
Data Analysis
Comparisons of multiple (> 3) group means were performed using one-way analyses of variance and post-hoc procedures based on Newman-Keuls tests. Student’s t tests were used for comparisons of two group means. A p-value less than 0.05 is considered statistically significant.