Introduction
Toxicity bioassays are important tools to develop the biological effect of chemical agents on cells. Most of the cytotoxicity tests were based on the ability of cells to continue the biological activity during the test and measures the criteria of cell growing or cell death. In general, these tests could neither qualify toxicity effect in different molecules of cells (1) nor predict dose quantity in the pattern of cell toxicity.
Infrared spectroscopy, have been used to investigate biochemical composition of cells in early nineties (2). Later, FTIR research was used in a large number of different studies including the early diagnosis of malignant tissues (3, 4), asses of plants organs (5) and estimating stress in microorganisms (6). These literatures have presented the potential application of FTIR technique for the detection of cellular stress or alterations with a good sensitivity. Several cluster analysis such as principal component analysis (PCA), artificial neural network (ANN) and genetic algorithms (GA) were used to analyze the FTIR spectra (-). Some authors challenged with machine learning and boosting support vector regression analysis to quantify the FTIR spectral data(10, 11). In some cases, the variation of the ratios between the areas of the peaks have accurate perturbation in spectral data (12).
Cisplatin is a cytotoxic agent that is used for treatment of many cancer types including testicular, ovarian, cervical, head and neck, non-small cell lung and lymphoma (13). There are many theories to explain platinum cytotoxicity, including interstrand and intrastrand cross-links with nitrogenous bases of deoxyribonucleic acids (-). These interactions causes error in DNA synthesis and alterations in cellular transcription (18, 19). Interaction of cisplatin with proteins and lipids was also believed to be responsible for the cytotoxicity of this cancer chemotherapy agent (20, 21). The effect of cisplatin on different molecular sites of cells provide a chance to apply a model to be useful for the understanding and even prediction of its cellular toxicity bioassay.
In the present study, cisplatin interaction with human hepatocarcinoma HepG2 cell line was investigated using FTIR-based assay. Different cisplatin concentrations were analyzed to study the binding properties of cisplatin to cells. This effort demonstrate biochemical change index which can be used for platinum cytotoxicity activity. We proposed a PLS method on FTIR spectrum data to predict effective concentration pattern of cisplatin toxicity in HepG2 cell line.
Experimental
Cell line
Human hepatocarcinomacell line (HepG2) was obtained from Pasture Institute National Cell Bank of Iran (Tehran, Iran). Cell line was grown in RPMI-1640 medium supplemented with 10% heat inactivated fetal bovine serum, antibiotics: penicillin, streptomycin (all chemicals from Sigma). Cells were maintained at 37 °C in humidified atmosphere containing 5% CO2.
Experimental strategy
Cells were trypsinized from the original flask and seeded in 75 cm2 flasks with fresh medium to reach the logarithmic phase of growth curve. After that cells were washed twice with saline (0.9% NaCl), suspended and centrifuged at 1000 rpm for 10 min, then resuspended in saline to obtain a concentration of 107cells/mL. Part of these cells were used for FTIR experiments using nine concentrations as is shown in Table 1 and about 0.1 mL for the clonogenic assay. Total of attached and detached cells in each flasks were collected after 24 hours exposure for FTIR spectroscopy. All experiments were repeated seven times for each concentration and all of these resulted data were used in mathematical calculations.
Table 1
Clonogenic assay based mortality induced by cisplatin at different concentrations.
| Concentration(µg/mL) | Cisplatin mortality | |
|---|---|---|
| 1 | 0 | 0% |
| 2 | 0.125 | 24% |
| 3 | 0.25 | 40% |
| 4 | 0.5 | 67% |
| 5 | 1 | 88% |
| 6 | 1.5 | 92% |
| 7 | 2 | 95% |
| 8 | 3 | 98% |
| 9 | 4 | 100% |
Clonogenic assay
One hundred cells from the cell suspension was seeded in each well of six wells cell culture plates with 2 mL of fresh medium. Cells in each well were exposed to one of different concentrations of cisplatin as is listed in Table 1 for 24 hours. Media was changed with fresh media and incubated for 10 days. After that the wells were stained with crystal violet and colonies containing more than 50 cells were counted in each well. Survival curve was resulted from the percentage of colonies in each well exposed to cisplatin compare to the control wells.
Cell preparation for spectroscopy
The following procedure was similarly applied for all cell line flasks. 10 μL of each cell suspension was placed on a zinc selenide sample carrier which was dehydrated in a vacuum cabin (0.8 bar) for approximately 4 min. These plates were then used for FTIR spectroscopy (22).
FTIR spectroscopy
For FTIR studies, thin dried films of cell suspensions were used on the Zinc selenide window by using a WQF-510 (Rayleigh Optics, China) spectrometer, equipped with a KBr beam splitter and a DLaTGS (deuterated Lantanide triglycine sulphate) detector. In each spectrum, 100 scans were collected at a resolution of 4 cm-1 for every wave number between 400 and 4000 cm-1. Each single spectrum was baseline corrected and then normalized in order to have the range spanning from 0 to 1.
Data analysis
Data set
A total of 56 FTIR spectrums (7 spectra for each concentration as is listed in Table 1) have been taken in the range of 1000-3000 cm-1 and results were arranged in a data set for different analysis as are listed below.
Partial least square regression
Partial least square regression (PLS) is a common prediction model in the field of chemo metrics method. PLS is a multiple linear regression model that is related to other methods including principal components regression (23). Where Y is an output object with m variables, and X is the input matrix with p predictor variables. Partial Least Squares regression is based on the simultaneous decomposition of X and Y into latent variables (T) and associated loading vectors (Q). Regression is performed on these components, thus Y = TQ + E, where Q is a matrix of regression coefficients (loadings) for T (24). Here, X and Y are the independent variables, respectively. In this work, Y includes concentration of cisplatin, while the X block consists of y axis of FTIR data for Biochemical Index spectrum.
Results and Discussion
Clonogenic assay showed a lethal concentration fifty of 0.3 µg/mL and a sharp mortality effect of HepG2 cells up to 1.5 µg/mL of cisplatin exposure (Figure 1) which caused 90% cell death.
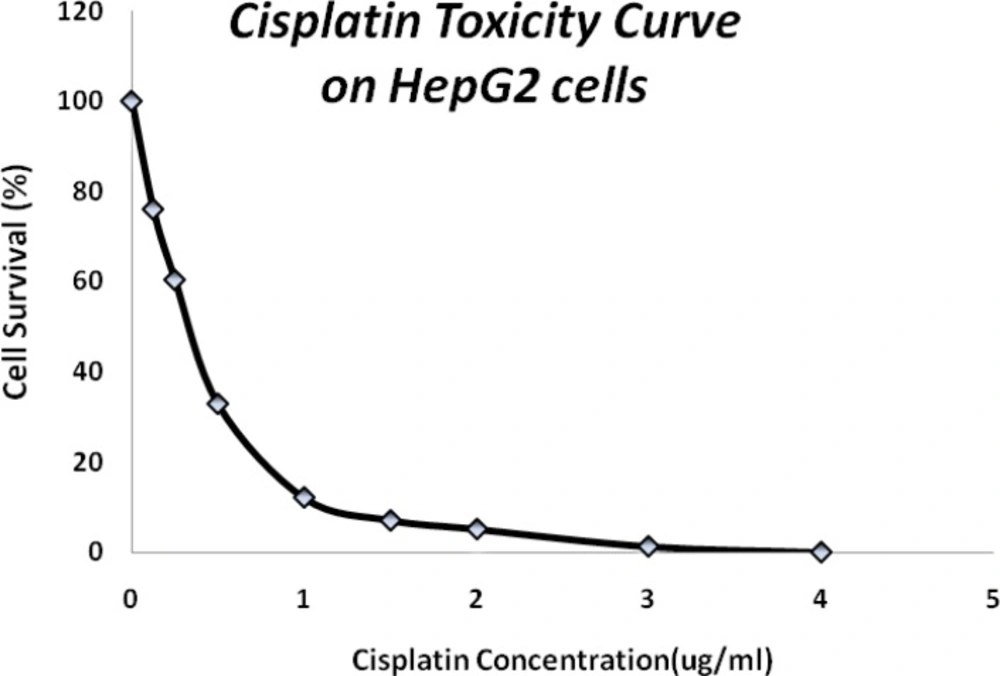
Figure 1
Cisplatin mortality in HepG2 cells following a 24 hours exposure time.
FTIR spectroscopy
Spectral features of HepG2 cells in the range of 1800-900 cm-1 for the different concentrations of cisplatin are shown in Figure 2. The normalized FTIR spectra in this region showed alterations in different spectral areas. Comparison between spectra showed at least two areas of variation:
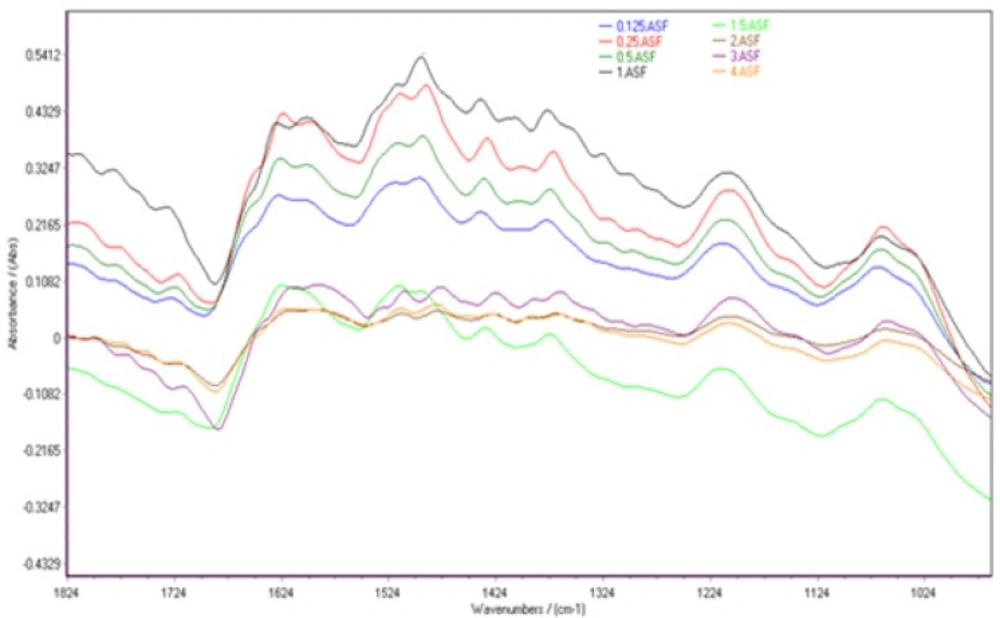
Figure 2
Spectral features of HepG2 cells after 24 hours exposure to the different concentrations of cisplatin in the FTIR spectral region of 1800-900 cm-1.
- Ring vibrations of nitrogenous bases (C=O, C=N stretching), PO2 stretching vibrations (symmetric and asymmetric) and deoxy-ribose stretching of DNA are appeared in the spectral region 1800 –700 cm-1 (25). The vibrational bands of DNA at 1720, 1665, 1613 and 1499 cm-1 are assigned to guanine (G), thymine (T), adenine (A) and cytosine(C) nitrogenous bases, respectively (26). Cellular FTIR patterns are changed above 1.5 µg/mL as follows; guanine band at 1725cm-1 shift to 1713 cm-1 and thymine band at 1665 cm-1 shift toward a lower wave number at 1657 cm-1. These shifts can be related to platinum binding to N7 of Guanine and O2 of Thymine in DNA bases (14). Bands at 1228 and 1087 cm-1 demonstrate phosphate asymmetric and symmetric vibrations, respectively (27) (27). No major shift was observed for phosphate vibrations.
Interpretation of spectrum from raw cellular FTIR spectra is hard and misses lots of alterations. To solve this problem, biochemical index spectrum (BIS) was calculated as difference between the spectra of cells exposed to different cisplatin concentrations and those cells maintained in normal saline. As the concentration of cisplatin increased, the intensities of a positive peak at about 1648 cm-1and a negative peak at about 1490 cm-1 were decreased (Figure 3).
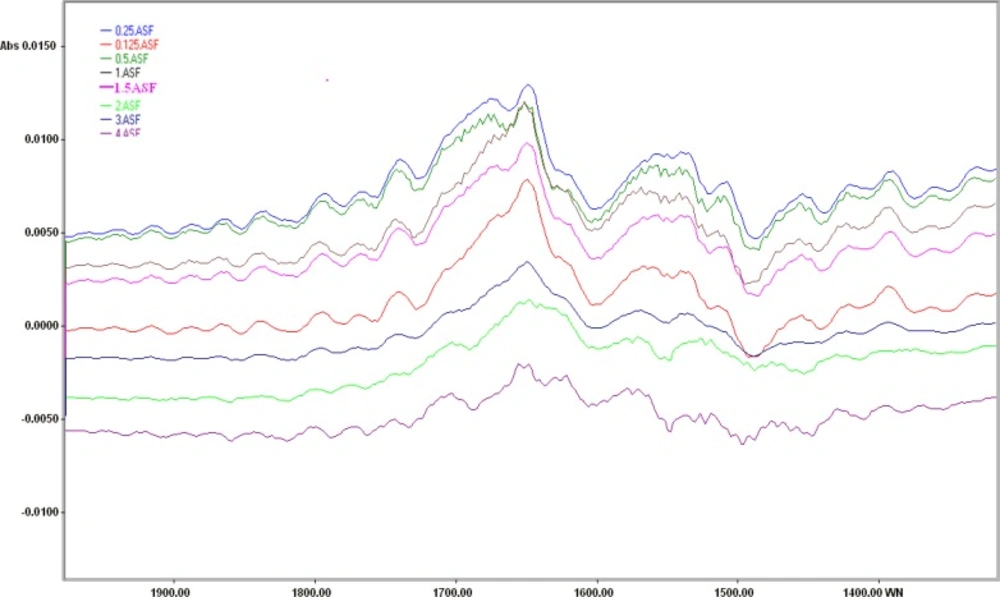
Figure 3
Biochemical index spectra of HepG2 cells after 24 hours exposure to the different concentrations of cisplatin in the FTIR spectral region of 1800-1200 cm-
Data analysis
FTIR data of ˝Biochemical Index spectrum˝ (BIS) for different concentrations of cisplatin were sorted randomly into 20 different data sets (numbered 1 to 20) each composed of 40 training variables and 16 testing variables. The 20 models were analyzed with PLS analyzing to predict pattern for cisplatin toxicity. To choose an optimized number of latent variables (LVs) or principal components (PCs), we examined the mean squared prediction errors between the measured and the predicted responses with increasing numbers of LVs for each concentration of cisplatin. When BIS matrices were used to predict the effective concentration of cisplatin, the mean squared prediction errors decreased, while that was minimized with just 7 LVs for the PLS model (Figure 4).
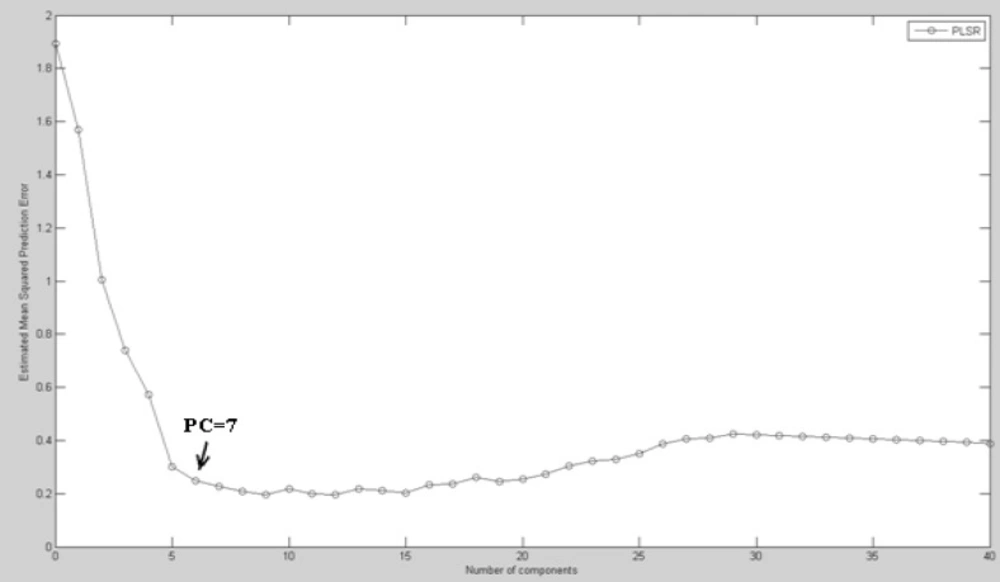
Figure 4
Estimated mean squared prediction errors of cross-validation FTIR response using PLS analysis.
In order to evaluate the performance of the models two statistical factors are used: the root mean square error (RMSE) and correlation coefficient (R2) values which are derived in statistical calculation of observations in model output predictions, defined as:
Where wo is the observed values of cisplatine concentration for type t, wo is the average of cisplatin concentration for type t, and wp is the predicted value of cisplatin concentration for type t (30).
After selecting the optimized number of PCs for each model, we examined the squared Pearson correlation coefficient, R2, between exposed cisplatin and the predictions (Table 2). When the model is performed for the training dataset in present investigation, cisplatin concentration for each experiment in the testing dataset is predicted in turn using the learned rules derived from the dataset in model training procedure. Comparison of the 20 PLS models indicates a high correlation in all predictions for data sets of total FTIR wave number (Seri1; 1000-3000 cm-1) in training and testing data. Partly correlation was found for the range of 2000-3000 cm-1 while there is no suitable correlation in other segmentation of FTIR data (R2 ranging from 0.3 to 0.77).
Table 2
Prediction of accuracy in the training and the testing models using PLS calculations as described in methods.
| R2 for training model | RMSE for training model | R2for testing | RMSE for testing model | |||||||
|---|---|---|---|---|---|---|---|---|---|---|
| Seri1 | Models trained with variables in 1000-3000 cm-1 | |||||||||
| 1 | 0.9144 | 0.1888 | 0.9807 | 0.0094 | ||||||
| 2 | 0.9128 | 0.1699 | 0.9762 | 0.03 | ||||||
| 3 | 0.9387 | 0.11 | 0.9188 | 0.14 | ||||||
| 4 | 0.8515 | 0.179 | 0.9972 | 0.008 | ||||||
| Seri2 | Models trained with variables in 3000-2500 cm-1 | |||||||||
| 5 | 0.8325 | 0.375 | 0.9869 | 0.006 | ||||||
| 6 | 0.8644 | 0.26 | 0.9745 | 0.033 | ||||||
| 7 | 0.8409 | 0.24 | 0.8215 | 0.018 | ||||||
| 8 | 0.8014 | 0.2 | 0.9937 | 0.01 | ||||||
| Seri3 | Models trained with variables in 2500-2000 cm-1 | |||||||||
| 9 | 0.8964 | 0.23 | 0.9329 | 0.032 | ||||||
| 10 | 0.9124 | 0.17 | 0.9970 | 0.0177 | ||||||
| 11 | 0.9387 | 0.1143 | 0.9181 | 0.14 | ||||||
| 12 | 0.8518 | 0.1795 | 0.9972 | 0.008 | ||||||
| Seri4 | Models trained with variables in 1500-2000 cm-1 | |||||||||
| 13 | 0.4818 | 1.14 | 0.7102 | 0.14 | ||||||
| 14 | 0.4172 | 1.12 | 0.9716 | 0.036 | ||||||
| 15 | 0.5969 | 0.75 | 0.7981 | 0.348 | ||||||
| 16 | 0.3224 | 0.82 | 0.9907 | 0.027 | ||||||
| Seri5 | Models trained with variables in 1000-1500 cm-1 | |||||||||
| 17 | 0.7 | 0.66 | 0.9351 | 0.03 | ||||||
| 18 | 0.7700 | 1.36 | 0.5326 | 0.6 | ||||||
| 19 | 0.7515 | 0.46 | 0.9165 | 0.144 | ||||||
| 20 | 0.6324 | 0.44 | 0.9618 | 0.113 | ||||||
Binding to DNA is believed to be the main cytotoxicity action of cisplatin. Direct platinum binding to guanine (N7) and thymine (O2) were appeared in cellular DNA bands at 1.5 µg/mL of cisplatin exposure and from proteins were appeared in the spectral patterns of cells exposed to higher concentration of cisplatin at 2 µg/mL. Spectral change for proteins and nucleic acid bands is critical point in the ability of FTIR for highlighting molecular changes in cisplatin toxicity. It is estimated that cisplatin first interact with DNA and then with the proteins since DNA spectral alterations occur from 1.5 µg/mL, while protein spectra remain unchanged until above 2 µg/mL.
Biomonitoring involves the use of molecular markers as signaling indicators for the exposure of living organisms to chemicals. Therefore, biological monitoring through the analysis of cells, tissues, or body fluids of exposed species may lead to the identification of potentially hazardous exposures before when the symptoms appear. Exposure limits might then be established to minimize significant health risks (31). Biological monitoring in cells requires the prediction of chemicals effective concentration for cell components with a suitable organized bioassay. Here, we are introducing a good correlation between biochemical index of FTIR spectrum and its corresponding cisplatin cytotoxic concentrations. However, risk assessment is conventionally based on the estimation of administered dose or human exposure to drugs and chemicals in spatial site (32) . Our results have presented that PLS is a good model for the prediction of toxic concentrations of cisplatin on cells using alterations in FTIR spectrum in the range of 1000-3000 cm-1. Cisplatin ability to interact with the different components of cells further increases the possibility of FITR spectroscopy application as a biological monitoring tool. However, one limitation of this study is the estimation of the toxicity patterns with different prediction models such as artificial neuronal network.
Many factors may affect the outcome of chemical exposure and toxicity outcome. Partial least square regression of FTIR data offers the advantage of a fast and reproducible procedure, which can be used for direct prediction of effective concentration for toxic agents in a bioassay procedure.
Conclusion
The interactions between chemicals and macromolecules in the cells are an important point for toxicological paradigms. Regarding this study, the step by step of toxicity stress in cell line is specified thorough FTIR spectroscopy analysis. HepG2 cell line was exposed with different concentration of cisplatine where hepatica cell is preferred for modeling of toxicity stress. In this study, all cisplatine detectable alteration was seen in DNA, amid and lipid bands of cells. Biological monitoring in cells requires the prediction of chemicals effective concentration for cell components with a suitable organized bioassay. Here, we are introducing a good correlation between biochemical index of FTIR spectrum and its corresponding cisplatin cytotoxic concentrations. In view of future, one of the advantages of this model is to predict the toxic concentration in animal exposure as well as the estimation of the bioaccumulation of chemicals in chronic exposure using PLS calculations on FTIR data.