After isolation and purification, a brownish-red compound was obtained. The molecular formula of the compound was determined to be C
29H
25NO
3 by combined UV, IR, HRMS and NMR spectrometry. The major physical and analytic properties of the compound were summarized as below: UV (in methanol) λ
max 253 and 339 nm; IR (KBr) 3050, 2958, 2927, 1730, 1639, 1534, 1454, 1395, 1235, 1103, 789, 742, 701 cm
–1;
1H-NMR (CD
3SOCD
3, 600 MHz) δ: 8.15 ppm (1H, s, quinolione), 8.12 ppm (
1H, d, quinolione), 7.85 ppm (1H, d, quinolione) , 7.49 ppm (1H, s, quinolione),7.47 ppm (1H, s, quinolione), 7.35 ppm (2H, t, phenyl), 7.26 ppm (2H, d, phenyl), 7.18 ppm (3H, t, phenyl), 6.99 ppm (1H, d, phenyl),6.77ppm (1H, t, phenyl), 4.36 ppm (2H, d, O-CH
2-CH), 4.06ppm (2H, s,C-CH
2- C), 3.26 ppm (1H, t, O-CH-CH
2-O), 3.23 ppm (1H, t, CH
2-CH-C), 2.96 ppm (2H,d, -CH
2-), 2.35 ppm (3H,s,C-CH
3); 1D
13C-NMR (CD
3SO CD
3, 400 MHz) δ: 60.29 (C-1),68.95 (C-2), 172.85 (C-4), 50.56 (C-5), 64.64 (C-6), 29.57(C-8), 129.93 (C-9), 132.24 (C-10),126.66(C-10a), 124.65 (C-11), 135.59 (C-12), 131.25(C-13), 126.66(C-14), 145.08(C-14a),150.57 (C-16), 41.54(C-17), 143.65(C-18),129.10 (C-19),129.10 (C-20), 127.22(C-21), 127.93(C-22), 128.54 (C-23), 139.55 (C-24), 136.33 (C-25), 150.10 (C-26), 126.24(C-27), 125.32 (C-28), 127.93(C-29), 16.22 (C-30) (Fig.S5); HREIMS m/z 436.1758 (calcd for C
29H
25NO
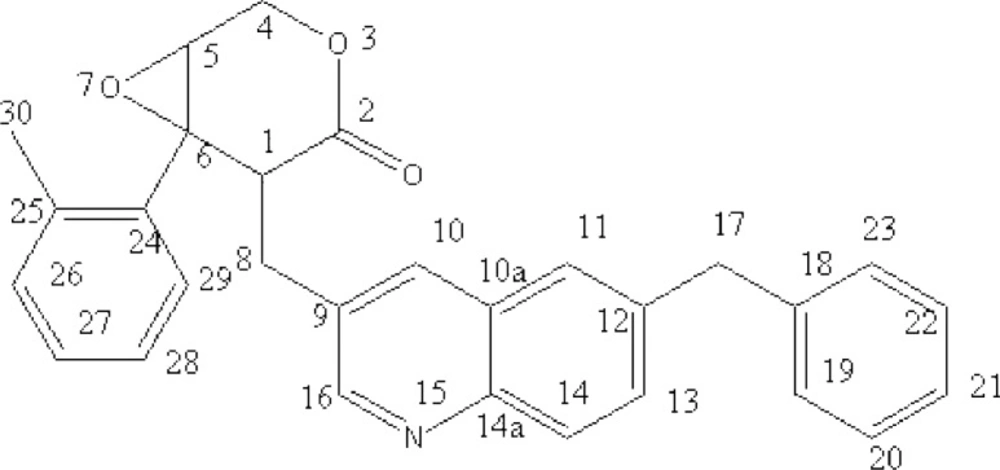
3, 435.1864). The structure of compound was depicted by analyzing above spectrum data (
Figure 1). According to the physical and analytic properties, the new compound was [1R, 6R]-5- (6-benzyl- quinolin-3-ylmethyl)-6- phenyl-3, 7-dioxa-bicycle [4.1.0] heptan-4-one and it was named as quinoxalone.
According to the handbook of organic chemical analysis and spectrum, the characteristic peak at 253 nm and 339 nm indicated phenyl group and lactone ring, respectively. The HREIMS spectrum of quinoxalone showed protonated molecular ion [M+H]+ at m/z 436.1942, while the calculated molecular weight was 436.1738 Da. The HREIMS spectrum revealed that the molecular weight of the compound was 435.1864 and the molecular formula C29H25NO3. The IR spectrum showed absorptions for phenyl ring (1534, 1454, 789, 742, 701 cm-1), quinoline ring (1639 cm-1) and lactone (1730 cm-1). The 13C-NMR spectrum showed 29 signals. The complete structure of quinoxalone was elucidated by 1H-NMR and 13C-NMR experiments.
B16, CT-26, HepG2, DMA-MB231, MCF-7 and SGC-7901 tumor cell lines were used to evaluate the antitumor effects of quinoxalone
in-vitro. As we can see from
Table 1, quinoxalone showed strong antitumor bioactivity to the above six cell lines after treating the cells with it at various time. The IC
50 values indicated that quinoxalone has the higher inhibition ability to CT-26 (IC
50 2.12 ± 0.19 µg mL
-1) and B16 (IC
50 2.23 ± 0.14 µg mL
-1) for 48 h, followed by HepG2 (IC
50 2.41±0.32 µg mL
-1) and DMA-MB231 (IC
50 3.08 ± 0.21 µg mL
-1). It showed lower cytotoxicity to SGC7901 and MCF-7 cell lines. Compared with the reported antitumor drugs, Paclitaxel and Epothilone B, the antitumor bioactivities of quinoxalone on MCF-7, B16 and HepG2 cell lines were less than those of Epothilone B and Paclitaxel
in-vitro. The influence on the growth of mouse spleen cells by quinoxalone was checked. The proliferation of mouse normal spleen cells was slightly influenced at the low dose. The growth of cells treated with the higher concentration was significantly inhibited and IC
50 was 836.27 ± 13.02 µg mL
-1. So, quinoxalone showed relative safety to the mouse normal spleen cells. The results indicated that quinoxalone could selectively kill the cells and induced tumor cell to die in all probability by apoptosis manner.
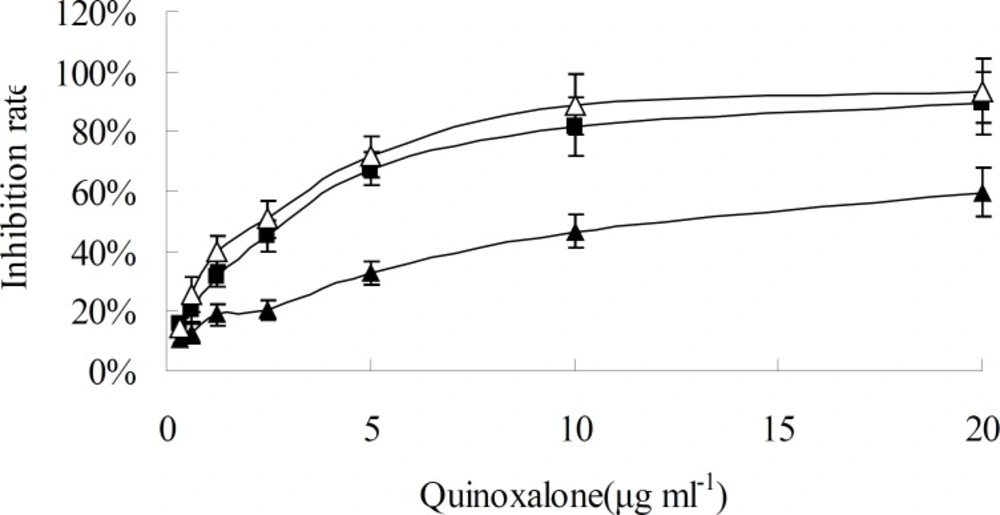
When HepG2 cells were treated with various concentration of quinoxalone and various treating time, the growth of cells was significantly inhibited at dose- and time-dependent manner, as shown in
Figure 2 and
Figure 3. When the concentration was under 10 µg mL
-1, the change of inhibition rate was obvious as the concentration increase of quinoxalone. Compared to the control, significant decrease of the amount of HepG2 cells treated with quinoxalone (5 and 10 µg mL
-1) for 48 h was observed. Furthermore, the cell treated for 48 h began to have poorly adherence to the culture flask. The change of inhibition rate was slight as the concentration increase of quinoxalone when the dose was above 10 µg mL
-1. The IC
50 on HepG2 cells was 13.8 ± 0.45 µg mL
-1 after treating for 24 h, but the IC
50 were 2.41 ± 0.32 and 2.09 ± 0.35 µg mL
-1 after treating for 48 h and 72 h, respectively. The treating effects for 48 h and 72 h were similar. So, the results suggested that the best treating time was 48 h.
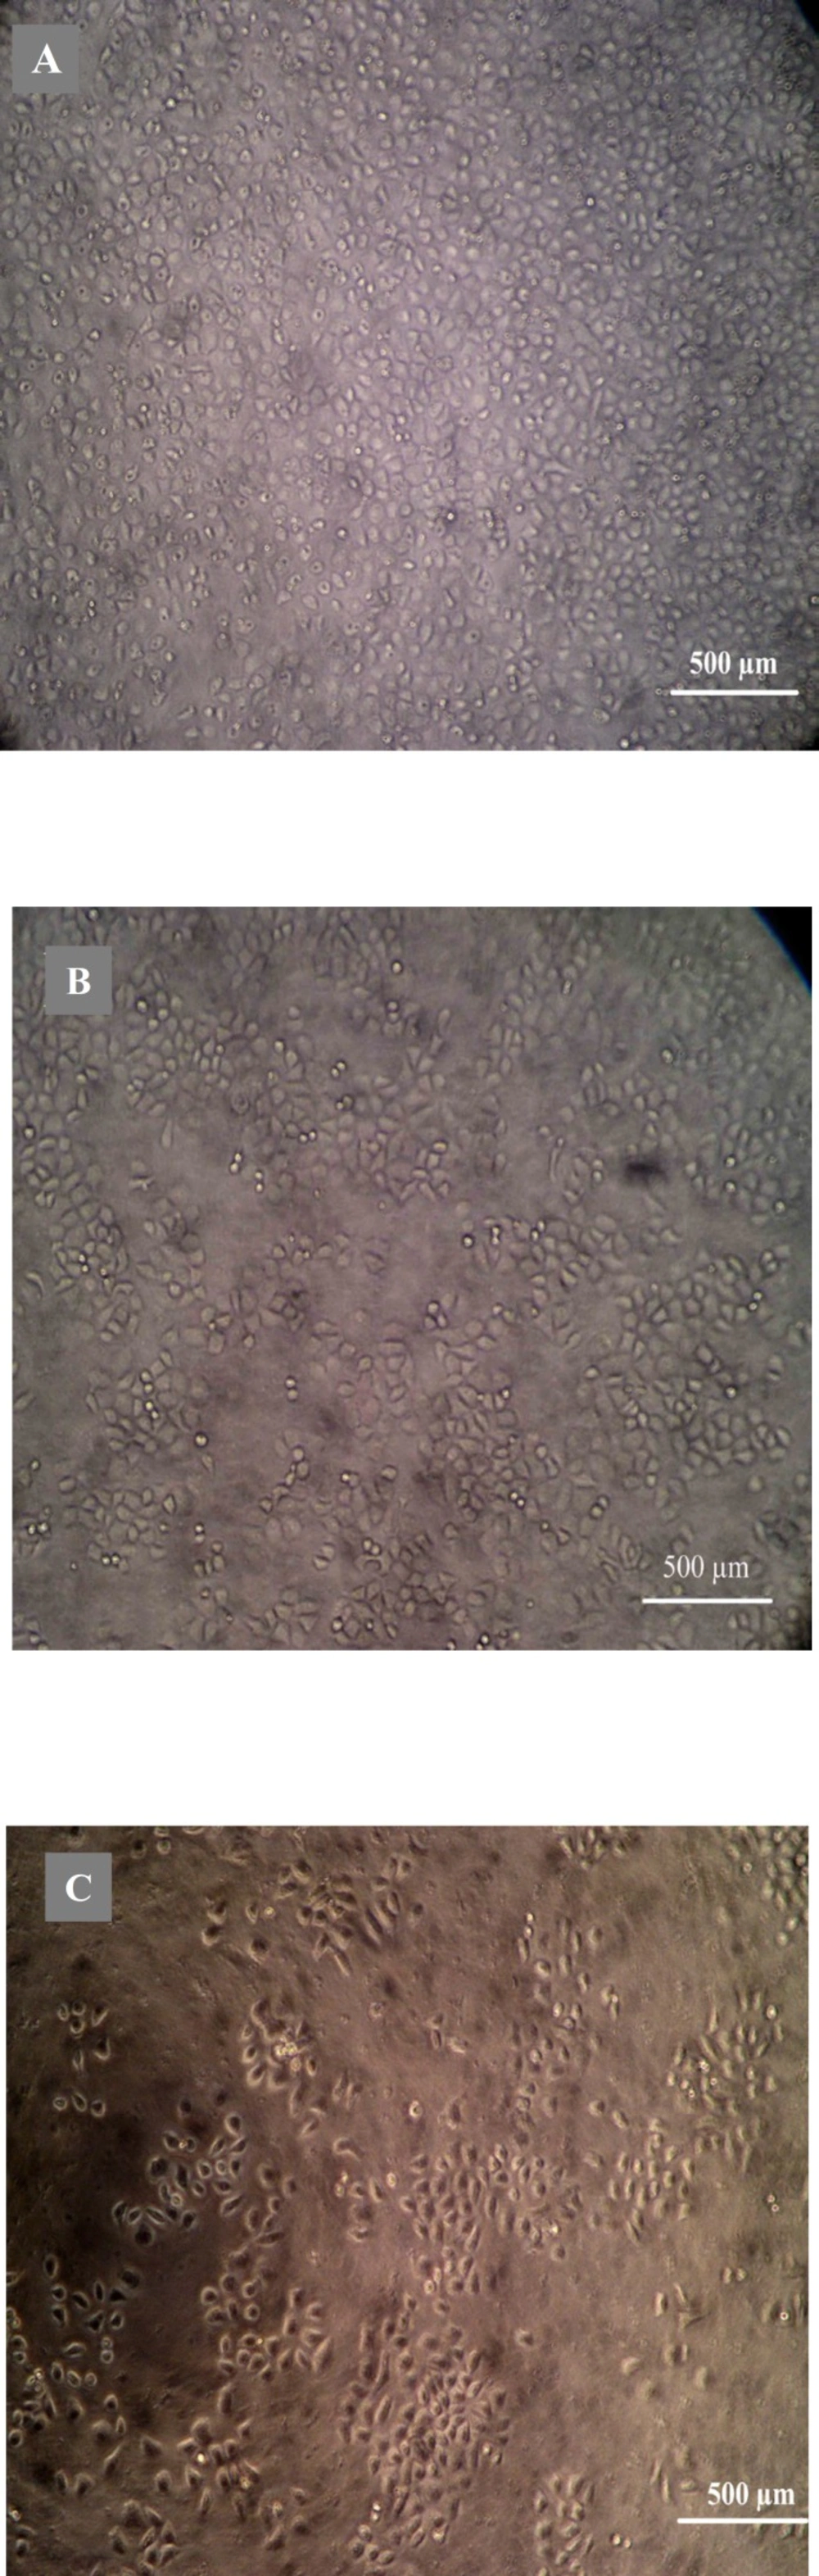
Morphological analysis of cell character observed by inverted microscope showed that HepG2 cells treated with 5 µg mL
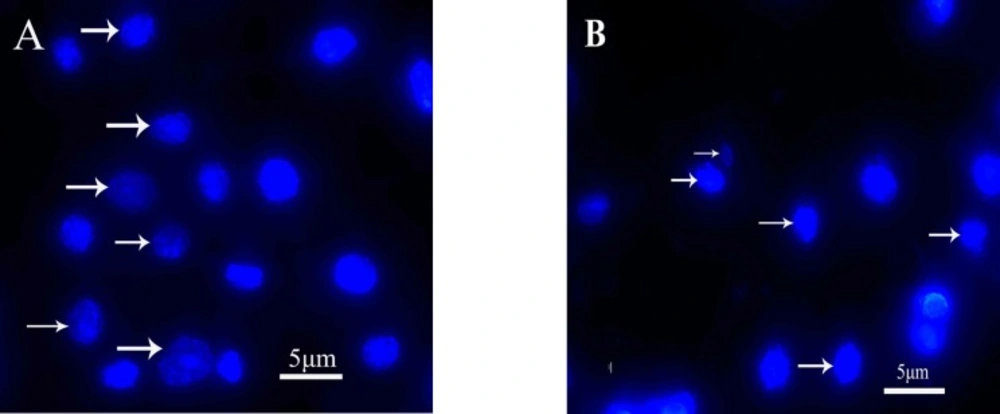
-1 quinoxalone started to change their shape (they shrunk and started to round up) and the total amount of living cells was distinctly less than those of the control. Moreover, large number of dead cells was suspended in the culture medium. With higher concentration of quinoxalone, cell shrinkage and blebbing on cell membrane could be observed by scanning electron microscope. These alterations were even more expressed following 24 h treatment (data not shown). At the same time (48 h treatment), we also noticed changes in nuclear morphology on HepG2 cells under a fluorescence microscope (
Figure 4). The results showed that the cells had nuclear shrinkage and condensed chromatin of nucleus (
Figure 4B).
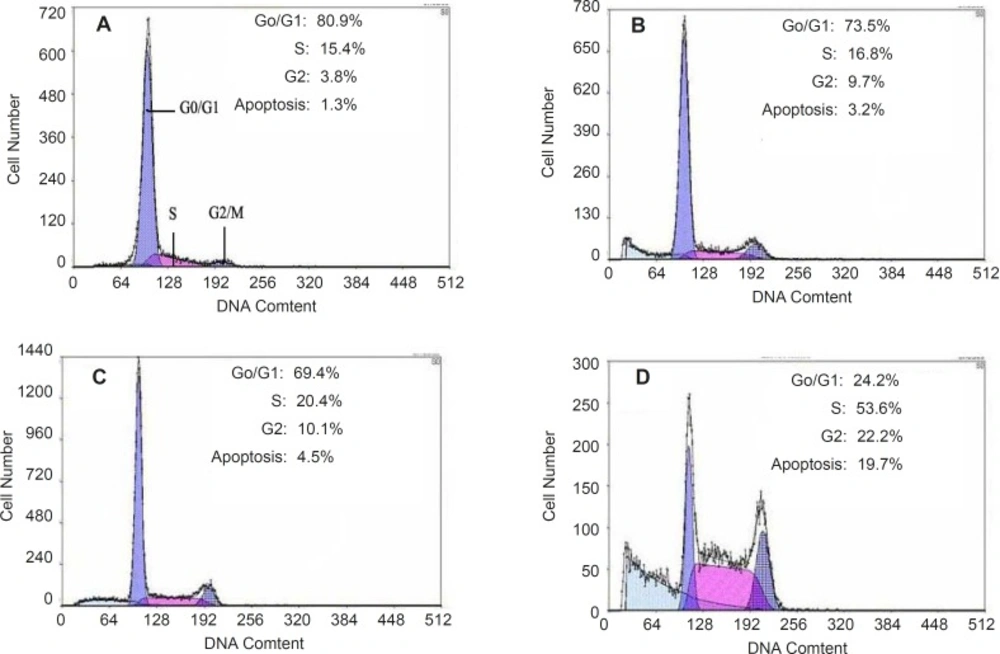
Apoptosis of HepG2 cells could be induced by quinoxalone using the PI staining method. After HepG2 cells treated with quinoxalone (at dose of 0, 2.5, 5 and 10 µg mL
-1) for 48 h, the total amount of cells in the subsequent cell cycle phases differed from those of the control.
Figure 5 showed that 80.9% cells treated without quinoxalone were in the G0/G1 phase, but 24.2% cells treated with 10 µg mL
-1 quinoxalone were in the G0/G1 phase. But, compared with the control, the total amount of cells treated with 10 µg mL
-1 quinoxalone in S phase significantly elevated from 15.4% to 53.6% and from 3.8% to 22.2% in G2/M phase. Moreover, the number of cells in S and G2/M phase increased with a dose-dependent manner. Because the most tumor cells were accumulated in S phase and in G2/M phase, HepG2 cells could not be duplicated, and finally led to die.