Optimization for extraction of neutral and acid anemaran
The effect of variation of four parameters, isolation duration, temperature, the ratio of residuals to water and extracting times on neutral and acid polysaccharide yields were investigated in this study (
Figure 1,
2).
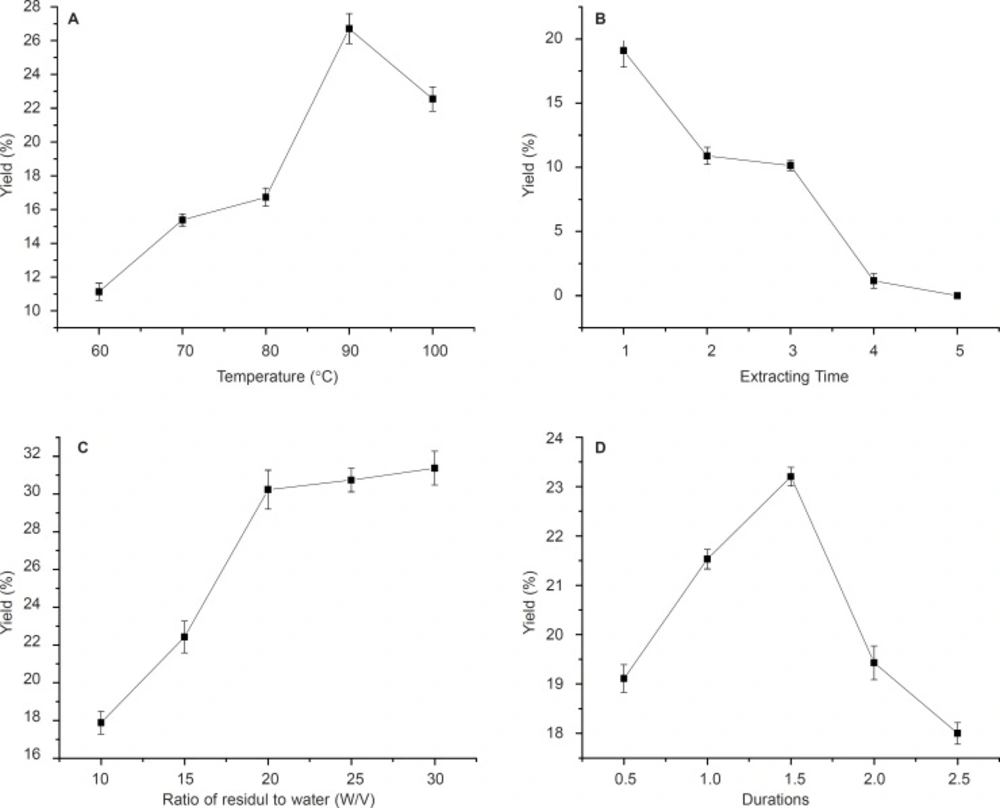
Effects of temperature, time of extraction, ratio of residual water and reaction durations on NA yield. Results were presented as means ± SD (n = 3).
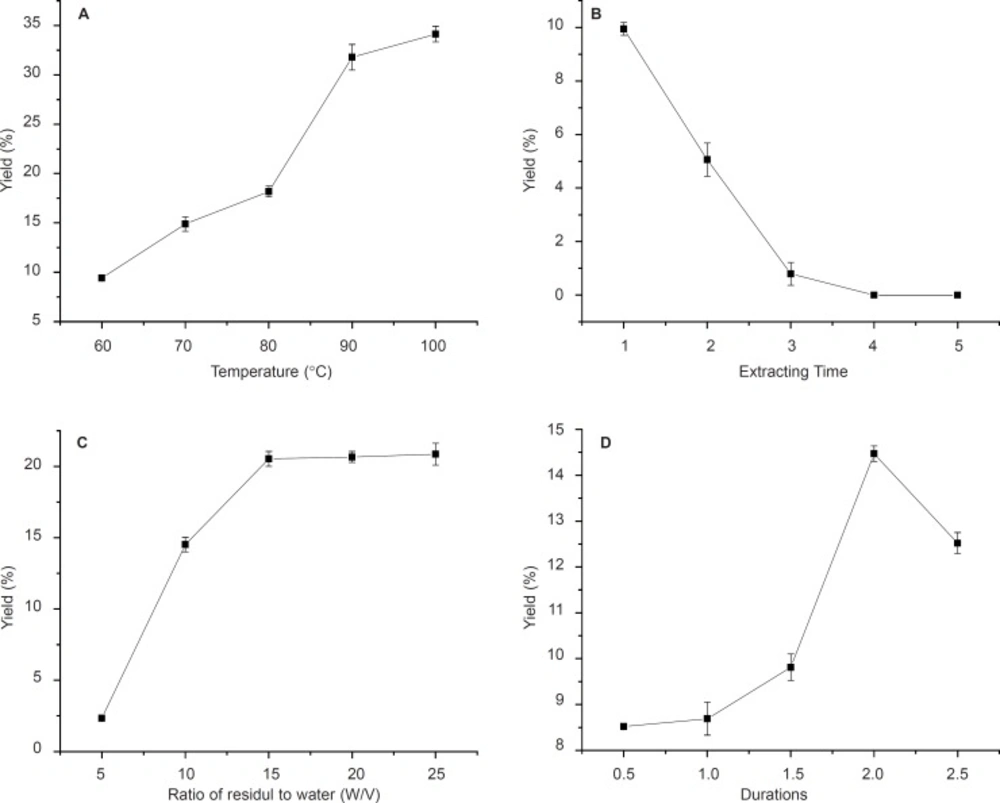
Effects of temperature, time of extraction, ratio of residual water and reaction durations on AA yield. Results were presented as means ± SD (n = 3).
The effects of different temperatures of 60, 70, 80, 90 and 100ºC on polysaccharides (NA and AA) yields are shown in
Figure 1a and
Figure 2a. With temperature increasing, the yield of crude polysaccharides increased until 90ºC for NA (
Figure 1a). Therefore, 90ºC was selected as the centre point of extracting temperature in this experiment as higher temperature would cause energy waste and decrease the yield. This could be due to the fact that higher temperature might cause degradation of anemaran (
24,
25). However, it is observed that the yield of AA increased from 9.2% to 32% with the temperature increasing from 60 to 100 ºC. The yield of polysaccharides obtained at 90 ºC was significantly higher than that obtained at 60, 70 and 80ºC, but not significantly different from that obtained at the temperature of 100ºC for AA (
Figure 2a). The optimum temperature at 90 ºC was good for both producing more NA and AA. The results of extraction times affecting on the yield of polysaccharides are shown in
Figure 1b and
Figure 2b.
The results obtained by investigating the effect of solid and liquor ratio on DS are shown in
Figure 1c and
Figure 2c. The amount of residuals and reactants used during these experiments was constant, but the ratio of residuals/water decreased by increasing the amount of solvent. The optimum yield at residuals/water ratio was 1: 20 for NA and 1:15 for AA, at the ratio of which the most of polysaccharide was isolation (
18,
19).
The polysaccharide yield of the fourth time extraction became very low compared with three times. In order to improve production efficiency of NA and AA, this process could be held on for three times. The yield increases with the extraction durations elevated and reaches a maximum in 1.5 h for NA and a significant decrease was observed when the time increasing thereafter. Similar observations were observed in 2h for AA (
Figure 1d and
Figure 2d).
Purification of polysaccharide
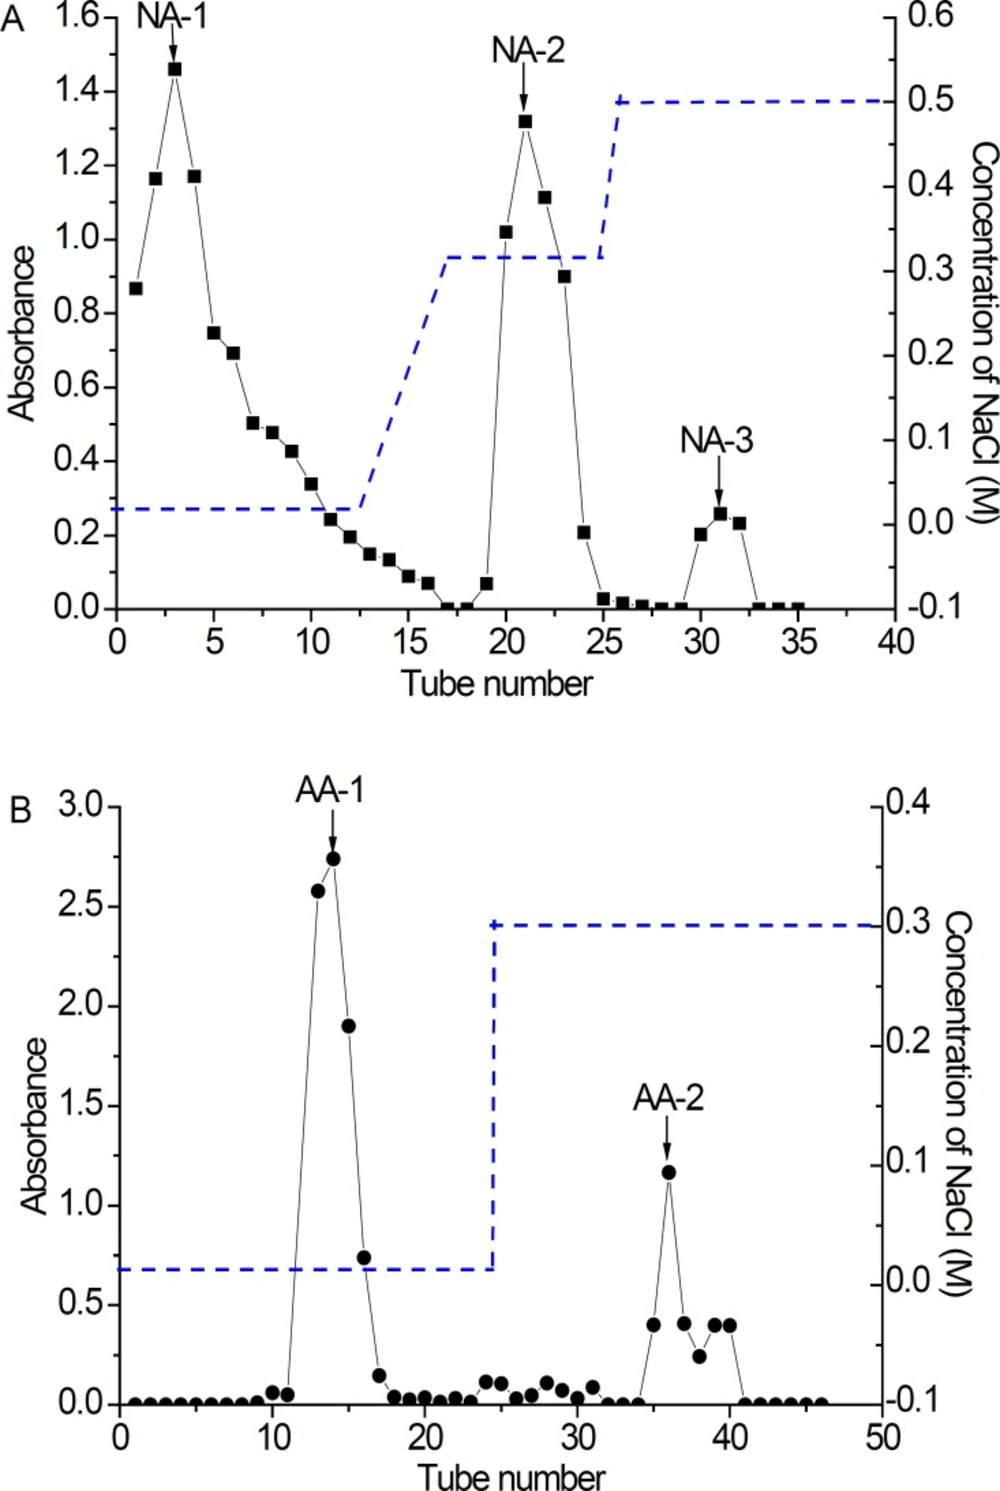
The extracts of NA and AA were fractionated by DEAE-cellulose-52 anion-exchange column to obtain five main fractions (NA-1, NA-2, NA-3, AA-1 and AA-2) based on total carbohydrate elution profile (
Figure 3). All the fractions of NA and AA appeared as white powders. They had no absorption at 280 or 260 nm in the UV spectrum, indicating the absence of protein and nucleic acid. After NA fractionation on DEAE– cellulose 52 anion-exchange column, NA-1 (166.9 mg), NA-2 (100 mg) and NA-3 (16.8 mg) were obtained from 0 mg/L, 0.1 mg/L and 0.3 mg/L NaCl elution, respectively (
Figure 3a). In a similar manner, a lyophilized fraction of polysaccharides AA was chromatographed on a DEAE Cellulose-52 anion-exchange column to yield two peaks, AA-1 (98.2 mg) and AA-2 (180 mg) (
Figure 3b). However, there were no absorbance for 0.1 mol/L NaCl elution of NA, and 0.1 and 0.5 mol/L NaCl elution of AA, respectively. It is reported that the concentration of sample, elution rate and exchange capacity of the chromatography column was closely related to separation effect (
14,
18).
Elution curve of polysaccharide fractions in DEAE–cellulose 52 anion-exchange column purified by different concentrations of NaCl aq. A: NA (1, 2 and 3); B: AA (1 and 2) (-●- Absorbance at 490 nm .... NaCl gradient). NA: Neutral Anemaran; AA: Acid Anemaran.
FT-IR analysis
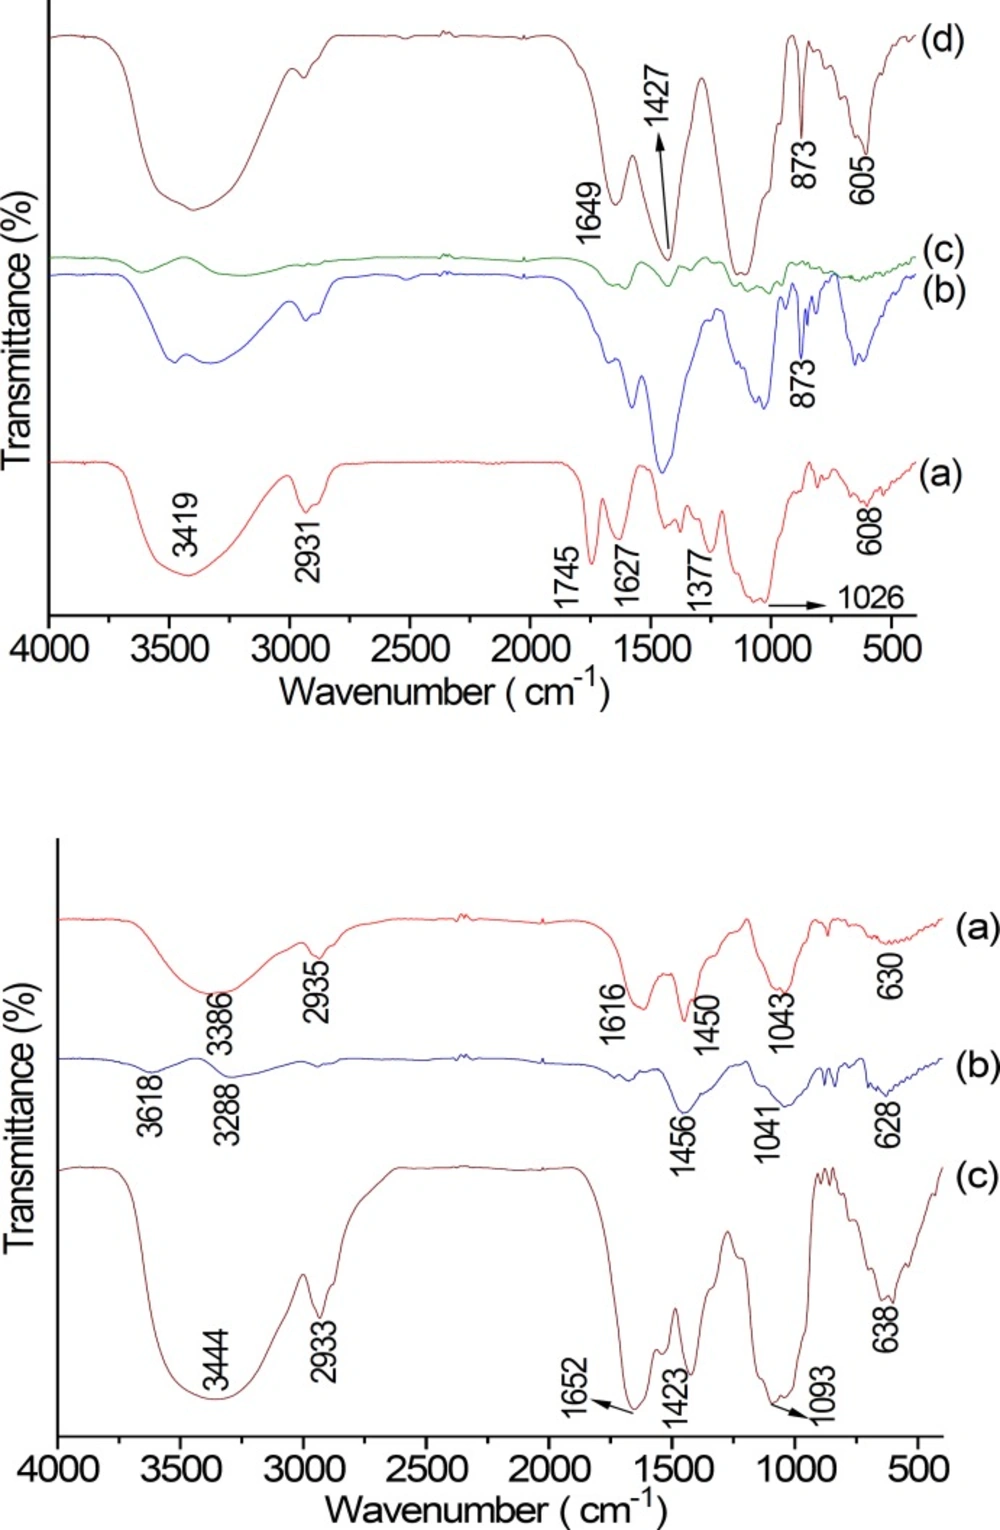
FT-IR spectrum of NA, AA and their purified fractions are shown in
Figure 4-1, 2. The FT-IR spectra of NA and AA were found to be similar. The band between 3600 and 3300 cm
−1 (NA: 3419 cm
−1, and AA: 3444 cm
−1) represented the stretching vibration of polysaccharide glycoside hydroxyl. The small band at around 2933 cm
−1 was associated with stretching vibration of C–H in the sugar ring (
26). The peak at around 1745 cm-1 and the weak one at near 1377 cm
-1 of NA were different from that of AA. The two peaks above were indicative of the presence of carboxyl groups, which indicated the characteristic FT-IR absorption of uronic acids (
27,
28). The bands at 1649 cm
−1 (
Figure 4-1d) and 1652 cm
−1 (
Figure 4-2c) displayed the –CHO stretching vibration or N–H deviational vibration of protein; peak at 1423 cm
-1 displayed C–O stretching vibration of galacturonic acid. The absorption peak at about 1627 cm
−1 was due C=O stretch of carboxylic anions (salt) of galacturonic acid. A hydration peak of polysaccharide at 873 cm
-1 indicated that NA-1 and NA-3 contained the
β-glycosidic linkage (
25,
29). Therefore,
β-galactan was mainly observed in NA-1 and NA-3. However, there is no absorption at 4000 cm
−1 and 400 cm
−1 in NA eluting with 0.3 mol/L NaCl aqueous solution and AA eluting with 0.3 mol/L NaCl aqueous solution.
(1) FT-IR spectrum of NA fraction: NA(a); NA-1(b); NA-2 (c); NA-3 (d).NA, Neutral Anemaran. (2) FT-IR spectrum of AA parts: AA (a), AA-1(b), AA-2 (c).
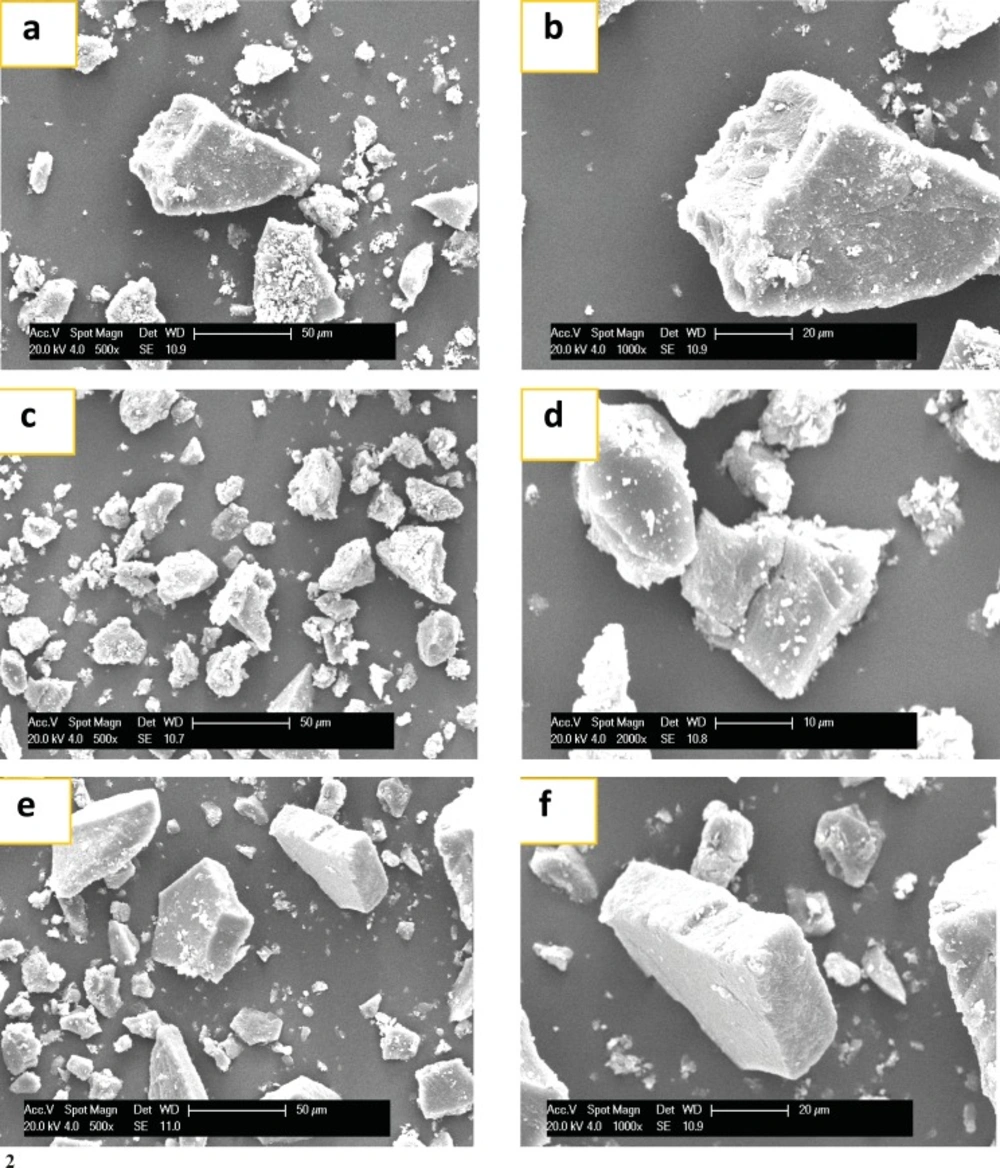
SEM analysis
The SEM photographs of NA, AA and their different fractions are shown in
Figure 5-1, 2. Crude NA anemaran exhibited large irregular non-homogeneous lumps with cracks and particle on the surface of the granules. However, the crude AA displayed polygonal or irregular shape with no cracks. NA-1, NA-2 and NA-3 fractions compared with crude NA showed significant variation in size and shape when viewed by SEM. The size became smaller and fewer particles adhered to the granules with concentrations of NaCl aqueous solution increasing from 0-0.5 mol/L for NA. The similar phenomenon occurred in AA.
(1) SEM of NA fractions. (a): NA (500×); (b): NA(1000×); (c): NA-1(500×); (d): NA-1(1000×); (e): NA-2 (500×); (f): NA-2 (1000×); (g): NA-3 (500×); (h): NA-3 (1000×). NA: Acid Anemaran. (2) SEM of AA. (a): AA (500×); (b): AA (1000×); (c): AA-1 (500×); (d): AA-1(1000×); (e): AA-2 mol/L (500×); (f): AA-2 (1000×). AA: Acid Anemaran.
In-vitro growth inhibition of HepG2 cells
The cytotoxicity (growth inhibition) of NA and AA was evaluated in HepG
2 cells after treatment of the cells with increasing concentrations (0.05, 0.1, 0.5 and 1 μg/mL) of samples using MTT assay against blank control groups (
Table 1). With concentration ranging from 0.05 to 0.5 μg/mL, NA did not significantly inhibit the growth of HepG
2 cells. Furthermore, the effect of NA at concentration of 1μg/mL was not detected. AA did not significantly exhibit inhibition ratios when the concentrations varied from 0.05 to 0.1 μg/mL with inhibition ratio of 0.0027%~0.0192%, which was higher than that of NA. Anemaran and steroidal saponins of Rhizome
Anemarrhena have been identified as the active components responsible for hypoglycemic action and anti-tumor effects (
5-
9). However, most studies merely focused on the cytotoxicity of the Rhizome
Anemarrhena extracts and little information regarding the cytotoxicity. We have successfully identified that the fractions of NA and AA did not significantly inhibit the growth of HepG2 cells.
| Treatment | Concentration (μg/mL) | Growth inhibition rate (%) |
|---|
| Normal Control | − | 0 |
| NA | 1 | nd |
| 0.5 | 0.0092 ± 0.0004 |
| 0.1 | 0.0162 ± 0.0024 |
| 0.05 | 0.017 ± 0.0018 |
| AA | 1 | nd |
| 0.5 | nd |
| 0.1 | 0.0192 ± 0.0016 |
| 0.05 | 0.0027 ± 0.0032 |
Glucose consumption assay
Complicated metabolic disorders cause diabetes with high blood glucose level. The secretion of insulin may decrease with a decrease in pancreatic
β cell mass or function disturbances of
β cells (
30). The liver cells are more resistant than the muscle tissue and the fats. Insulin resistance in liver cells results in impaired glycogen synthesis and a failure to suppress glucose production (
31). So, we used HepG
2, a human hepatoma cell line, with high concentration of insulin (2×10
-6 M) to establish an insulin-resistant cell model, which expressed an insensitive response to normal-concentration insulin (10-9 M).
Table 2 showed high-concentration insulin-treated HepG
2 cells suffered an obvious glucose consumption decrease compared with the normal cells (ap < 0.01), indicating the insulin-resistant model was simulated successfully
in-vitro. After the liver cells were treated with NA and AA for 24 h, the glucose consumption increased at the concentrations from 0.05 to 1 μg/mL. The results suggest that NA can increase the glucose consumption significantly of insulin-resistant cells compared with the model control cells (*p < 0.05). Insulin-resistant cells were more sensitive to NA than to the AA. However, the purified fractions of NA and AA have no hypoglycemic activity
in-vitro. It has been reported that anemarans A, B, C and D and many other polysaccharides could decrease of blood glucose
in-vivo (
1). However, the total neutral anemarans showed significant hypoglycemic activity, which is different from the results reported above (
1).
| Treatment | Concentration (μg/mL) | Glucose consumption (mmol/L) |
|---|
| Normal Control | 0 | 6.82±0.24 |
| Diabetic Control | 0 | 4.35±0.05 |
| NA | 1 | 6.43±0.98*a |
| 0.5 | 6.03±0.29*a |
| 0.1 | 5.66±1.01*a |
| 0.05 | 5.38±0.84 |
| AA | 1 | 5.33±0.87 |
| 0.5 | 4.73±0.12 |
| 0.1 | 4.47±0.18 |
| 0.05 | 4.39±0.13 |