
Introduction
Experimental
| Group | Single injection of STZ (45 mg/kg) | Atorvastatin | Atorvastatin | NTG (50 mg/kg/d, s.c. injections b.i.d.) |
|---|---|---|---|---|
| Normal 1 | - | - | - | - |
| Diabetic 1 | + | - | - | - |
| Normal 2 | - | + | + | - |
| Diabetic 2 | + | + | + | - |
| Normal 3 | - | - | - | + |
| Diabetic 3 | + | - | - | + |
| Normal 4 | - | + | + | + |
| Diabetic 4 | + | + | + | + |
| Normal 5 | - | - | + | + |
| Diabetic 5 | + | - | + | + |
Results
| Group | 2 Weeks | 8 Weeks |
|---|---|---|
| Control | 161 ± 12 | 158 ± 15 |
| Diabetic | 315 ± 10a | 295 ± 14a |
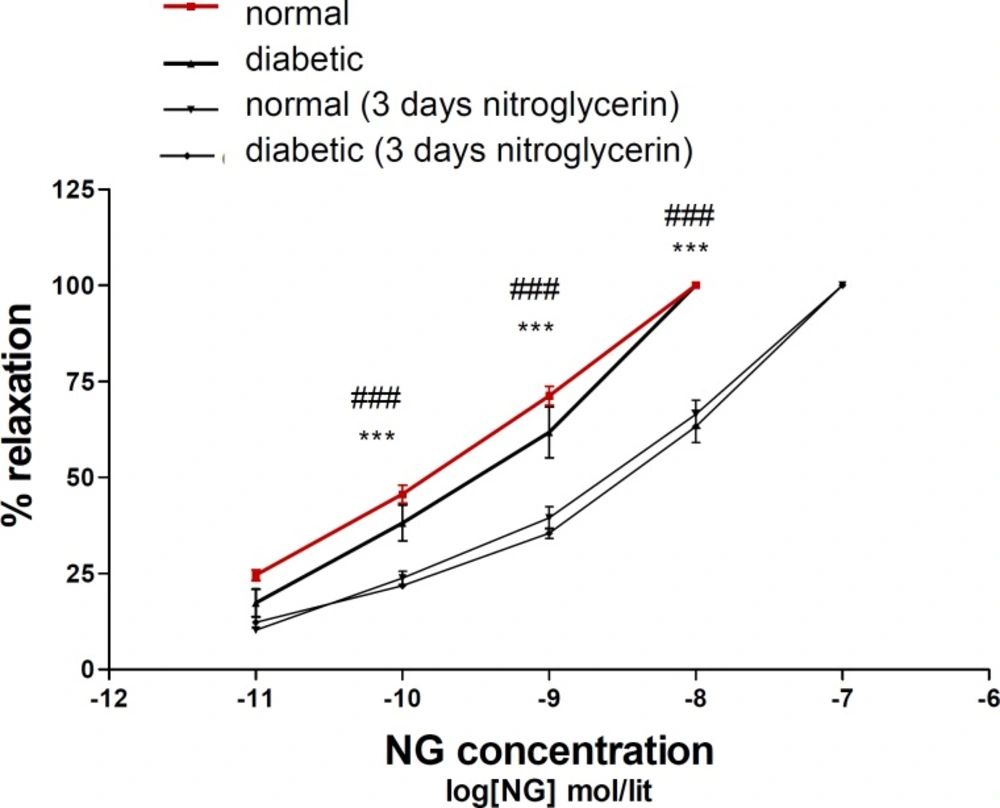
Concentration–response curves to nitroglycerin (NTG) in the phenylephrine (1 μM) pre-contracted aortic rings isolated from normal rats (■), diabetic rats (▲), normal rats treated with NTG for 3 days (▼) and diabetic rats treated with NTG for 3 days (♦). Data are mean ± SEM. A statistically significant difference was observed between normal (3 days NTG) rats comparing with normal rats not exposed to NTG. ***P < 0.001. There is also significant difference between diabetic (3 days NTG) rats comparing with diabetic rats not exposed to NTG. ### P < 0.001
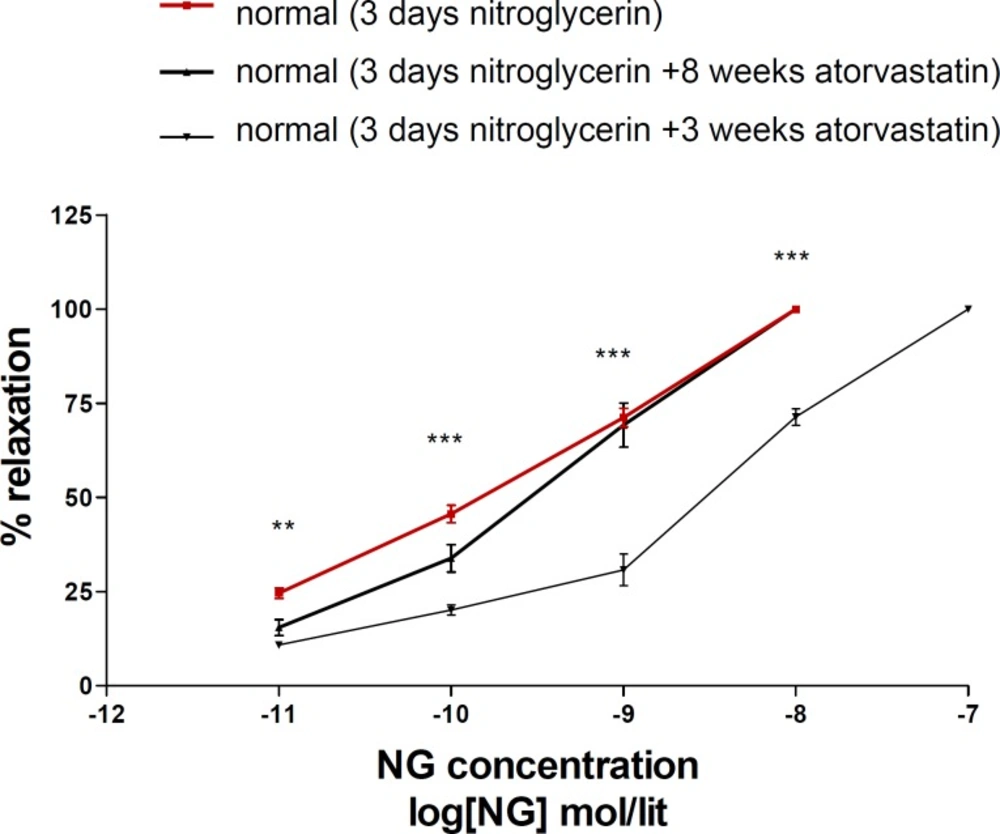
Concentration–response curves to nitroglycerin (NTG) in the phenylephrine (1μM) pre-contracted aortic rings isolated from normal rats exposed to NTG for 3 days (■), normal rats treated with atorvastatin (10 mg/kg p.o.) for 8 weeks and exposed to NTG for 3 days (▲) and normal rats treated with atorvastatin (10 mg/kg p.o.) for 3 days and exposed to NTG for 3 days (▼). Data are mean ± SEM. A statistically significant difference was observed between normal (3 days NTG) rats comparing with normal rats (3 days NTG) treated with atorvastatin (10 mg/kg/d p.o.) for 3 days. ***P<0.001; **P < 0.01. There is not significant difference between normal (3 days NTG) rats comparing with normal rats (3 days NTG) treated with atorvastatin (10 mg/kg/d p.o.) for 8 weeks (P > 0.05).
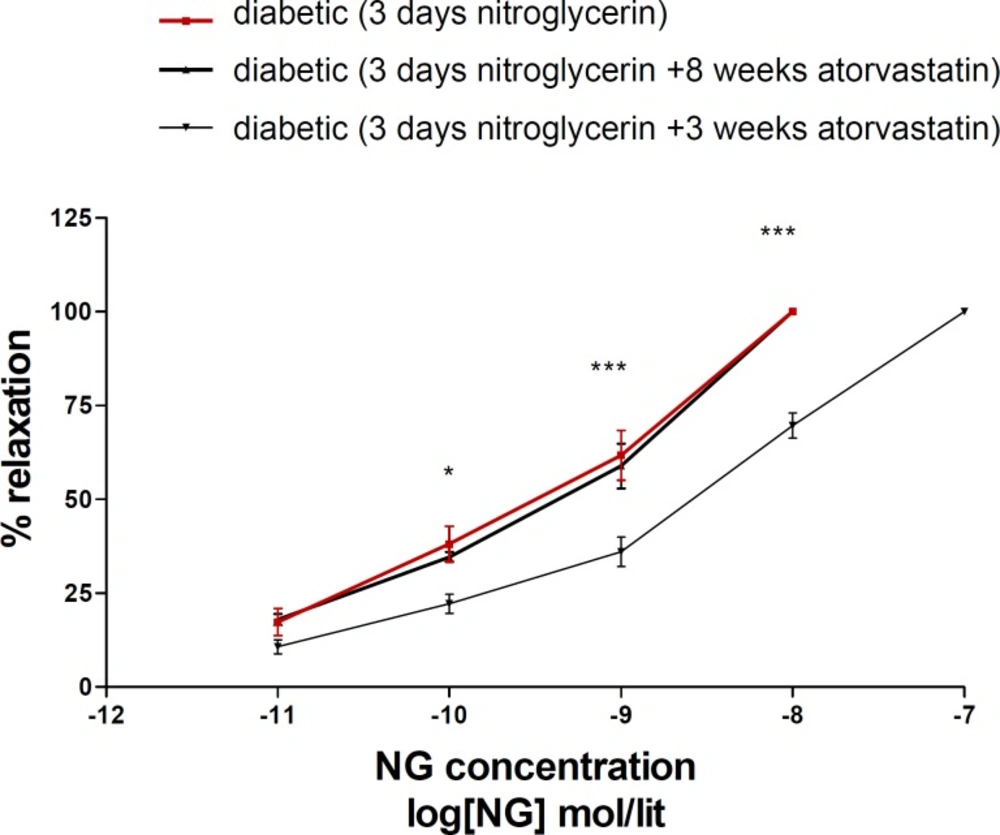
Concentration-response curves to nitroglycerin (NTG) in the phenylephrine (1 μM) pre-contracted aortic rings isolated from diabeticl rats exposed to NTG for 3 days (■), diabetic rats treated with atorvastatin (10 mg/kg/d p.o.) for 8 weeks and exposed to NTG for 3 days (▲) and diabetic rats treated with atorvastatin (10 mg/kg p.o.) for 3 days and exposed to NTG for 3 days (▼). Data are mean ± SEM. A statistically significant difference was observed between diabetic (3 days NTG) rats comparing with diabetic rats (3 days NTG) treated with atorvastatin (10 mg/kg/d p.o.) for 3 days ***P < 0.001; **P < 0.01; *P < 0.05. There is not significant difference between diabetic (3 days NTG) rats comparing with diabetic rats (3 days NTG) treated with atorvastatin (10 mg/kg p.o.) for 8 weeks (P > 0.05).
