Cell lines and culture conditions
The human cancer cell line HT1080 (human fibrosarcoma), human non-small cell carcinoma (NSCLC) cell line, A549 and MCF7 (human breast carcinoma cell line) were purchased from the National Cell Bank (Pasture Institute of Iran, Tehran). The cells were cultured in the RPMI1640 medium (Biosera, England) supplemented with 10% heat-inactivated fetal bovine serum (FBS; Biosera, England) and antibiotics (100 U penicillin/mL and 100 µg streptomycin/mL; Gibco, USA) and incubated at 37 °C and 5% CO2 in a humidified atmosphere.
Plasmids construction (primer designing, cloning and subcloning)
The full length FHIT/pcDNA3 construct was prepared from the FHIT/pCR2.1 plasmid which had been previously cloned and sequenced in our lab. The FHIT cDNA was directionally subcloned into the BamHI/EcoRV site of the pcDNA3. Two truncated constructs, named FHIT17 and FHIT34, were generated by PCR using FHIT17 5´-CCCTATGTAGCGATGCTCAAAACAG
AA-3´(sense), 5´-CCTCTCACTTATCGTCATCATCCTTATAGTCTCCAGCCTTCCTG-3´ (antisense) and FHIT34 5´-TGTGGCGATGGGTCATGTCCTTGTGTGC-3´ (sense), and 5´-CCTCTCACTTATCGTCATCATCCTTATAGTCTCCAGCCTTCCTG-3´ (antisense) specific primer pairs, carrying restriction enzyme sites, and then cloned into the pcDNA3 mammalian expression vector.
For proper expression, the ATG and Kozak sequence in 5’ and the stop codon in 3’ regions of the constructs were engineered, respectively. The truncated forms were amplified in a 50 µL reaction mixture containing 100 ng full length FHIT as template, 10 pmol of each primer, 0.2 mM dNTP, 1.5 mM MgCl2, and 0.5 U Taq polymerase in 1X PCR buffer (all from CinnaGen Co., Iran) under the following PCR conditions: initial 95 °C for 2 min and then 30 cycles at 95 °C for 30 sec, 65.8 °C (for FHIT17), or 69.7 °C (for FHIT34) for 40 sec, 72 °C for 18 sec followed by a final 10 min extension at 72 °C. The reactions were verified on a 1% agarose gel by ethidium bromide staining.
The PCR products were purified from the gel, cloned into pGEM_Teasy (Promega, USA), and subcloned into pcDNA3 (Invitrogen, USA) in the EcoRI site. The generated plasmids were analyzed by agarose gel electrophoresis and DNA sequencing was performed to verify the sequences.
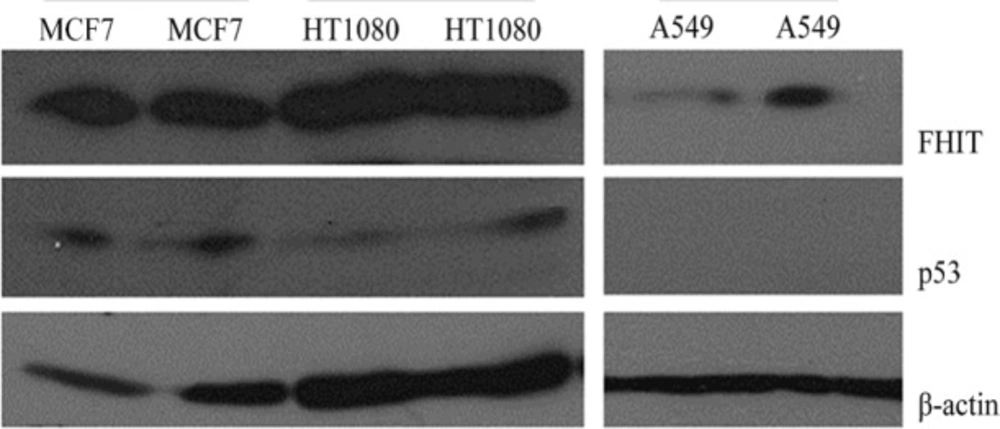
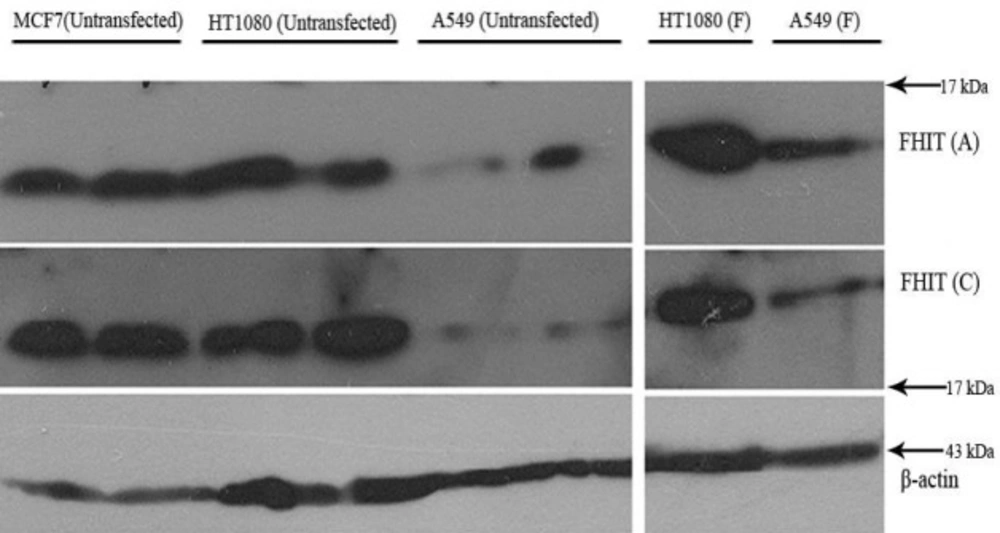
Western blotting
The cells were lysed and the proteins were extracted using a sodium dodecyl sulfate (SDS) lysis buffer. The transfected cells were lysed 24 h after transfection. The protein samples were boiled for 7 min, resolved on 12% SDS-PAGE, and electroblotted onto a polyvinylidene difluoride (PVDF) membrane (Roche, Germany) using a semidry apparatus (Peqlab, Erlangen, Germany). The blots were blocked in casein blocking buffer (1% casein in TBS and 0.05% tween 20); and incubated at 4 °C overnight, using anti-p53 (Cell Signaling Technology, USA) or anti-FHIT (Abcam, USA) as primary antibody. The primary antibody was revealed using horseradish peroxidase-conjugated secondary antibodies (1:10000; BioRad, USA) and the protein bands were detected using a chemiluminescence kit (Roche, Germany) on X-ray films (Fujifilm, Japan).
The membranes were stripped and reprobed using β-actin antibody (1:1000; Santa Cruz Biotechnology) as the internal control. The protein bands were digitized and the band intensity was quantified using the ImageJ software (NIH, USA).
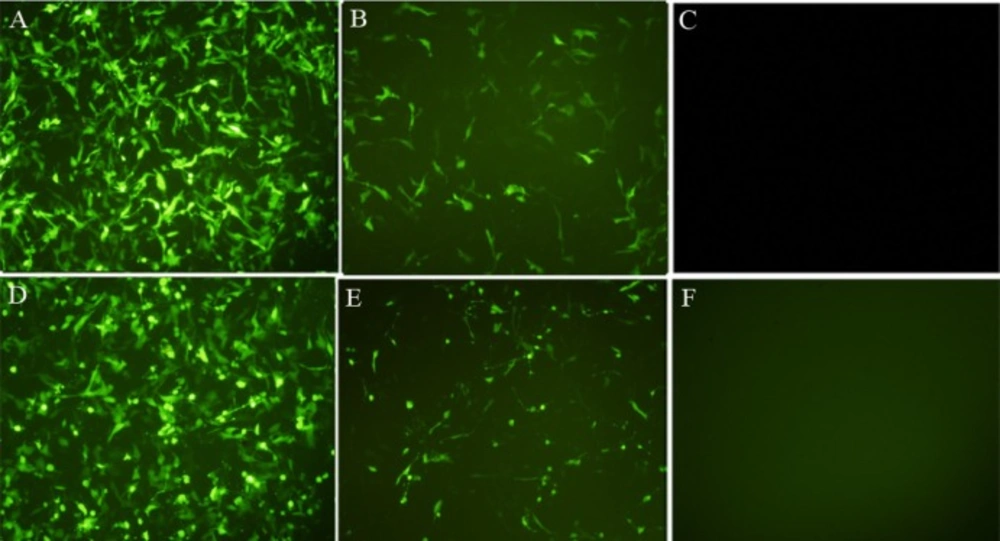
Transient transfection
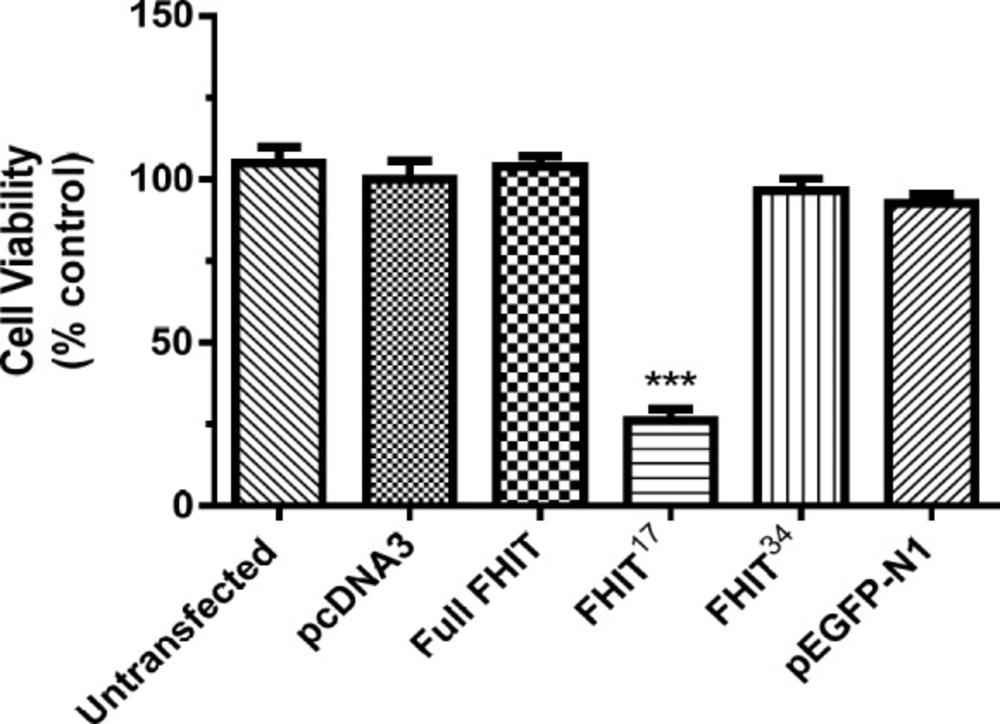
HT1080 cells were plated at 104 cells/well in 96 wells and cultured for 24 h. At 60-70% confluence, the cells were transfected with full FHIT-pcDNA3, FHIT17-pcDNA3, FHIT34-pcDNA3, or pcDNA3 (vector control) plasmids using FuGENE6 (Roche, Germany) or Lipofectamin 2000 (Invitrogen, USA) and cultured in RPMI. The transfection efficiency was evaluated by the transfection of pEGFP-N1 in these cells.
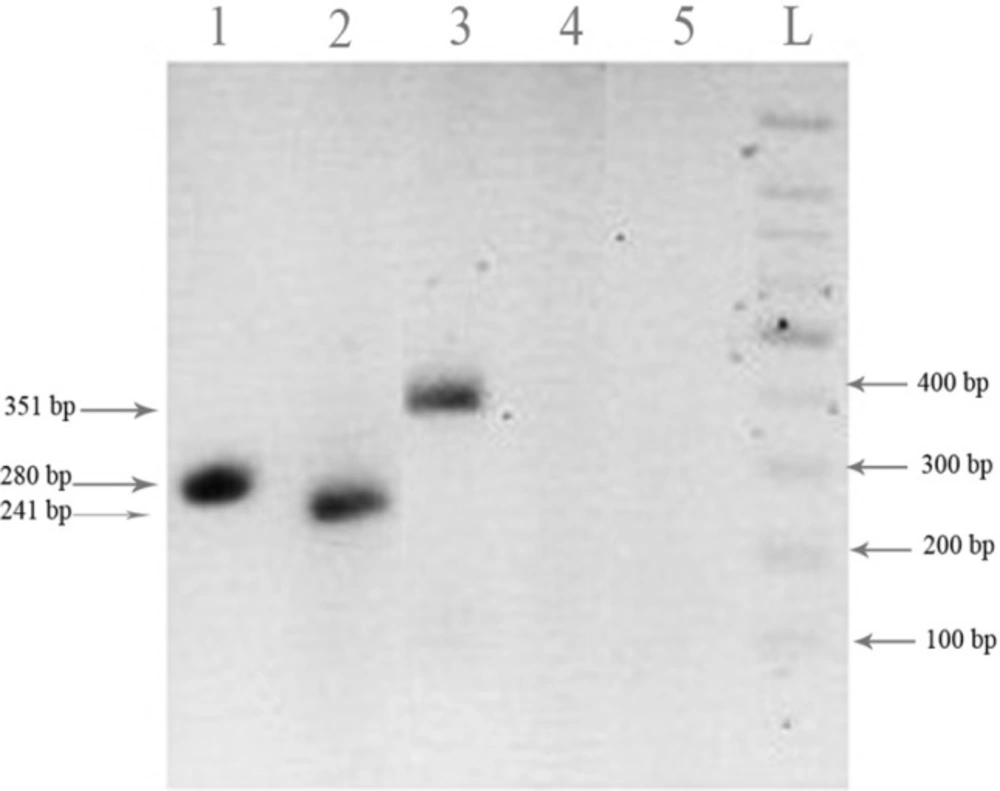
RT-PCR analysis
At 24 h after transfection, mRNA expression of truncates were analyzed. Total RNA was extracted from the HT1080 cells using Tripure reagent (Roche, Germany), according to the manufacturer’s instructions. To eliminate the genomic and/or plasmid DNA contaminations, the extracted RNAs were treated with DNase I (Qiagen, Germany) for 30 min, after inactivation with 25 mM EDTA. The RNA quality was confirmed by the A260/A280 absorbance. Two micrograms of RNA were reverse-transcribed to a single stranded cDNA, using random hexamer primers and M-MLV reverse transcriptase (Fermentas, Ukraine). Expression analysis of FHIT truncated constructs was performed in a 50 µL reaction mixture containing: 2 µg cDNA, 10 pmol of each primer, 0.2 mM dNTP, 1.5 mM MgCl2, 0.5 U Taq polymerase, 1x PCR buffer, and 1% Q-solution (Qiagen, Germany). PCR amplification of FHIT truncates and β-actin was performed under the following conditions: initial 95 °C for 2 min and then 30 cycles at 95 °C for 30 sec, 61.4 °C (for FHIT17), or 60.5 °C (for FHIT34) for 40 sec, and 60 °C (for β-actin) for 30 sec, 72 °C for 18 sec, 15 sec, and 40 sec followed by a final 10 min extension at 72 °C.
TheFHIT17 5´- GAACTGTCCTTCGCTCTTGTG-3´ (sense), 5´-TATCGTCATCATCCTTATAGTCTCC-3´ (antisense), and FHIT34 5´-ATGGGTCATGTCCTTGTGTG-3´ (sense), and 5´- TATCGTCATCATCCTTATAGTCTCC-3´ (antisense) primers were designed to amplify only the truncated constructs and to avoid amplification of endogenous FHIT. β-actin was used as the internal control.
Drug treatment and cytotoxicity assay
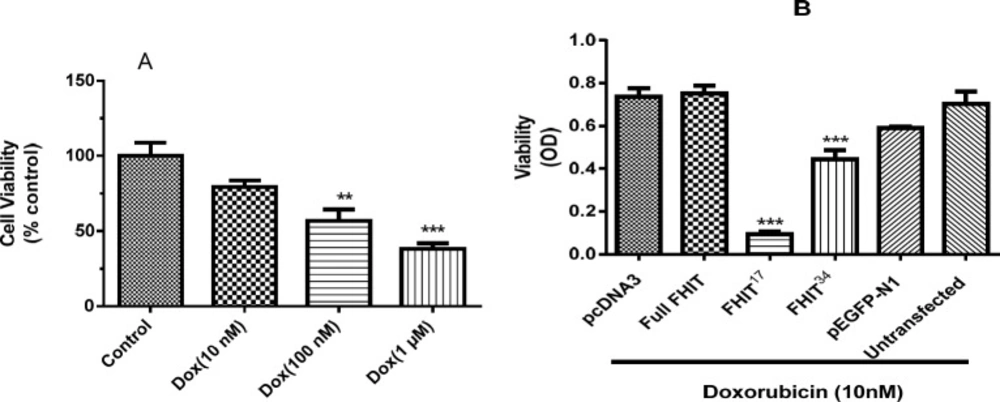
HT1080 cells were transfected (quadruplicate, n = 4) and incubated for 24 h. The cells were then treated with doxorubicin (Ebeve, Austria) at different concentrations (10, 100, and 1000 nM) for 24 h and cytotoxicity was measured by MTT assay (Sigma, UK). The change in formazan crystals was measured at OD 570 nm with OD 690 nm as a reference wavelength on the microplate reader (BioTek, USA).
Cell cycle analysis
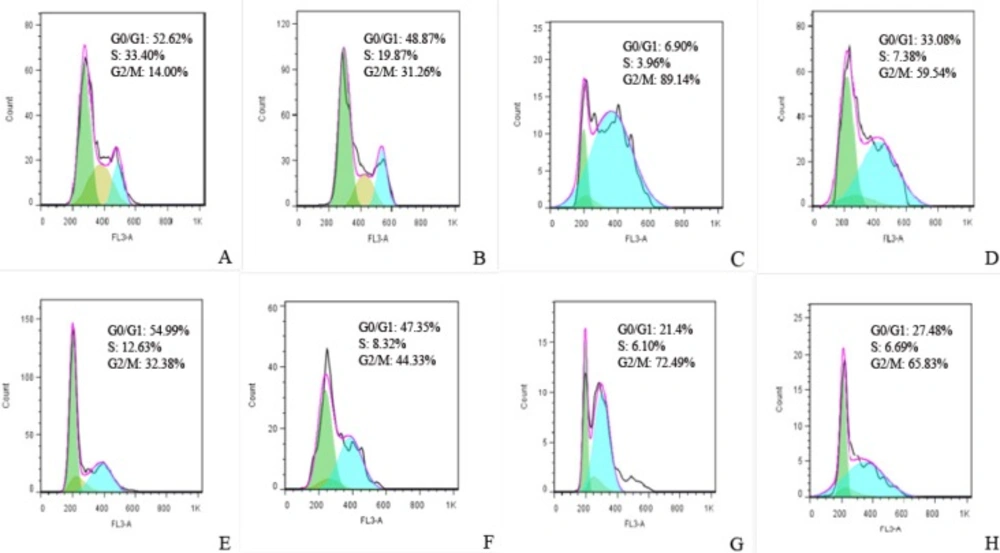
HT1080 cells transfected with the FHIT constructs, the pcDNA3 empty vector, and some transfected cells were treated with doxorubicin (10 nM). The cells were then trypsinized 24 h after transfection (or 24 h after treatment), resuspended in PBS, fixed in 70% ethanol, and incubated in fluorochrome solution containing 50 mg/mL propidium iodide DNA staining buffer (Sigma, Germany). After incubation for 3 h at 4 °C, the cell cycle distribution was recorded in FL3 using flow cytometry (FACS Caliber; Becton Dickinson, USA). The distribution of 10,000 cells was determined by the Dean Jet Fox Model, using the FlowJo software (Tree Star, Inc., Standford, CA, USA).
Statistical analysis
The results were analyzed using one-way ANOVA followed by the Tukey-Kramer post-hoc test. A p-value of less than 0.05 (p < 0.05) was considered significant. All the experiments were performed in triplicate and the results of the three independent experiments were reported as mean ± SE (n = 3).