HPLC conditions and optimum detection wavelength
The CLC is a weak polar compound with pKa= 9.3 and weak basic properties, therefore, in neutral conditions and at reversed phase column it is separated in long retention times. So, in order to have a good separation on the C-18 column with a reasonable capacity factor (k′) the pH of mobile phase was considered as a critical point for changing the CLC to protonated form with positive charge in order to be eluted at a suitable retention time. In this work various mobile phases were evaluated with isocratic elution such as:
ACN: MeOH: phosphoric acid (0.01 mol L−1; pH = 2.5) with 20: 20:60 V/V%.
ACN: MeOH: H2O: phosphoric acid (0.01 mol L-1; pH = 2.5) with 20: 20: 20: 40 V/V%.
ACN: MeOH: phosphoric acid (0.01 mol L-1; pH = 2.5) with 30: 30: 40 V/V%.
ACN: phosphoric acid (0.01 mol L−1; pH = 2.5) 60: 40 V/V%.
The results revealed that when the mobile phase (III) was used the elution of CLC on the Eurospher RP-C18 column give satisfactory K′ value. The CLC has two typical maximum adsorption peaks at 254 nm and 298 nm. In this work various wavelengths, i.e. 235, 240, 245, 254, and 298 nm were tested to monitor the optimum wavelength that was measured via response factor of the detector. It was found that the detector response factor at 240 nm was the maximum and therefore 240 nm was selected as optimum detection wavelength for CLC determination.
Optimization of TPF method
However, in order to obtain the maximum extraction and high reproducibility by TPF method for detection of CLC in plasma samples, several important variables, having effect on TPF efficiency such as pH of solution, type and volume of miscible organic solvent, the ratio volume of organic to aqueous solvent, extraction cycles, and salting out were optimized in binary mixture of ACN: aqueous buffer solution. The percent extraction yield (%EY) was considered as a response for each optimization parameter.
Extraction factor (EF) is defined as the ratio of the CLC concentration in the ACN phase (CACN) to the initial concentration of CLC (C0) within the aqueous solution:
The CACN was obtained from the calibration graph.
Percent extraction yield (%EY) is defined as the percentage of the ratio of CLC amount extracted into the ACN phase (nACN) and the total CLC amount (n0) in aqueous sample (Eq. 2).
Where VACN and Vaq are the volumes of ACN phase and aqueous solution, respectively.
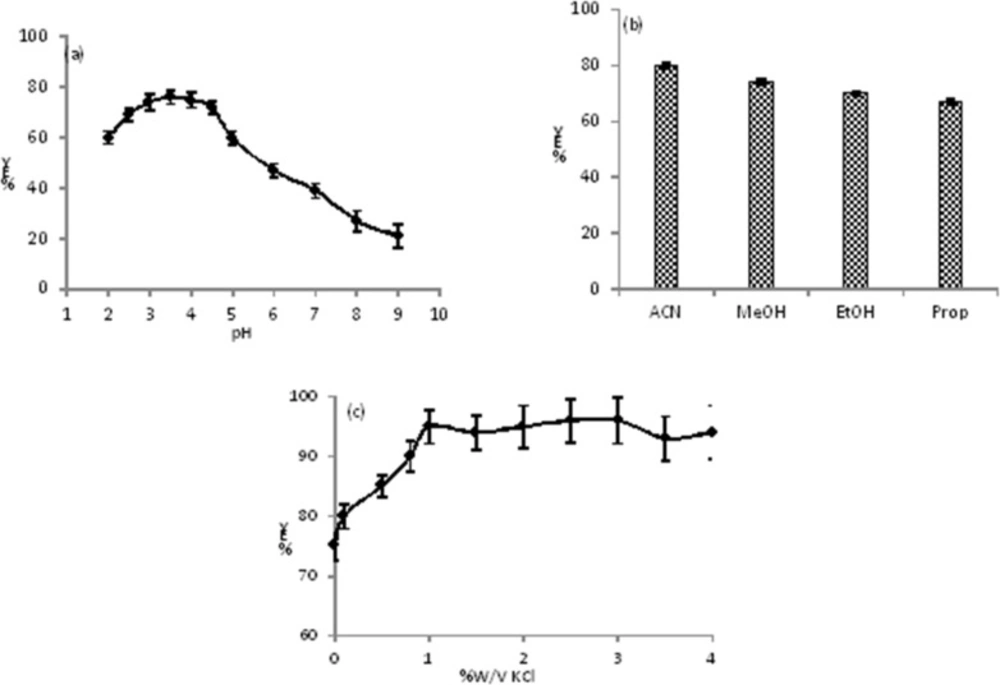
Effect of pH of aqueous solution
The is an amine weak base with pKa = 9.3, and may has different structures and charges in various pHs (
27). Therefore, the pH has an important role on the extraction of CLC into the ACN. To examine the effect of pH on the extraction efficiency, the extraction yield of CLC was studied at specific concentration of the CLC (1 μg mL
-1) in the pH range of 1.5 to 11.0 (pH was adjusted by BR buffer). The results showed that the changes of peak area in the pH range of 2.5 to 4.5 was roughly constant while a noteworthy fluctuation in the peak area
vs. pH took place below and above the stated pH limits (
Figure 1a). Under strong acidic pHs (pH < 2.5) the CLC may be unstable and decomposed. We previously reported that the ACN has basic properties (
28,
29) and in the pH range of 2.5-4.5 the type III amine of CLC is protonated and has acidic properties therefore, an acid-base interaction was occurred between CLC and ACN molecules. At higher pHs (pH > 4.5) the concentration of proton (H
+) in the solution decreased, so more H
2O molecules interact to lone pair electron of amine of CLC via hydrogen binding. Therefore, the tendency of CLC to the ACN reduced and the extraction decreased. In the pH range of 2.5 to 3.5 the extraction yielded slowly increased and reached to its maximum value at 3.5 and then a steep decrease was observed with pH = 4.5. So, we have selected the pH = 3.5 for the next studies.
Choice of organic solvent on extraction and extraction cycles
The extraction of target into the organic solvent must be affected by the solvent medium and depends on a range of factors including: type of solvent, solvent donor ability, solvent acceptor ability, and solvent-solute hydrogen-bonding properties. During the TPF extraction in homogenous binary mixture solution, the organic solvent should remove the CLC from proteins and also replace the H
2O molecules of first solvation shell of CLC with its own molecules. The effect of various miscible organic solvents such as MeOH, EtOH, ACN, and propanol on extraction efficiency was intensively investigated for specific concentration of the CLC (1 μg mL
-1) in the pH = 3.5. In our investigation, the maximum extraction efficiency was obtained for ACN in pH = 3.5 (see
Figure 1b).
The water molecules have high solvating (DN = 33) and hydrogen-bonding ability, while the ACN is an aprotic and protophobic dipolar solvent and rarely interacts with CLC by hydrogen bonding (DN = 14.1) in neutral and or alkaline pHs (
29). Therefore, in pH = 3.5 due to hydrophobic and acid-base interactions between ACN and protonated CLC, the highest extraction efficiency were obtained in comparison with other organic solvents. Due to high miscibility of ACN with plasma and proteins denaturation, the CLC is completely removed. Also highest interaction occur between ACN and CLC and caused more extraction efficiency.
Salting out effect and cycle of extraction
The effect of salting-out on TPF efficiency was investigated using KCl in the range of 0.0 to 4.0 %W/V at pH = 3.5. At above 0.0 %W/V of KCl, an increasing in the extraction efficiency of CLC in ACN phase was observed and reached to a constant value at 1.0 %W/V, therefore, 1.0 %W/V of KCl was used (see
Figure 1c). We studied the effect of number of extracting cycle and this factor does not have any effect on extraction yield. In addition, the best solvent ratio (aqueous solution/ACN) of 3 with one extraction cycle gave highest recovery (more than 93%) and reproducibility.
Comparison of TPF with LLE method in plasma samples
To our search data we achieved the proposed TPF gave less concentration factor (aqueous/CAN = 3) in comparison to LLE method which used MTBE as extracting solvent (
12,
13,
15,
16,
18,
19). Nevertheless, the LLE method has: environmental and health problems and low reproducibility. In addition, due to inherent immiscibility of MTBE with plasma, no well interaction occurred between CLC molecules in plasma and organic solvent molecules. The results of proposed method and LLE method were placed in
Table 1.
In laboratory by addition of MTBE and/or ACN into plasma the proteins were precipitated and produced solutions with three phases (protein + aqueous + MTBE) in LLE and two phases (protein + binary mixture of aqueous-ACN solution) for TPF. The LLE is carried out in one step including: addition of MTBE → vigorously shaking → separation of three phases → collection of organic phase → direct injection of organic phase into the chromatographic system; while TPF method is performed in two steps including: I) addition of ACN → vigorously shaking → separation of two phase; II) separation of ACN from the homogenous solution by TPF method → injection of ACN into the chromatographic system. To compare the two methods the %EY for each method was measured as follows:
For TPF in plasma sample the extraction factor (EFpla) is defined as the ratio of CLC concentration in the ACN phase (CACN) to the initial concentration of CLC (CHBS) within the homogeneous binary solution (Eq. 3):
The CACN was obtained from the calibration graph similar to equation (1).
The percent extraction yield of TPF method (%EYTPF) is defined as percent ratio of amount of CLC extracted into the homogeneous binary solution phase (nHBS) to total amount of CLC (nP) in plasma sample (Eq. 4).
Where VHBS and VT are the volumes of homogeneous binary solution phase and total volume sample, respectively.
The VT and VHBS were measured by equations 5 and 6, respectively.
Where the Vpro is the volume of precipitated protein.
By inserting equation (3) into the equation (4) the equation (7) is obtained:
The VHBS is measured as: .
The %EYLLE for liquid-liquid extraction was measured by equation (8) as follows:
Where V
P and V
MTBE are the volume of plasma and MTBE, respectively. As it is observed in
Table 1, the TPF method gave better extraction yield.
The advantageous of TPF than to other phase separation methods
ACN and water are completely miscible at any ratio and the phase separation of this binary mixture (ACN-water) was often performed by addition of an inorganic salt. At pure ACN high polar compounds and proteins poorly soluble, while in binary mixture of ACN-water solution these compounds are significantly soluble (
30); in other words, the water molecules in the solution help to enhance solubility of the proteins in ACN. So, we believe these protein molecules in binary mixture solution act as a barrier to complete extraction of CLC and also reduced the life time and efficiency of chromatographic column. Therefore, the phase separation seems to be critical. The common protocol for phase separation of ACN-water mixture is salt addition, in which a water-enriched lower and an ACN-enriched upper phase are generated. Although, magnesium sulfate is often used than other salts like sodium sulfate or sodium chloride (
31) for phase separation of ACN, it may give a very poor recovery for drugs due to metal complex formation. Already, the complex formation between magnesium ions and tetracyclines and quinolones were reported (
32). Additionally, due to non-volatile properties of magnesium sulfate it may accumulate in the LC–MS interface (
33).
As the complex formation of analytes with magnesium sulfate caused insufficient recoveries, therefore, various phase separation methods such as: counter current salting-out homogenous liquid–liquid extraction (
34), salting out supported liquid extraction (SOSLE) (
32), and LLE (
19) were used for extraction of organic analyte from plasma and biological fluids. However, these methods were performed in several steps and caused loss of analyte. To overcome this problem the physical phase separation seems to give higher recovery and clear solution (
35). Also, the recovery and reproducibility of the work is very important.
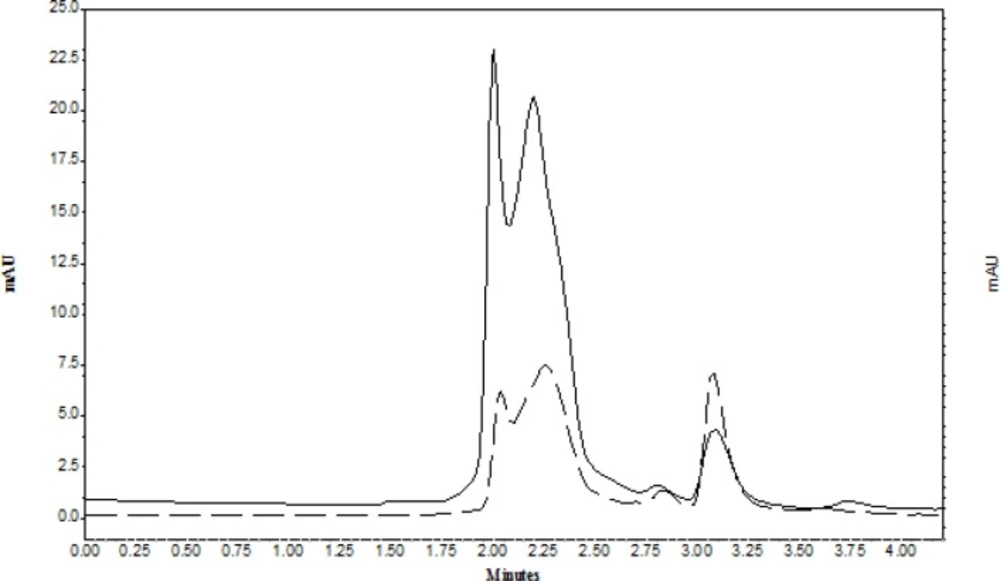
Figure 2 represented the chromatogram of CLC in supernatant of water-ACN before TPF (solid line) and after TPF (dash line). As it is observed in TPF the peak area of CLC increased and the peak area of proteins significantly reduced.
Validation of the method
The validity, reproducibility, and clean satisfactory of solution in plasma samples were evaluated in terms of linear range (L.R), limits of detection (LOD), limits of quantification (LOQ), precision (RSD), trueness, ruggedness, and reality.
(a) Extraction yield (%EY) of CLC into the ACN versus pH of aqueous phase, the conditions were as follows: Vaq= 1.0 mL, VACN=0.3 mL, the amount of CLC=1.0 μg mL−1, Vbuff= 0.2 mL, number of extraction cycle = 1, no salt was added; (b) the effect of various organic phase on extraction yield (%EY) of CLC, the conditions were as follows: Vaq=1.0 mL, Vorg= 0.3 mL, the amount of CLC =1.0 μg mL−1, Vbuff=0.2 mL, number the amount of CLC=1.0 μg mL−1, pH aqueous phase =3.5, number of extraction cycle=1, no salt was added; (c) effect of salting out on extraction efficiency, the conditions were as follows: Vaq=1.0 mL, VACN=0.3 mL, Vbuff = 0.2 mL, the amount of CLC=1.0 μg mL−1, pH aqueous phase = 3.5, number of extraction cycle = 1. All measurements were three times repeated (n = 3)
A sample chromatogram of CLC that extract from plasma in: (solid line) in supernatant of water-ACN before TPF; (dash line) after TPF; under optimum conditions, the amount of CLC was 0.1 µg mL-1).
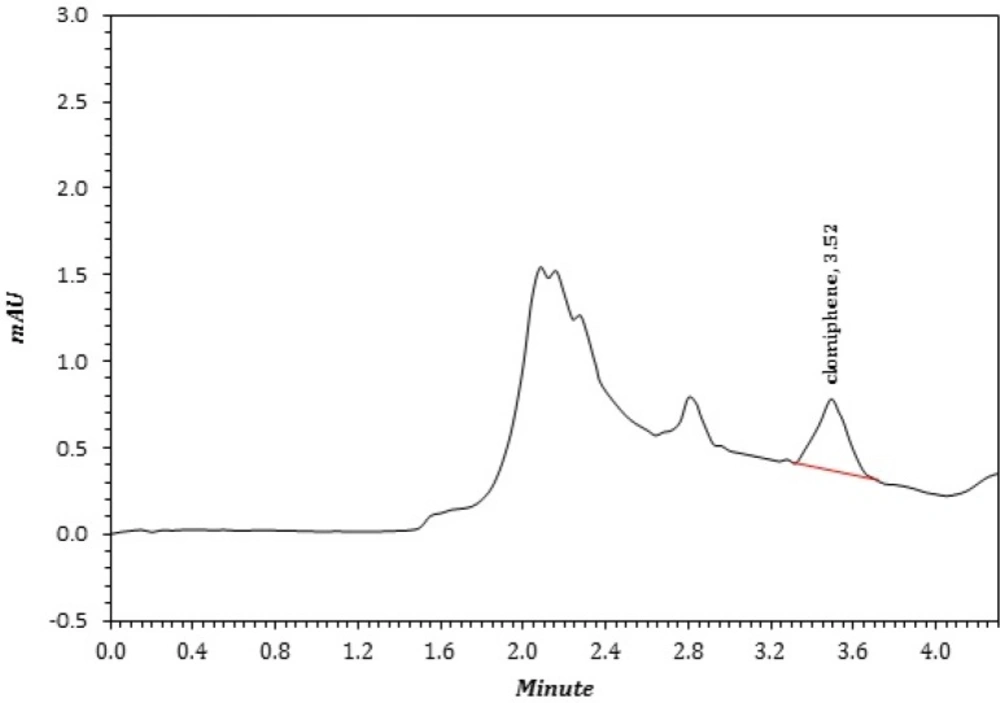
A sample chromatogram of CLC that extract by TPF method from a patient that extracted according to section 4.6 and under optimum conditions
| Compound | 0.5 µg mL-1 | | 1.0 µg mL-1 |
|---|
| %EYTPF (n = 3) | %EYLLE (n = 3) | %EYTPF (n = 3) | %EYLLE (n = 3) |
| CLC | 95.4±2.8 | 80.2±9.2 | 94.5±3.1 | 85.4±8.3 |
| Compound | Linear Range (µg mL-1) | LOD (µg mL-1) | LOQ (µg mL-1) | %RSD(n=3)intraday | %RSD (n = 3)interday | %Absolute recovery (n = 3) |
|---|
| CLC | 0.06-18 | 0.02 | 0.06 | 3.2 | 4.6 | 93.5±3.1 |
| NO of sample patient | Spiked (µg mL-1) | Found (µg mL-1) |
|---|
| 1 | 0.0 | ND a |
| 0.5 | 0.46 |
| 1.0 | 0.94 |
| 2 | 0.0 | 0.15 |
| 0.5 | 0.61 |
| 1.0 | 1.04 |
| 3 | 0.0 | 0.23 |
| 0.5 | 0.79 |
| 1.0 | 1.18 |
| 4 | 0.0 | 0.43 |
| 0.5 | 1.05 |
| 1.0 | 1.54 |
| 5 | 0.0 | ND a |
| 0.5 | 0.54 |
| 1.0 | 0.95 |
Linear range (L.R), LOD, LOQ, precision and trueness
Characteristics of the TPF method plasma-matched calibration curve were established using a plasma sample (20 years old) spiked with various amounts of CLC in the concentration range of 0.06 to 18 μg mL
-1. Each concentration level was repeated three times (n = 3) and the mean peak area was considered for each corresponding concentration. Limit of detection (LOD) and limit of quantification (LOQ) for each plasma sample were calculated as: 3×S/N and 10×S/N, respectively. All data were shown in
Table 2.
The precision of TPF method was evaluated based on intraday and interday repeatability for plasma samples that spiked with 1.0 µg mL
-1 of CLC. The intraday repeatability study was carried out over one plasma sample (20 years old) spiked with 1.0 µg mL
-1 of CLC (n = 3) on the same day and the interday was studied in three consecutive days (n = 3; total analysis=3×3). The data were shown as %RSD of the %EY, and placed in
Table 2.
For checking trueness of TPF method in real patients, the recovery of CLC was studied in one type of plasma sample (20 years old), spiked with one concentration levels of CLC. Absolute recovery (A.R) for 1.0 µg mL
-1 was obtained by comparing mean peak area of CLC in plasma after the TPF procedure with relative peak areas of CLC before the TPF. The plasma sample before spike of CLC was analyzed and the CLC was not above the LOD of the method (
Table 2).
Ruggedness and reality studies
The ruggedness of proposed method was evaluated by comparison of RSDs, obtained by two analysts in the same laboratory and the results demonstrated that none of them gave the RSD more than 5.0 %.
Also, the reality of TPF method, evaluated by a different HPLC and column with one analyst and the two side t-test (degree of freedom = 5;
p value < 0.05) revealed that this method is suitable for daily routine use (
36).
Interferences and additional peaks
The interference effects of three drugs with most likely structure and/or co administrating with CLC such as Tomoxifen, letrozole, and human menopausal gonadotropin (HMG) were tested. The results revealed that under optimum conditions most of the tested interferences did not have a remarkable effect and also did not coelute with CLC.
Real sample application of the method
In clinical usage of CLC, the concentration less than 0.1 µmol L
-1 in plasma (
25,
37) is considered as “sub therapeutic level (STL)” and has inappropriate clinical action. However, it must be mentioned that the enrichment factor (EF) of proposed method is 3 and the LOQ of method is equal to STL. Therefore, using less than the STL is commonly associated with a negative outcome. To overcome this problem in real samples, especially for doping control, the extracting ACN sample is manually evaporated and the residue was re-dissolved in 50 µL of ACN and re-analyzed for presence of CLC. In this manner the EF increased up to 16. Five patients were analyzed and the results were placed in
Table 3.
Figure 3 represented a real sample of CLC in plasma.